
Wage Growth Not as Bad as It Looks
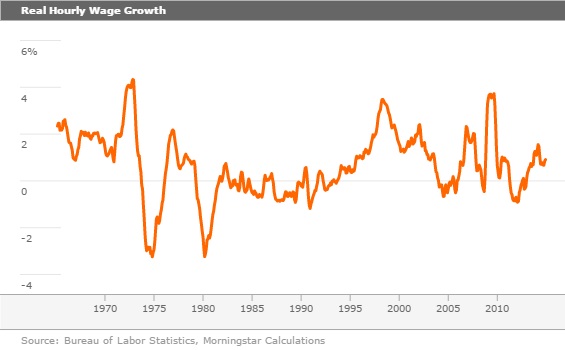
Viewed year over year, hourly wage growth has been remarkably stable and has shown improvement after adjusting for inflation.

As has been the case for many weeks, markets remained highly volatile on a day-to-day basis, with large swings in both directions. At the end of the week commodities were again the worst performer, off almost 3% on oil prices that are still hunting for a bottom. Next up on the loser list was the U.S. equity markets, where the S&P 500 was off 2.2%. I don't think there was a particularly good reason for the underperformance, other than the fact that the United States had been doing better than everyone else for so long. European equities did slightly better at negative 0.4% as everyone begins to anticipate some type of new monetary easing in Europe after recent reports of declining industrial production and outright price declines. Emerging markets, on the other hand, managed growth of over 1% for the week anticipating monetary easing around the world. Also anticipating the easing were U.S. bonds. The U.S. 10-Year Treasury bond dipped to a yield of 1.97%, down sharply from last week's 2.12% reading.
The most important economic news was the December employment report. Markets were initially excited by job growth that was better than expected (and showed some upward revisions to prior months, to boot). However, fears over a month-to-month drop in the hourly wage rate seemed to rattle markets. The market seems to be truly fixated on the month-to-month numbers, which is pure silliness because of their volatility. The annual data was still a little soft but lower inflation rates should allow consumers to gain some ground. Too, the inflation-adjusted annual wage growth rate is now at 0.6% versus a 50-year average of 0.7%, a period of considerable economic growth. I suspect the wage data will look better in 2015 as even more baby boomers retire and labor shortages continue to spread.
The auto data for December falls in the good-but-not-great category. There were a lot of nice tailwinds for industry in December, including mild weather, new models, and lower gas prices. Whether growth can be sustained with fewer tailwinds later in 2015 remains an open question.
Trade data still seemed relatively immune to world economic troubles. Strong growth in our North American trade partners seemed to offset results elsewhere around the world. Still, the export data has held up better than even I would have guessed.
Employment Growth Dips far Less Than Expected Today's employment report was a nice positive surprise, at last. December job growth of 252,000 people was above expectations of 225,000 and my dour forecast of 150,000-200,000. Just as astonishing, combined October and November job growth was revised upward by 49,000. In essence, the employment bulls were right. When combining the revisions with the actual job growth in December, employment growth was over 300,000, which is employment growth of about 2.5%. Well above the 2% or so that the U.S. economy has been averaging.
So why Were We so Wrong About December? We had two reasons for being quite negative in our predictions for December, namely, a faltering retail sector combined with tricky December seasonal factors. There was an unsustainably high job growth number of 322,000 (now revised to an even stronger 351,000). Indeed, we were right about retail--it was a near disaster, growing just 7,000 jobs versus an average growth rate of 21,000 and the November reading of 52,000. Retail sales data from conventional retailers over the holidays has not been great and they apparently acted accordingly. We were also right about the December employment report being quirky. However, I got the offending seasonal factor wrong. The construction sector added a stunning and unsustainable 48,000 workers, more than any other month of the current recovery. Without the dramatic improvement in construction, growth would have been much closer to my 200,000-worker estimate.
I think the construction numbers looked unusually good as November was much colder than usual, limiting employment growth while December was relatively warm. Now with January producing yet another month of horrible weather, I suspect the construction jobs just might shrink in January, but that would be no reason for panic. I do worry that raw construction numbers have looked a lot softer recently and that the housing-related data has been stuck in neutral. To us, the strength in construction employment doesn't appear to make much sense.
Year-Over-Year Averaged Employment Data Beats Averages Enough of the minutiae of analyzing month-to-month data. Volatility and seasonal factors make this a fool's errand that somehow none of us can ever resist. The month-to-month employment data averaged over three months and compared with the same months a year ago indeed shows at least some modest acceleration. (In fact, starting next month, the BLS will provide some employment data on a three-month moving-average basis. Maybe they've been reading our columns.)
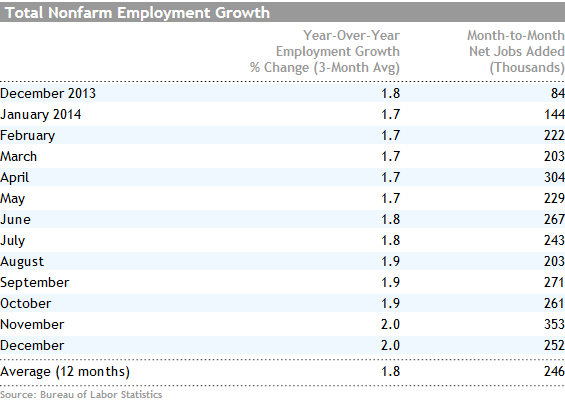
The average year-over-year gain has accelerated some recently with the December average of 2.0% growth besting the 12-month average of 1.8%. The improvement has been glacial, but clearly better. The private sector data, excluding the almost no-growth government sector, is growing at 2.4% currently versus its average of 2.2% over the past 12 months. For a longer-term perspective, annual private sector and nonfarm employment growth have both averaged 1.8% since 1950.
However, we need to throw wage growth and hours growth into the mix to see how well workers are doing in aggregate. The hours growth is little changed currently, as it usually is at this stage of the recovery. The hourly wage growth rate on an averaged year-over-year basis is virtually unchanged at 2%. Looking at hourly wage data only on a month-to-month basis is just as misleading as it is for other data sets. Yes, the hourly wage number was down in December compared with November, but it was up a lot in November compared with October using the discredited month-to-month methodology. I think the year-over-year methodology shows that workers are not suddenly getting a raw deal and that hourly wage growth has been remarkably stable. However, adjusting for inflation, the real hourly wage growth data has shown considerable improvement over the past six months.

At 0.6%, we are not exactly lighting the world on fire, but the trend is up and not far off of the long-term inflation-adjusted average hourly wage growth rate of 0.7%. This should not be an impediment to long-term economic growth, as so many believe. From 1979 to mid-1993 real hourly wages (inflation-adjusted) went down. Yet that was a period viewed as part of the golden era of growth for the overall economy. A combination of more workers, lower tax rates, more borrowing, and increased exports helped to offset stagnant hourly wage growth during the 1980s. We believe that as baby boomers retire and labor in general becomes scarcer, hourly wage rates will accelerate to 1% or more, perhaps as early as calendar 2015.
Data not Strong Enough to Nudge the Fed to Early Action And while everyone is complaining about the low hourly wage growth rate, that relatively low growth rate may keep the Fed on the sidelines for some time. With inflation low and the world economy soft I don't think this week's employment data is strong enough to move the Fed to early action, say, in March. If economic activity backs off some in early 2015 new Fed actions on the interest rate front might not even happen in June, which is the general consensus for the timing of a rate hike. With at least some inflation, short-term rates eventually need to be higher than the 0%-0.25% that the Fed is targeting now. However, given slowing long-term demand for money and increased baby boomer savings, interest rates could remain surprisingly low for an extended period of time.
Employment Moved Sharply Higher in 2014 and Might Limit Growth in 2015 For all of 2014 about 3 million jobs were added, which amounts 246,000 jobs per month, well above the 194,000 average for 2013 and the 184,000 in 2012. That would seem to suggest that the large jump in GDP growth after the first quarter was likely more than a statistical mirage or a weather-related bounce. Still, I think we are moving higher in my 2.0%-2.5% growth range for 2014 and 2015 rather than opening up an entirely new range of, say, 3%-4% growth. Retail and construction, two key sectors, are looking at least a little sloppy in terms of business fundamentals. The slowing international scene, while never enough to dramatically cut growth rates or throw the United States into a recession, is least likely to provide a headwind instead of a tailwind in 2015. Too, I think the auto sector could help some, but I think the growth rates there will continue to erode. Yes, oil prices are lower, but oil-related activity and employment are going to offset at least some of the gains from greater consumer spending resulting from lower oil prices.
On the employment side, health care is likely to continue to be strong with more muted growth in manufacturing as a stronger dollar cuts into sales of manufactured goods. Also, the restaurant sector has been red-hot employment-wise (the business fundamentals are better, too) and that may not be sustainable over the longer term. Overall, I think the economy could average 260,000 jobs per month in 2015, up from 246,000 jobs in 2014. That would represent about a 2.2% annualized growth rate, consistent with 2.5% GDP growth.
December Still Strong, Light Trucks Drive 2014 Results (Written by Roland Czerniawski) Sales of light cars and trucks did relatively well in December, with 16.8 million units sold on a seasonally adjusted annual basis, according to the Bureau of Economic Analysis. This increase equals 8.8% year-over-year growth in December, making it the second-best year-over-year growth month after unusually high August figures. An improved job market, special holiday incentives, and low gasoline prices all contributed to the strong results in December.
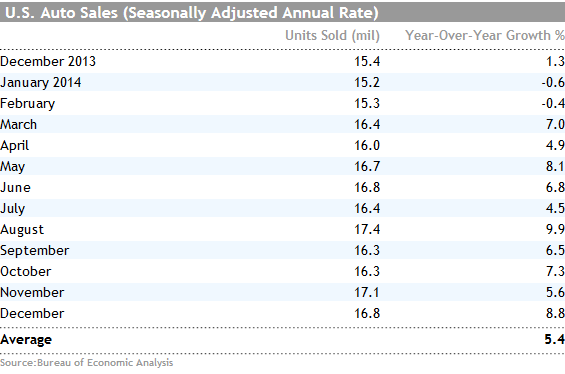
The annual figure for auto sales in 2014 came in at 16.4 million units, 8.8% higher than the year before, making 2014 the best year since 2006. Sales plummeted to as low as 9.0 million units amid the financial crisis. The recovery has been surprisingly robust, and in 2014 we finally saw auto sales rebound to their previous peak. The driver of the great 2014 results and of this recovery in general has been light trucks, which, with the exception of 2012, have been steadily posting double-digit annual growth since 2010.
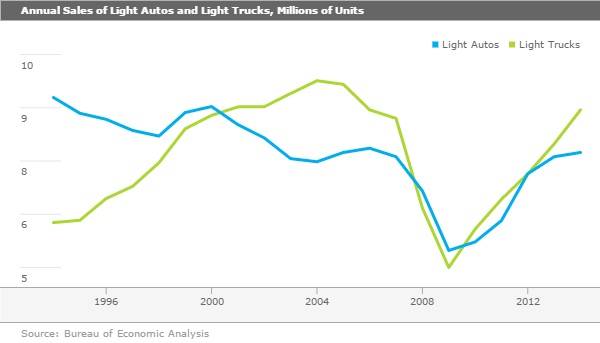
Dramatic product overhauls, better fuel efficiency, improving construction business, and more recently, lower gasoline prices, all contributed to this rapid growth in light trucks, which have grown 10.1% in 2014 compared with the prior year. Moreover, these strong truck sales are predominantly a success story for domestic automakers and thus for American workers. U.S. car manufacturers have a much larger mix of production dedicated to trucks in comparison with their foreign rivals, making them better suited to benefit from the surge in truck demand. The rise in truck sales can, however, turn into a mild pain in the future, as gasoline prices are expected to eventually rebound and consumers who purchased such vehicles may find themselves constrained with larger-than-expected gas bills.
Import-Export Data Remain Confusing Overall the U.S. trade deficit fell from $42.2 billion to $39 billion, a bigger-than-expected drop. Much of that drop related to fewer oil imports in barrels with an even bigger drop in prices. That large move in the current dollar deficit should help bolster the strength of the U.S. dollar. The inflation-adjusted trade balance for November was improved but nearly as much as the report in nominal dollars. In fact, the trade deficit for the first two months of the fourth quarter suggests that trade is likely to be a detractor from fourth-quarter growth. Instead of adding 0.4% to GDP, net trade could take off 0.2%-0.4% from the fourth quarter report, a sizable swing.
Throwing oil out of the equation, growth in imports continued to outpace exports as one might guess from the relatively stronger U.S. economy. A stronger economy here should be expected to mean good demand for foreign goods, especially at now lower prices. Although imports are growing close to 6%, the rate has slowed surprisingly recently, which is unusual given the acceleration in the U.S. economy and the popularity of the iPhone. Likewise it seems odd that exports, while lower than import growth, have actually improved since midyear even in the teeth of a world economy that is slumping.
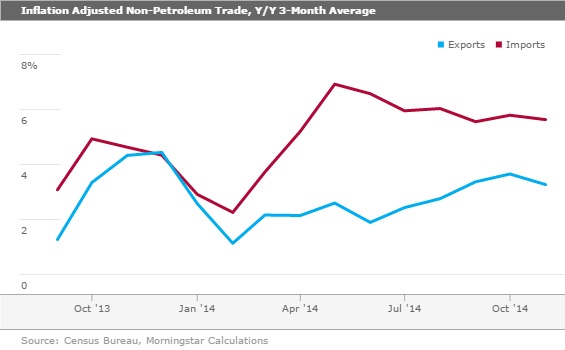
I suspect that export growth will remain lackluster as non-North American markets slow while import growth may creep up a little. I believe that labor issues at Western U.S. ports may be holding back imports and that should also reverse itself in 2015.
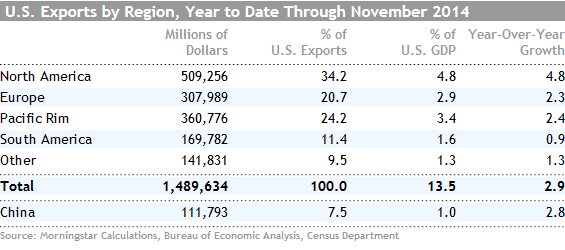
Export growth has perhaps held up better than expected because so many U.S. exports go to our North American trade partners, Mexico and Canada. Those economies are greatly influenced by activity in the United States. North America is our largest regional trade partner, accounting for more than a third of all U.S. exports of goods. Fortunately, that has been the fastest-growing market for the United States over the past year, too. So perhaps some of the worries about slowing world markets are a bit exaggerated.
Inflation, Retail Sales, Industrial Production, and Budget Data all due out Next Week Retail sales will be the most important report of the week as sales have been sharply accelerating in recent months. However, economists fear that December may be payback time after a fantastic fall selling season. With auto sales off just a little month to month and gasoline prices down sharply, economists are expecting the worst, with no retail sales growth at all for December following an unsustainable 0.7% growth rate in November (8.4% annualized). However, the retail sales results should look better when throwing out autos and gasoline sales. And eventually the more definitive monthly consumption report, due at month's end, will adjust this report for a considerable dose of deflation. Even with a bad December retail sales number, the full fourth quarter is likely to show consumption growth of 3.5% or more driving a slower but respectable GDP growth rate in the fourth quarter compared with the third. Strong consumption data will be offset by negative contributions from housing and trade.
Deflation on Tap Again for December Oil and gasoline prices drove a deflation rate of 0.3% in November. Gasoline prices fell even faster in December, likely meaning that total deflation could touch 0.4% in December. We will be watching closely to see if lower gasoline prices filter into other categories (that seemed to factor in the month-to-month wage data). Alternatively some analysts feel that consumers may spend the extra cash from gasoline savings recklessly in other categories, driving up non-energy related categories. I don't think the latter is a likely outcome. This past recession has permanently affected the consumer's mentality and has made them exceptionally price sensitive.
Industrial Production Will Be Soft, Led by Utilities and Oil Production A cold November caused a sharp increase in utility usage that drove industrial production up 1.1%. This month a slightly slower auto market and weaker exports combined with falling utility demand is likely to drive month-to-month industrial production down to no growth at all. The manufacturing-only sector should show a small gain, although likely well below the 1.1% growth rate experienced in November. I think the manufacturing sector is doing just fine, although it will be very difficult for this sector to sustain the large growth rates produced for 2014 in 2015. The key question is, will the recent strength in chemicals and plastics offset what is likely to be a slower year for growth in autos and airliners?
/cloudfront-us-east-1.images.arcpublishing.com/morningstar/6ZMXY4RCRNEADPDWYQVTTWALWM.jpg)
/cloudfront-us-east-1.images.arcpublishing.com/morningstar/URSWZ2VN4JCXXALUUYEFYMOBIE.png)
/cloudfront-us-east-1.images.arcpublishing.com/morningstar/CGEMAKSOGVCKBCSH32YM7X5FWI.png)