
Blowout U.S. Growth Rates Can't Hold
Slowing international markets, a still-slow housing market, moderating auto sales, and rising interest rates will all weigh on growth in 2015.

For a week without a lot of news or much trading, markets were surprisingly weak. Even the first trading day of the year was down, despite the normal bias from new fund flows in the New Year. Most of equity markets were down 1.6% to 3.0%. Emerging markets and the United States were better performers, while Europe and the rest of the world didn't do quite as well. With all the equity market weakness, bonds did better; the 10-year U.S. Treasury bond was down to 2.1%. Also reflecting economic weakness and falling oil prices worldwide, commodities were down almost 3%.
Economic data was neither particularly weak nor strong. Pending home sales were basically flat, contradicting last week's horrid existing-home sales report. "Still flat" isn't exactly a ringing endorsement of housing market strength. The U.S. manufacturing data remained relatively strong, though the rates of improvement seemed to be slipping. Weekly shopping center sales reports continued to look relatively soft, indicating that holiday sales may not have been as robust as hoped. Concerns also continued to mount over Greece, which appears to be approaching another bout of political uncertainty.
As long-term readers know, my GDP forecasts don't ever change by much from a core rate of 2.0%-2.5%. I have characterized the economy as a slow-moving ocean liner that has a very hard time changing either speed or direction. Sometimes my 2.0%-2.5% growth rate makes me look like a raging bull (like in 2010 or after last winter's slowdown), and other times like a dire pessimist (December 2013, when I said that the slower-growing auto and housing sectors combined with stringent controls on government spending would limit growth to far less than the 3% consensus rate). This year, I am again on the slow side of the consensus forecasts of 2.9% with my usual estimate of 2.0%-2.5% growth. Everyone is cheering falling gas prices and predicting this will finally cause the economy to jump to 3% GDP growth or even more. However, slowing international markets, a still-slow housing market, a less robust gain in auto sales, and rising interest rates will all weigh on activity in 2015.
Unfortunately, falling oil prices are no longer a one-way street to nirvana in the United States. Falling oil prices will hurt oil industry workers and states dependent on oil revenue. Texas has been one of the stronger economies in this recovery, and it feels like it is just about to get hit. Falling oil prices will also hurt companies producing goods that are used to drill for oil, potentially hurting the heretofore booming manufacturing sector.
Don't get me wrong. My outlook is still positive, and there are a lot of things going right for the economy, but it isn't a one-sided blowout for growth. The positives include an improving wage and employment outlook, the aforementioned $50 billion-$75 billion boost from falling gasoline prices, and a slightly better government spending situation. On top of that, inflation is likely to remain in check, and the U.S. budget deficit worries seem to be abating, at least if the politicians don't blow it.
Pending Home Sales Hold Their Own Last week's existing-home sales report was very worrisome, dropping from 5.25 million units to 4.93 million units, its lowest result since May. In fact, existing-home sales, which are seasonally adjusted, had been above 5 million units for five months in a row, so the November number was quite a setback.
Still, it's important to remember that existing-home sales have been on quite a yo-yo as the first hints of rising interest rates in 2013 caused a mini homebuying panic. Then very late in 2013 and 2014 existing-home sales were hit extremely hard as the panic conditions pulled ahead sales that would have normally been spread out over the next six months to a year. Bitterly cold weather and snowy/icy conditions further compounded the slump. In the second half of 2014, existing-home sales finally began returning to a normal trend line pattern. Then the poor November data on existing-home sales came out of nowhere.
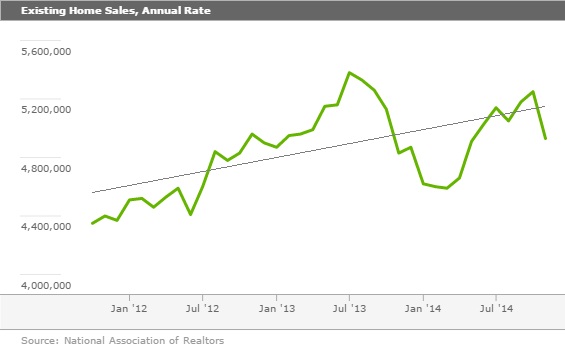
My worries about the November data were assuaged this week as the pending home sales data showed a small increase. In fact, the pending home sales index has been stuck between 104 and 106 since July, indicating a very steady and not deteriorating rate. Pending sales tend to predict existing-home sales two to three months in advance. The stable pending home sales rate seems to suggest that existing-home sales data, while disappointing, is merely statistical noise and not the start of a disastrous downturn.
Stable mortgage rates, improving economic conditions, and better labor markets, along with the pending home sales data, suggest that existing-home sales data should not have shown a dramatic drop in November. This indicates that we will either have a great December or that the November data will be revised upward. Either way, I wouldn't panic about the trajectory of the housing market, though things clearly aren't accelerating much, either. The annual, averaged data show very, very slow but steady improvement both in pending home sales and existing-home sales.
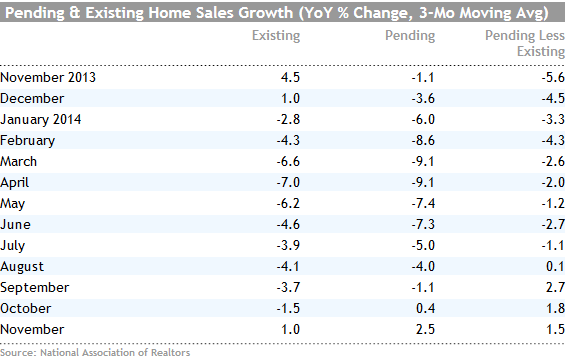
The gap between the growth rate in pending and existing-home sales suggests that existing-home sales should pick up, at least a little.
Poor Housing Data Will Weigh on Fourth-Quarter GDP Growth One unfortunate consequence of the soft existing-home sales data is that it will hit economic activity and the GDP calculation. The brokerage commissions on existing homes account for a quarter or more of the residential investment calculation (new homes and remodels account for the rest). Without a massive rebound in existing homes in December, it would appear that poor existing-home sales (and at lower prices to boot) will subtract at least 0.2% from the GDP calculation after providing a modest addition in the third quarter. This is another reason I suspect that the economic activity in the fourth quarter will drop sharply from the abnormally high 5% growth rate of the third quarter. Three percent growth in the fourth quarter is now looking like a bit of a stretch.
Housing Should Do OK but Not Great in 2015 Housing was one of the big disappointments of 2014 with essentially no growth in either existing-home sales and modest growth in housing starts compared with 2013. I had been warning since late 2013 that the best days of the relative improvement in housing might be behind us, but even I didn't imagine that existing-home sales would register a full-year-to-full-year decline and that housing starts would grow less than 10% (potentially missing the 1 million-unit benchmark that seemed like a cakewalk at the beginning of 2014). That also represents about half of the 18% growth rate in starts for 2013.
Six years into the economic recovery, the housing market has yet to get anywhere near the 1.5 million-unit starts that most economists consider a steady-state demand figure. That's good news and bad news. The slow recovery has obviously held back overall economic growth, but the good news is that there are still years of improvement in front of the U.S. housing market. That's true even if the 1.5 million long-run rate turns out to be overestimated because of shifting demographics and buyer preferences for rental units.
Speaking of overestimating, the consensus estimate for housing starts of 1.22 million units for 2015 seems too high to me. Growth of something closer to 1.1 million units, or about 10% growth seems more fitting with recent trends, and is still slightly higher than the 2014 growth rate of just under 10%.
U.S. Manufacturing Backs off Recent Strength The ISM Purchasing Mangers Survey, our preferred index for the manufacturing sector, showed a relatively large decline in December from 58.7 to 55.5. The 55.5 reading still indicates relatively high growth (any reading over 50 suggests that more firms are seeing growth than contraction). Nevertheless, it is a pretty large drop for a single month. The new orders index, which is probably the most predictive of the individual components of the composite index, fell very sharply from 66.0 to 57.3. Again, the level of the new orders index is still excellent, but shifts this big are still troubling.
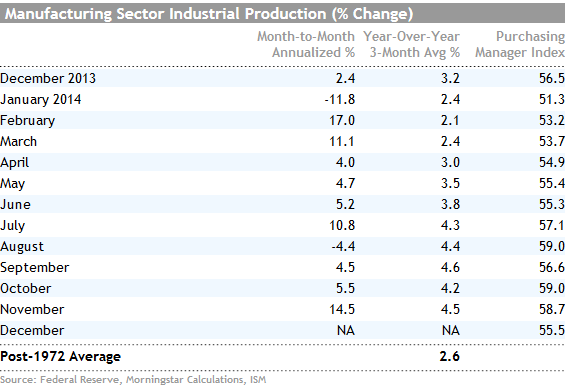
The strong ISM data this summer correctly predicted the strong increase in manufacturing data as indicated by the industrial production figures shown above. Given the weakness in December 2013 and early 2014 and the decent ISM numbers, the year-over-year growth rates in industrial production are likely to look very strong in December and the first quarter of 2015 before dipping back sharply in the second quarter. Overall industrial production in 2014 is likely to be in the 4% range, well ahead of the 2.6% long-term average.
Although 2015 is likely to remain above average, I doubt that manufacturing in 2015 will be nearly as strong as it was in fall 2014 when growth rates were pushing 5%. I believe that autos will not grow quite as fast as they did in 2014, which will hold back growth as will a relatively anemic housing and export market. On the bright side, chemicals and plastics are likely to do better in 2015 because of falling energy prices. Chemicals and plastics represent a surprisingly large 10% of U.S. manufacturing.
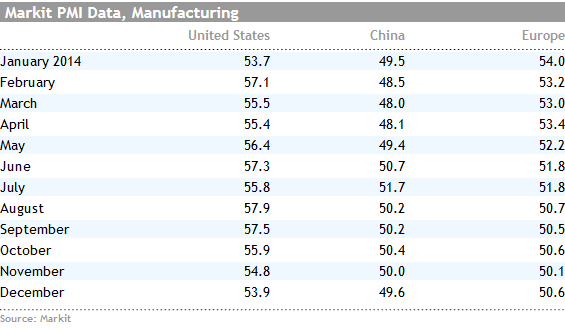
The final PMI data from competing data service Markit confirmed earlier flash readings that the Chinese and Europe regions remained relatively weak while the United States continued to dramatically outperform the rest of the world.
Consumption Growth Accelerates as the Savings Rate Declines
In last week's video, I talked about sharply rising consumption numbers this past fall. Not only did November consumption data look great, but also some previous months of data were revised upward. Consumption growth, even on an averaged basis, was all the way up to 2.7% for the three months ended in November. This compares with consumption growth of more like 2% for most of this recovery. All the way back in June, we had been anticipating a sharply improved consumption outlook based on a savings rate that made one of its sharpest increases in history. We puzzled for months about why the consumer was flat-out refusing to spend all of their income gains as they had done in the past. We surmised it was just a matter of time until consumption was likely to increase. And now it has, as shown below in the right most column.
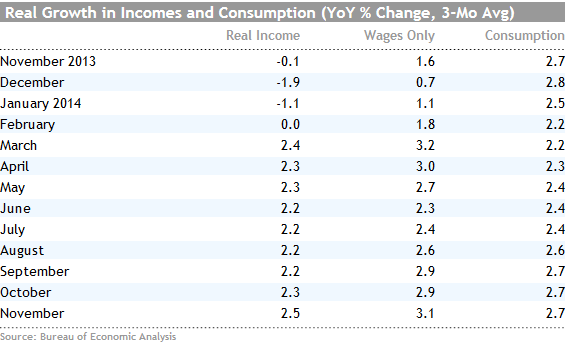
However, the news is not entirely good. Recent income data for the summer has been revised downward, and consumption has moved sharply higher. This in turn has brought the savings rate down to a more normal level. By the way, these are some of the biggest revisions to data that we have seen in some time. July's originally reported 5.5% saving rate has now been reduced to just over 5%, and the rate has fallen sharply over the past several months.
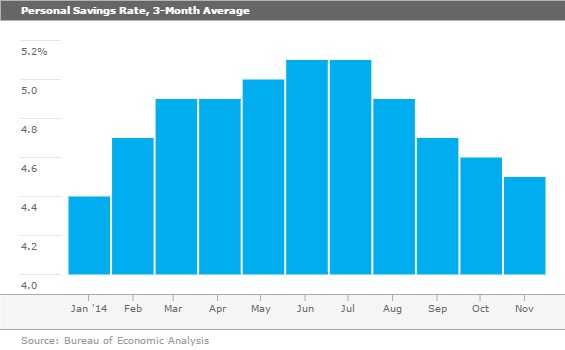
This means a lot of the consumer rocket fuel that I have been dutifully reporting has now been used. The savings rating can probably fall a little more, but after that, spending gains will have to come from employment growth and wage gains. That may make consumption gains a little harder in early 2015 even if wages and employment continue to improve. This is part of the reason I am bullish on 2015 but not nearly as bullish as many other economists who are projecting GDP growth of 3% or more.
Weekly Shopping Center Sales Indicate That Conventional Consumer Spending Is Slowing As many readers remember, weekly shopping center data was one of my favorite economic metrics. It did correctly predict improving retail sales this fall.
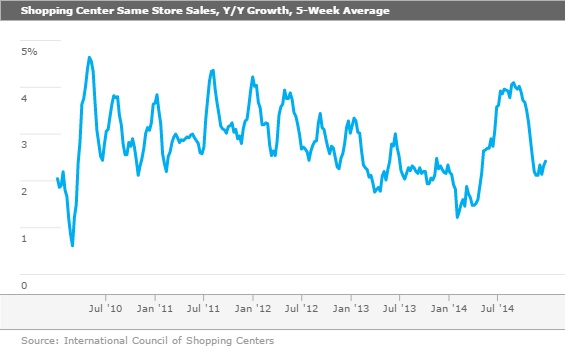
However, I worried that with more sales going online and more growth coming out of the restaurant sector, mall sales weren't necessarily a perfect indicator anymore. Still, the fallback in shopping center sales over the past few weeks is a bit worrisome and reinforces my concerns about a stabilizing savings rate (that is no longer falling).
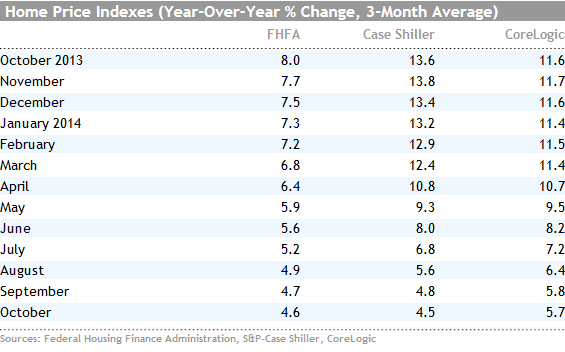
Home Price Growth Continues to Edge Lower (Written by Roland Czerniawski) Case-Shiller's home price index was up 0.8% in October, while the Federal Housing Finance Agency's HPI increased 0.6% during the same month. Despite those hefty monthly increases, the year-over-year three-month average growth rates for both Case-Shiller and FHFA indexes ticked down to 4.5% and 4.6%, respectively. We expect the year-over-year growth rates to moderate further as we begin to hit some of the months that were particularly hot last year.
Overall, slower-growing home prices are helpful to the general health of the housing recovery, as rapidly rising prices late last year proved to be detrimental to housing affordability. Our 2015 forecast for home price growth is 4%–5%, a range that is very much in line with historical averages. Prices have already begun falling within that range, and we believe that now we are closer to a more natural and sustainable rate than we've seen in a while. As mentioned on numerous occasions, a slow housing recovery was one of the most disappointing stories of 2014. While we don't expect a housing boom anytime soon, healthier price growth will have a net positive impact on the housing sector in 2015.
Autos, Trade, and Employment on Tap Next Week Luckily the normal deluge of the typical first week of the month has been spread out over two weeks this year, lessening the normal load of economic data next week. Autos are always a key marker of consumer confidence, and next week's report remains important. However, I caution more year-end sales promotions have tended to make December data stronger than it really is, with subsequent slowness in the early going of a new year. The consensus is for sales of 16.9 million units in December, off just slightly November's pace of 17.0 million units. That would bring the full-year total to 16.4 million units, well ahead of the 15.6 million units sold in all of 2013. It will be interesting to see if falling gasoline prices help unit volumes or merely shift units to pickup trucks and SUVs.
The trade deficit is expected to shrink from $43.4 billion in October to $41.0 billion in November on the back of lower oil prices. More important will be the inflation-adjusted deficit, which is the metric actually used in the GDP calculation. Still, I don't think the improvement will be enough to keep net exports from being a relatively large detractor from the GDP calculation in the fourth quarter and potentially all of 2015. A much stronger dollar and the relative strength of the U.S. economy will make any improvement in the inflation-adjusted deficit a real struggle.
The employment report always gets a little more attention than it deserves, and the report for December will be no exception. The level of controversy is unusually high this time around. One camp (including me) believes that the 321,000 growth rate for November was a fluke due to changing seasonal factors and is likely to be unsustainable. The other camp believes that the U.S. economy is off to the races, and monthly employment growth should remain near 300,000, which suggests an employment growth rate of 2.6% and a GDP growth rate of 3%. The overall consensus is for slower growth of just 220,000 jobs added in December. Also keep in mind that December can be quite strange because of weather and seasonal factors. Even after revisions, December's employment growth rate was a shockingly low 84,000 jobs for December 2013, one of the very worst performances of the year.
/cloudfront-us-east-1.images.arcpublishing.com/morningstar/6ZMXY4RCRNEADPDWYQVTTWALWM.jpg)
/cloudfront-us-east-1.images.arcpublishing.com/morningstar/URSWZ2VN4JCXXALUUYEFYMOBIE.png)
/cloudfront-us-east-1.images.arcpublishing.com/morningstar/CGEMAKSOGVCKBCSH32YM7X5FWI.png)