
How Closely Do Index Funds Track Their Benchmarks?
Sometimes very tightly, sometimes not.
/s3.amazonaws.com/arc-authors/morningstar/1aafbfcc-e9cb-40cc-afaa-43cada43a932.jpg)

3 Questions
Today’s column addresses three questions. First, to what extent do the portfolios of index funds behave differently from benchmarks that they emulate? That is, before expenses are considered, how accurately do those funds mimic their underlying indexes?
Second, do those tracking errors have a pattern? Does the pre-expense performance of index funds trail, match, or lag their benchmarks?
Third, how do the outcomes look after expenses? This may seem a trivial query, given that the top S&P 500 index funds are so cheap as to be virtually free (not even “virtually” for Fidelity ZERO Large Cap Index FNILX), but expense ratios are steeper for funds that mimic less popular benchmarks. With such funds, the tracking errors caused by their costs may outweigh those arising from their portfolios.
The study group consists of the five largest index funds (both mutual funds and exchange-traded funds, oldest share class only) with 10-year records, for seven benchmarks:
1) S&P 500
2) MSCI EAFE
3) MSCI Emerging Markets
4) Russell 2000
5) S&P MidCap 400
6) S&P SmallCap 600
7) Bloomberg U.S. Aggregate Bond
These are but a handful of the hundreds of benchmarks that index funds mimic. However, as most of those benchmarks support only one or two funds, it would be difficult to generalize about their results. Five funds (four with MSCI Emerging Markets, which is indexed by few funds with 10-year records) is admittedly not a large sample size, but that amount does permit some tentative conclusions.
How Much?
On to the first item: to what extent index funds veer from their yardsticks. Because I selected only the biggest funds within each group, this answer applies solely to the index funds offered by the leading organizations. Funds from smaller providers will likely deviate further, both because they may lack the assets to invest cost-effectively across the entire benchmark and because they usually carry higher expense ratios.
I computed the average annual tracking error on the gross returns for each benchmark’s funds by adding each year’s expense ratio to the fund’s total returns. This shows how the portfolio itself performed, absent its ongoing costs. I then compared those totals to the benchmark’s return, noting the absolute differences. Here is a sample calculation for calendar-year 2020:
Fidelity 500 Index Fund FXAIX 18.40% +
Expense Ratio 0.02% =
Gross Return 18.42% -
S&P 500 Return 18.42% =
Tracking Error 0%
Spot on! Summing the fund’s return and its expense ratio exactly matched the index’s performance. There was no tracking error whatsoever.
Averaging the absolute differences for each benchmark group, for the 10 years from 2012 through 2021 (as not all funds have yet reported their 2022 expense ratios, I ended the study in 2021), yielded the following results:
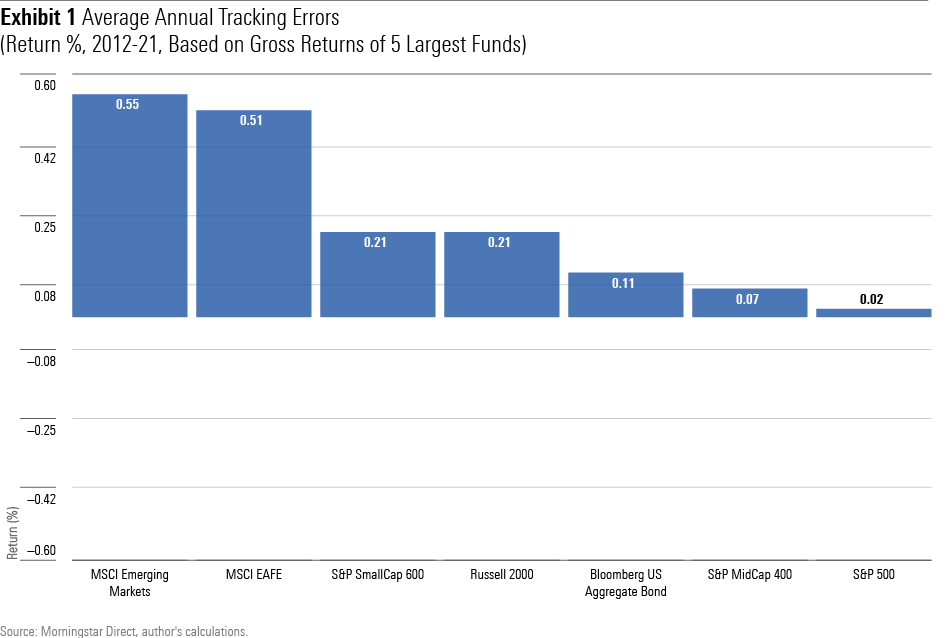
The outcomes vary greatly by index. The average annual tracking error for the five S&P 500 funds was a puny 2 basis points. Close behind were S&P’s MidCap 400 Index and Bloomberg U.S. Aggregate Bond. Conversely, index funds investing in the two foreign-stock benchmarks had far and away the highest tracking errors.
Summary: With large index funds that use familiar U.S.-based benchmarks, tracking error is only a modest concern. However, index funds that invest in overseas securities can deviate substantially from their benchmarks.
Which Way? (Before Expenses)
The previous chart showed absolute differences. Any discrepancy between the benchmark and the funds’ gross returns received a positive score, with the aim being (as with golf, hearts, and cross-country races) to post the lowest possible mark. The next chart operates more conventionally. It is calculated in the same fashion, but this time the raw tracking errors are summed, not the absolute returns. Higher results are therefore more desirable.
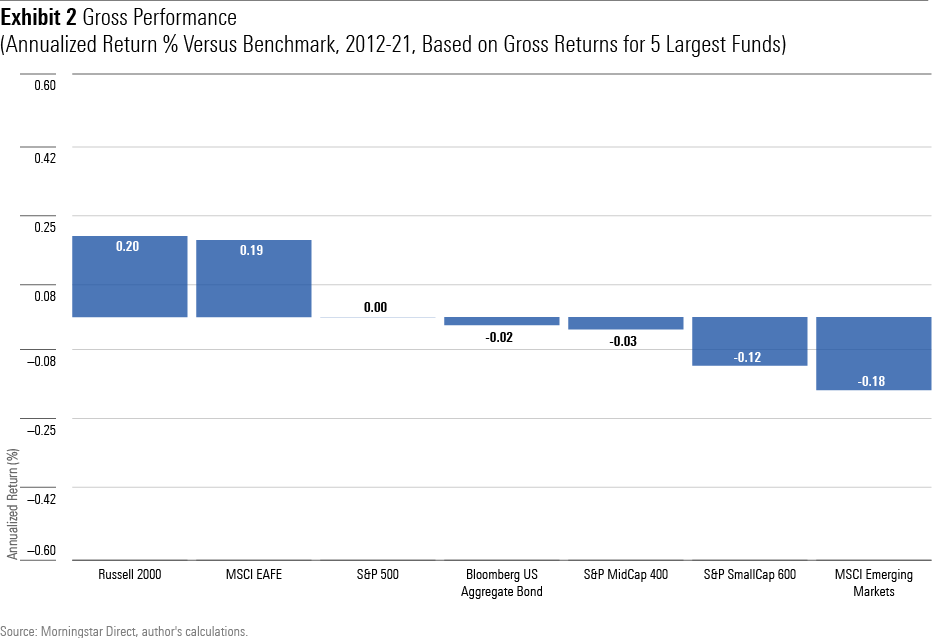
Hmmm. In two cases, gross returns for the index funds outdid their benchmarks; three times they drew; and in the final two instances, the benchmarks triumphed. Some of that makes sense. The three draws occurred because those index funds recorded such low tracking errors that there was little wiggle room. And the MSCI EAFE index funds triumphed—all five outgained their benchmarks—because of a technicality. Funds can recoup some of the withholding taxes that are levied on foreign equities, while the benchmark does not incorporate such payments.
The other three cases are puzzling, though. I cannot explain why Russell 2000 Index funds routinely beat their benchmark—again, all five funds did so—while S&P Small Cap 600 and MSCI Emerging Markets index funds do not.
Summary: Not only does the amount of tracking error vary by index but also the direction of those errors.
Which Way? (After Expenses)
Of course, shareholders spend actual rather than theoretical profits. This column’s final view, therefore, is how the collective tracking errors appear after funds pay their expenses. The calculation is identical to that of the previous chart, except this time the index funds are not credited with their expenses. Consequently, the outcomes reflect true shareholder experiences, with positive figures indicating that the funds’ investors took home more money than would have been provided by the benchmark, and a negative result the opposite.
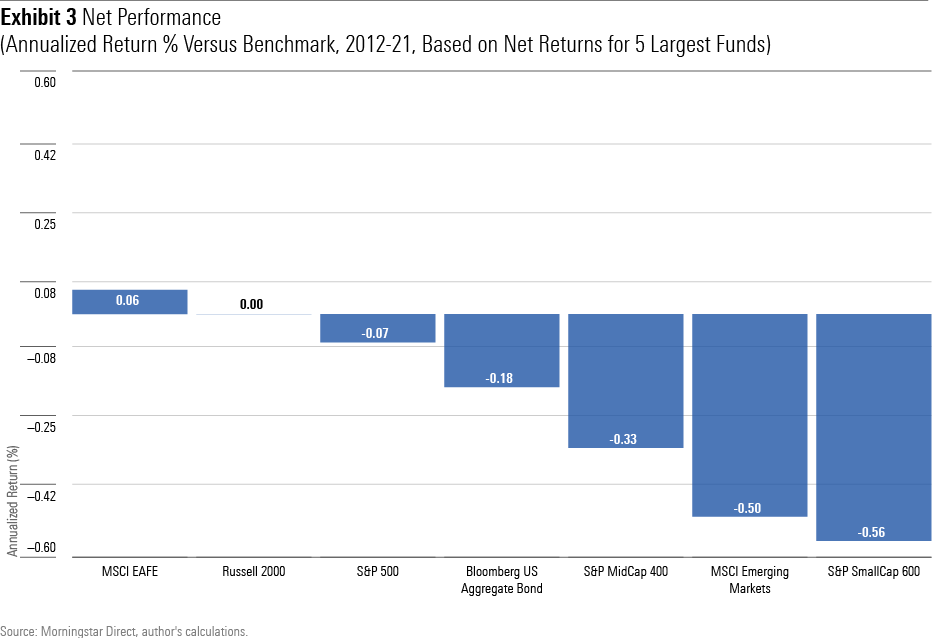
The MSCI EAFE funds retained their advantage over the benchmark, even after costs, and the Russell 2000 funds broke even. Index-fund investors cannot reasonably expect better than that! Unfortunately, the average annual deficit for the index funds exceeds one third of a percentage with three of the benchmarks. Those are meaningful bites.
Summary: After tracking errors and expenses, index funds that invest in difficult-to-replicate benchmarks may lose a significant chunk of their head start over actively managed funds. (They will likely, however, be more tax-efficient for those holding assets in taxable accounts.)
The opinions expressed here are the author’s. Morningstar values diversity of thought and publishes a broad range of viewpoints.
The author or authors do not own shares in any securities mentioned in this article. Find out about Morningstar’s editorial policies.
/d10o6nnig0wrdw.cloudfront.net/04-25-2024/t_d30270f760794625a1e74b94c0d352af_name_file_960x540_1600_v4_.jpg)
/cloudfront-us-east-1.images.arcpublishing.com/morningstar/DOXM5RLEKJHX5B6OIEWSUMX6X4.png)
/cloudfront-us-east-1.images.arcpublishing.com/morningstar/ZKOY2ZAHLJVJJMCLXHIVFME56M.jpg)
:quality(80)/s3.amazonaws.com/arc-authors/morningstar/1aafbfcc-e9cb-40cc-afaa-43cada43a932.jpg)