
With Retirement-Spending Plans, the Odds Are Stacked in the Investor’s Favor
Today’s investment forecasts have a conservative slant.
/s3.amazonaws.com/arc-authors/morningstar/1aafbfcc-e9cb-40cc-afaa-43cada43a932.jpg)

Monte Carlo Simulations
Once upon a time, people created investment plans that had definite answers. If workers maintained their savings rate until age 65, they could expect to own a given amount of money. For retirees, spending plans were specified in advance.
Of course, things were never quite that simple. In the back of their minds, investors realized that the plans that were presented to them were guesswork. Good financial planners reinforced that understanding by explaining how the forecasts might be wrong. Nevertheless, the prevailing method implied certainty. Investment plans conveyed that which was expected to happen.
During the 1990s, investment planning began to change. Personal computers became powerful, permitting their users to create Monte Carlo simulations. Rather than provide a single solution, planning software showed a range of possibilities. (The industry’s transformation was accelerated by a 1997 critique from Nobel laureate William Sharpe, “Financial Planning in Fantasyland.”)
These Monte Carlo calculations profoundly altered the practice. Once the dots became bell curves, what had once been implicit now became explicit: By construction, half the plans would fail. Traditional forecasts presented the median result. That tactic was accepted when bad outcomes were merely discussed. But when they appeared on-screen, as the left half of a bell curve, the approach lost favor. Who in good conscience could advocate a plan with a 50% success rate?
This is an observation, not a complaint. It is better to err on the side of caution than the reverse—particularly when planning for retirees, who cannot take a second bite of the income apple. For that reason, my co-authors and I accepted the conventional wisdom when preparing our paper, “The State of Retirement Income: 2022,” which estimates the rate at which retirees may safely withdraw assets from their investment portfolios. We chose a success rate of 90%.
Higher Spending Rates?
Our recommended withdrawal rate, assuming a portfolio that consists of 50% equities and 50% fixed-income securities, and a 30-year time horizon, is a real 3.8%. (By “real 3.8%,” I mean that the withdrawal amount is adjusted each year for the effect of inflation, as with Social Security payments.) In some aspects, that suggestion is aggressive. For example, my friend Allan Roth points out that our research assumes that retirees will hold index funds—a generous premise. One could also question whether the paper’s stock market outlook is unduly high.
However, such warnings should be accompanied by the caveat that the forecast already tilts heavily in the opposite direction, by requiring a 90% success rate for the 1,000 simulations that it generates. Consequently (according to the conditions of the forecast’s assumptions), retirees who select that 3.8% real withdrawal rate will likely leave money on the table. They could have spent more during their lifetimes but denied themselves by—as it turned out—being too cautious.
The chart that follows depicts alternative spending plans that investors could adopt. The blue line portrays the same base case, with each year’s expenditures remaining unchanged in real terms, but with different success rates. The far left of the line shows the withdrawal-rate recommendation for a 50% success rate, while the far right plots the suggestion for a 100% success rate.
The chart’s red line operates similarly but applies an “inflation haircut” by increasing the retiree’s annual spending not at the full rate of inflation, but instead at that rate minus 1 percentage point. Thus, if inflation were to increase 3% during a calendar year, in the next year the retiree would spend the previous amount, bumped by 2%. This approximates actual retiree behavior, aside from healthcare spending (which could be addressed via long-term care insurance).
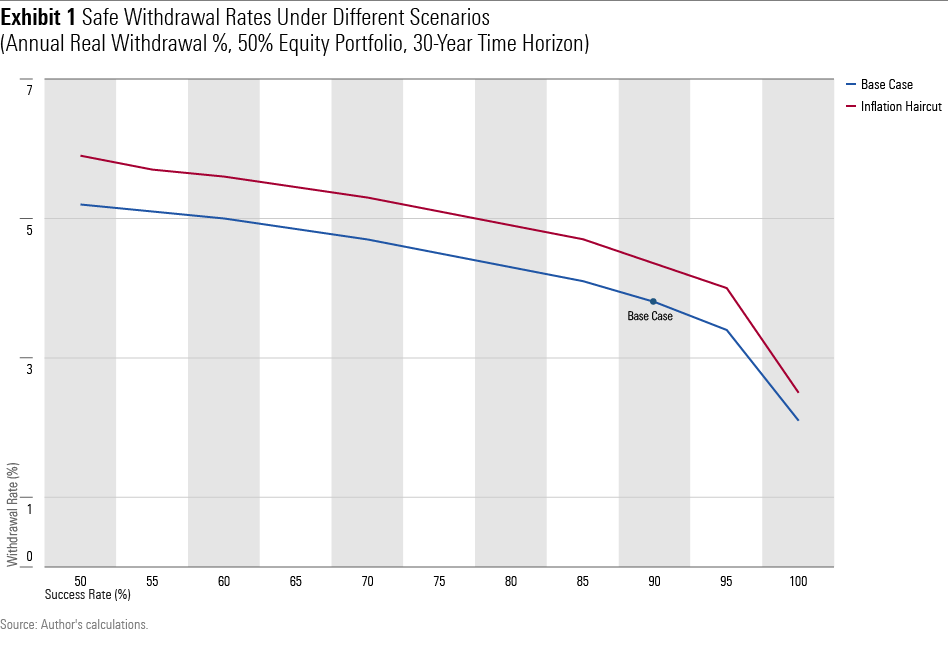
From this perspective, the paper’s 3.8% suggestion looks conservative. Even by matching the increase in inflation, through the base case, retirees could spend from 4.5% to 5.0% while maintaining a reasonably high success rate—lower than 90%, but above the 50% success rate of traditional investment plans. Accepting an inflation haircut boosts those totals by another 0.6 percentage points.
Ending Values
Another way of viewing the retiree’s margin of safety is to consider the median portfolio values when the simulations cease, 30 years after the start date. For the most part, those dollars represent excess cash, because by that time the retiree will no longer be around to spend them. (I just looked it up; although I am not yet retired, the joint life expectancy for my wife and me is less than 30 years.)
And those amounts can be substantial. The chart below shows the median expected portfolio values after 30 years with a $1 million initial investment for the base case (the figures for the inflation-haircut tactic are larger yet), given the withdrawal rates associated with each success rate. For example, using the 3.8% withdrawal rate that creates a 90% success rate generates a median nominal portfolio value of $1.8 million, which translates to a real $0.8 million, after adjusting for future inflation.
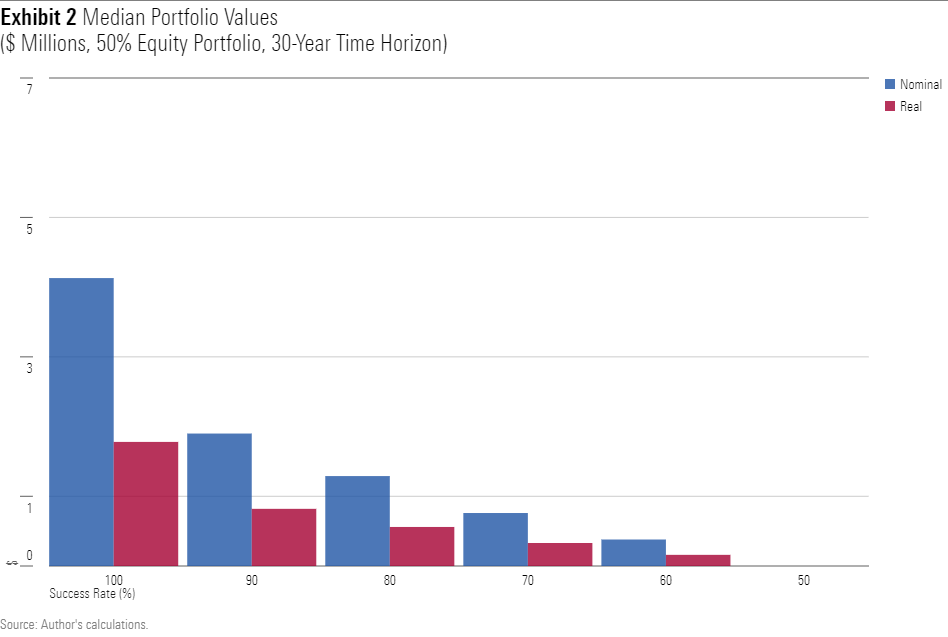
That is a great deal of money! Also, remember that half the simulations generate a larger amount yet. (The most lucrative simulation, using the admittedly paltry 2.1% withdrawal rate that is required to achieve 100% success, leads to a final portfolio value of $38.8 million. The retiree’s heirs will definitely thank her.) While one cannot know what the future will bring, if our study’s assumptions are roughly correct, the recommended 3.8% rate is more of a floor than a ceiling.
Summary
In “Why 50% Probability of Success Is Actually a Viable Monte Carlo Retirement Projection“ (not the slickest of headlines, but admirably descriptive), financial planner Derek Tharp suggested that the industry consider creating investment plans that embed a lower underlying success rate. Doing so would require a change in how planners communicate with their clients, he admits, but the outcome might be worth the effort. Wrote Tharp, “Simply put, if we say there is a 50% chance of failure it sounds catastrophic; if we say there is a 50% chance of adjustment, it doesn’t sound so bad.”
I fully agree.
This article was originally published on Jan. 13, 2023. The views expressed here are the author’s.
The opinions expressed here are the author’s. Morningstar values diversity of thought and publishes a broad range of viewpoints.
The author or authors do not own shares in any securities mentioned in this article. Find out about Morningstar’s editorial policies.
/cloudfront-us-east-1.images.arcpublishing.com/morningstar/IFAOVZCBUJCJHLXW37DPSNOCHM.png)
/cloudfront-us-east-1.images.arcpublishing.com/morningstar/JNGGL2QVKFA43PRVR44O6RYGEM.png)
/cloudfront-us-east-1.images.arcpublishing.com/morningstar/GQNJPRNPINBIJGIQBSKECS3VNQ.jpg)
:quality(80)/s3.amazonaws.com/arc-authors/morningstar/1aafbfcc-e9cb-40cc-afaa-43cada43a932.jpg)