
How Rich Was Babe Ruth?
The lesson learned by translating yesterday's dollars.
/s3.amazonaws.com/arc-authors/morningstar/1aafbfcc-e9cb-40cc-afaa-43cada43a932.jpg)

Living Large
The Babe went big. He notched 54 home runs in a season before anybody else hit 30, ordered two steaks at a time, and chased women incessantly. His paychecks were correspondingly hefty. In 1921, Ty Cobb was the best-paid player in baseball history, receiving $25,000. The next year, Babe Ruth took home $52,000.
Ruth's highest salary came in 1930 and 1931, at $80,000. (Allegedly, he deflected criticism that he made more than President Hoover by replying "I had a better year," but that may be just a sportswriter's invention.) With the unemployment rate exceeding 20% and industrial workers who retained their jobs earning $950, that figure enthralled the public. Babe Ruth was almost inconceivably wealthy.
Still, let's try to conceive. The customary way of translating Ruth's salary is to adjust by the Consumer Price Index, which gives an estimate of $1.37 million. Hmmm. That's not overly impressive. True, that would buy a lot of hot dogs, but it's far from astonishing. For example, every New York Knick save for Norvel Pelle earned a higher amount this past season. (As Mr. Pelle played only 52 minutes on the year, his hourly compensation was satisfactory.)
Goods & Services
There exist better evaluations of purchasing power than drab CPI computations. What could Ruth have bought with his salary? How much of today’s money would be required to fill the same shopping lists?
The initial answer, gathered from examining the costs of consumer goods, is underwhelming. Although prices have certainly increased, they haven't grown enough to make the Babe's salary seem extraordinary. For example, in 1931, a can of Campbell's Tomato Soup cost 6 cents, gasoline was 17 cents per gallon, and a new Chevrolet ran about $600. The Babe's $80,000 could have thus acquired 1.3 million soup cans, 470,000 gallons of gas, or 130 new Chevys.
As Campbell’s Tomato Soup is $1 per can today, a gallon of regular gas $3.20, and a Chevy Malibu $25,000, replicating the Babe’s purchases would require, respectively, $1.3 million, $1.5 million, and $3.3 million. The first two items match the rise in the CPI. The third grew faster than the index, but not by enough to make Ruth’s adjusted salary breathtaking. (Also, given the huge improvement in automobile quality over the past 90 years, the comparison is imperfect.)
By and large, the growth in the price of services has outstripped that of goods. The cost of a men's haircut or lunch at a diner has increased about 40-fold over the years. The bills for specialized services have multiplied even more rapidly. Harvard's tuition was $400 during the 1930s, while hospitals charged $100 for delivering a child. By those standards, Ruth's salary begins to look imposing.
(At this point, you may be wondering why every item seems to have matched or beaten the CPI's rate of increase. The answer is twofold. First, some costs have in fact become lower, such as those of eggs, refrigerators, and long-distance travel. Second, the CPI's "market basket" changes over time, generally picking up more of items that become cheaper. Consequently, CPI growth tends to lag the growth in its constituent parts.)
Considering Investments
But it's investment assets that put the shine on the Babe's income. Gold was $17.06 per ounce in 1931, as opposed to $1,810 today. Silver cost 33 cents per ounce; it commands $25 today. As measured by those metals, Ruth's $80,000 transmogrifies to between $6 and $9 million in 2021 currency--that's still less than several members of the New York Knicks, but nonetheless a handsome amount.
Far better yet have been equities. In 1931, the United States' gross domestic product was $77 billion. As the U.S. stock market was valued at about 50% of GDP, its total capitalization was roughly $40 billion. Babe Ruth's $80,000 salary could therefore have secured 2 one-millionths of all publicly listed U.S. stocks. That may not sound like much, but it's a tidy sum. Attempt to corner that much of U.S. equity marketplace today, and you'd be out $92 million.
The chart below summarizes the findings. The picture illustrates two points: 1) the difficulty of condensing 90 years’ worth of price changes into a single statistic and 2) the sensational showing of U.S. stocks.
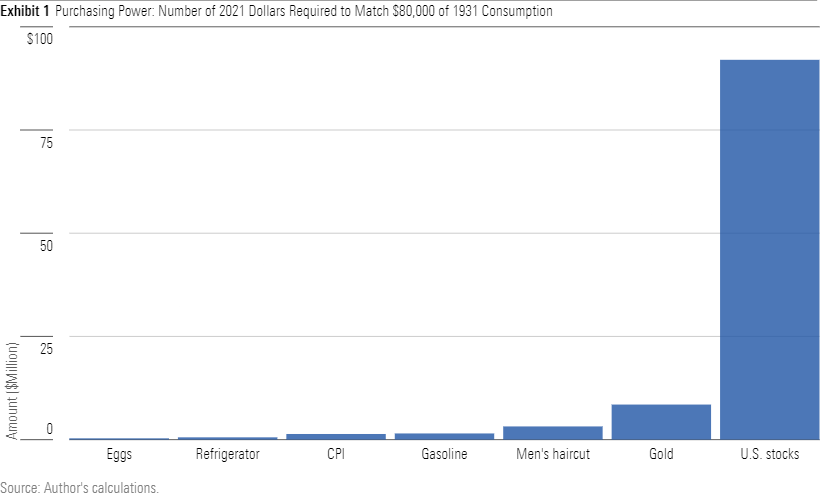
It may be protested that this measure overstates equities’ performance, because publicly traded stocks currently account for a higher percentage of American business activity than they did during the Great Depression. That claim may be correct--or not, as I cannot find evidence either way--but it is immaterial. For equity investors, the truth surpasses what I have presented, because the Babe Ruth test omits dividends. The total return on equities has been much higher yet.
Opportunity’s Knock
This analysis, of course, misses the initial point. Contemporary observers didn't marvel at Babe Ruth's salary while contemplating about how many stocks that they could buy. (Well, at least normal people didn't.) Their fantasies involved steak dinners and long, cool rides. From that perspective, the Babe didn't earn all that much money. He was flush compared with his era's elite athletes, and even more so with workers suffering through a Great Depression. However, when judged by the ability to buy ordinary things, his salary doesn't astonish.
Never mind what the people thought. What is remarkable in hindsight is how investment prices appreciated so much more aggressively than did the costs of consumer goods and services. As a result, many everyday Americans who have invested diligently--or who perhaps had parents who did so--have found themselves sharing at least some of Ruth’s purchasing power, without having hit any home runs along the way.
John Rekenthaler (john.rekenthaler@morningstar.com) has been researching the fund industry since 1988. He is now a columnist for Morningstar.com and a member of Morningstar's investment research department. John is quick to point out that while Morningstar typically agrees with the views of the Rekenthaler Report, his views are his own.
The opinions expressed here are the author’s. Morningstar values diversity of thought and publishes a broad range of viewpoints.
/cloudfront-us-east-1.images.arcpublishing.com/morningstar/G3DCA6SF2FAR5PKHPEXOIB6CWQ.jpg)
/cloudfront-us-east-1.images.arcpublishing.com/morningstar/VUWQI723Q5E43P5QRTRHGLJ7TI.png)
/cloudfront-us-east-1.images.arcpublishing.com/morningstar/XLSY65MOPVF3FIKU6E2FHF4GXE.png)
:quality(80)/s3.amazonaws.com/arc-authors/morningstar/1aafbfcc-e9cb-40cc-afaa-43cada43a932.jpg)