
The Problem With Optimizers
Backward-looking data can lead to distorted results.
/s3.amazonaws.com/arc-authors/morningstar/360a595b-3706-41f3-862d-b9d4d069160e.jpg)
Portfolio optimizers--which have been widely available to individual investors and financial advisors for about 30 years--have an understandable appeal. By simply plugging in a few numbers for risk, returns, and correlation coefficients, users can quickly crunch the numbers and get a recommended asset allocation. The portfolio mix should end up on the efficient frontier, which is the mix of assets that either maximizes expected returns for a given level of risk, or minimizes risk for a given level of returns.
But the problem is a simple one: The results depend heavily on which assumptions are entered (a/k/a garbage in, garbage out). Because past is rarely prologue, the results you get vary widely depending on the periods used to calculate longer-term averages. In this article, I’ll go through three examples to illustrate why the “optimal” portfolio can vary dramatically depending on the assumptions. I’ll also give some tips for avoiding common optimizer pitfalls.
Case 1: Bonds Are King To illustrate how optimizers work, I set up a couple of test runs on Portfolio Visualizer, a website that includes several useful portfolio-related tools. For the first one, I looked at the period from 1994 through 2003. I limited potential portfolio holdings to a handful of widely used asset classes, including stocks, bonds, REITs, and gold. For an investor targeting an 8% annual return, the program recommends the following asset mix: Exhibit 1: Case 1: 1994-2003
- source: Portfolio Visualizer.
A couple of things stand out in this portfolio. First, it leans heavily toward bonds, which make up more than two thirds of the portfolio. Bonds had unusually high returns of 6.7% per year over the 10-year period and also conferred major risk-reduction benefits thanks to their low correlation with stocks. As a result, investors could load up on bonds and still meet the 8% return target. The equity allocation is relatively small, with only 14% of assets split between U.S. large-cap and small-cap stocks. International stocks get only a scant weighting of 0.9% of assets. Instead, the optimizer recommends a 13.6% stake in real estate, which generated attractive risk-adjusted returns during the 10-year period. Gold, on the other hand, gets a light weighting of just 1.6% of assets thanks to its relatively flat returns.
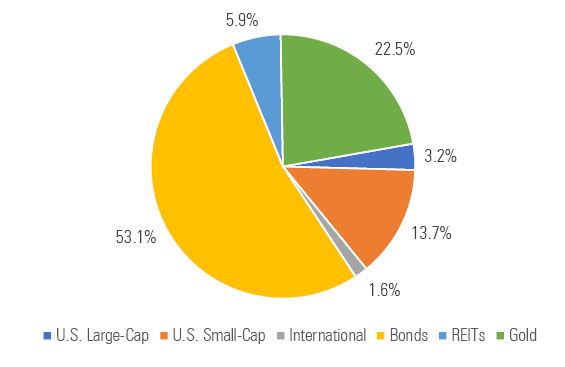
Case 2: More Small-Caps and Gold But shifting the time period to the following 10 years (2004 through 2013) leads to very different results, as shown below: Exhibit 2: Case 2: 2004-2013
- source: Portfolio Visualizer.
In contrast to the previous portfolio, the bond allocation shifts to 53.1% of assets. The U.S equity weighting leans heavily toward small-cap stocks, which make up 13.7% of assets, compared with just 3.2% for large-cap stocks. That reflects a strong run for smaller-cap stocks toward both the beginning and end of the 10-year period. Similarly, the optimizer recommends socking about 22.5% of assets in gold, which enjoyed an upward climb during most of the 10-year period. REITs’ performance edge dulled a bit, so the allocation shifts down to 5.9%.
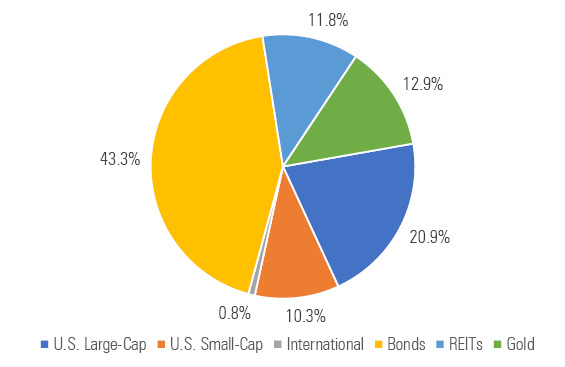
Case 3: The Long-Term View The two cases above illustrate the outsize impact of return assumption on "optimal" portfolios. To avoid these pitfalls, it makes sense to rely on returns over much longer time periods. The Portfolio Visualizer tool only includes data going back to 1994 for the asset classes I chose, but I used the longest available data from 1994 through 2020, with the results below:
Exhibit 3: Case 3: 1994-2020
- source: Portfolio Visualizer.
This comes closer to a normal-looking portfolio, but still has some outsize weightings, with gold and real estate consuming close to one fourth of combined assets. Both assets had relatively low correlations with the other major assets, so adding them to a portfolio would have improved risk-adjusted returns. International stocks, which lagged the U.S. market by more than 5 percentage points per year over the full period, still make up only a sliver of assets. The domestic equity wedge leans toward large-cap stocks, but includes a 10.3% stake in small-cap issues. Smaller stocks were subject to more volatility, but also slightly outperformed large-cap names over the full period. Bonds make up a smaller weighting than in the two previous examples, but still account for more than 40% of assets.
Avoiding the Pitfalls Despite their limitations, optimizers can still be a useful tool. But investors can avoid some of the pitfalls by using some common-sense guidelines.
Beware the rear-view mirror. When it comes to historical data, I like to go back as far in time as possible. But as Case 3 illustrates, even multi-decade periods can have unusual performance patterns that skew the results. In particular, the past 40 years have been exceptionally strong for bonds. Because of the secular decline in interest rates, bonds enjoyed the best risk-adjusted returns of any major asset classes. That makes adding more bonds look like a no-brainer, but fixed-income securities probably won't play quite as heroic a role going forward, especially if interest rates start trending back up.
On the flip side, international stocks fared unusually poorly over the period from 1994 through 2020. Not only did returns lag those of U.S. stocks by a wide margin, but volatility was higher. And because international stocks often moved in the same direction as domestic markets (with a correlation coefficient of about 0.83 versus U.S. large-cap stocks), they didn’t provide meaningful diversification benefits when added to a portfolio. But there’s no reason to believe that international stocks will continue to lag indefinitely. Foreign stocks could fare better if non-U.S. countries bounce back more quickly from the coronavirus-driven recession, or if the U.S. dollar continues its recent downward trend.
Give yourself some limits. As the examples above show, using unconstrained allocations can lead to some wacky--and potentially risky--results. To avoid this problem, it's reasonable to implement some common-sense limits on the output. For example, you could cap specialized asset classes such as REITs and gold at 5% or 10% of assets, or specify that you always want to have a meaningful level of exposure to international stocks.
Use correlations with care. Modern Portfolio Theory holds that a portfolio's risk level isn't just the sum of its individual components, but also depends on how the holdings interact with each other. As a result, combining asset classes with low correlations can significantly reduce the portfolio's overall risk profile. It's one of the few cases where the whole can be more than the sum of the parts; a well-constructed portfolio can have better risk-adjusted returns than its component parts alone. The problem is that correlation coefficients shift over time, so what worked in the past won't necessarily work in the future.
For example, correlations for REITs have trended up significantly in recent years. If they remain relatively high, REITs won’t add as much diversification value as backward-looking optimizers would suggest.
Conclusion The ease with which portfolio optimizers can craft an "optimal" portfolio based on historical inputs is ultimately their biggest downfall. Most investors would probably rather have an optimal portfolio instead of one that's just okay. But it's impossible to determine in advance which portfolio will maximize risk-adjusted returns without having an accurate forecast of returns, risk, and correlations between asset classes. And unfortunately, those forecasts are notoriously hard to get right. Optimizers can still be a useful tool, but they're best used with a healthy dose of skepticism and an understanding of their limitations.
/cloudfront-us-east-1.images.arcpublishing.com/morningstar/6ZMXY4RCRNEADPDWYQVTTWALWM.jpg)
/cloudfront-us-east-1.images.arcpublishing.com/morningstar/URSWZ2VN4JCXXALUUYEFYMOBIE.png)
/cloudfront-us-east-1.images.arcpublishing.com/morningstar/CGEMAKSOGVCKBCSH32YM7X5FWI.png)
:quality(80)/s3.amazonaws.com/arc-authors/morningstar/360a595b-3706-41f3-862d-b9d4d069160e.jpg)