
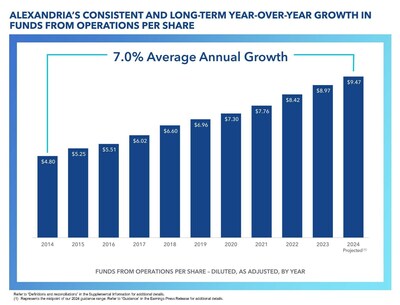
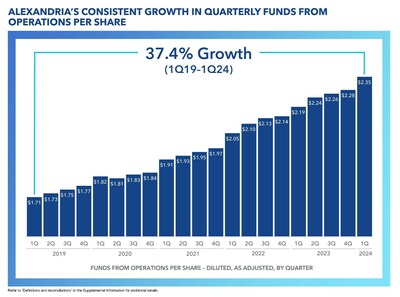
Alexandria Real Estate Equities, Inc. Reports: 1Q24 Net Income per Share - Diluted of $0.97; and 1Q24 FFO per Share - Diluted, as Adjusted, of $2.35
Alexandria Real Estate Equities, Inc. Reports: 1Q24 Net Income per Share - Diluted of $0.97; and 1Q24 FFO per Share - Diluted, as Adjusted, of $2.35
PR Newswire
PASADENA, Calif., April 22, 2024
![]()
PASADENA, Calif., April 22, 2024 /PRNewswire/ -- Alexandria Real Estate Equities, Inc. (NYSE: ARE) announced financial and operating results for the first quarter ended March 31, 2024.

Key highlights | |||
Operating results | 1Q24 | 1Q23 | |
Total revenues: | |||
In millions | $ 769.1 | $ 700.8 | |
Growth | 9.7 % | ||
Net income attributable to Alexandria's common stockholders – diluted: | |||
In millions | $ 166.9 | $ 75.3 | |
Per share | $ 0.97 | $ 0.44 | |
Funds from operations attributable to Alexandria's common stockholders – diluted, as adjusted: | |||
In millions | $ 403.9 | $ 373.7 | |
Per share | $ 2.35 | $ 2.19 |
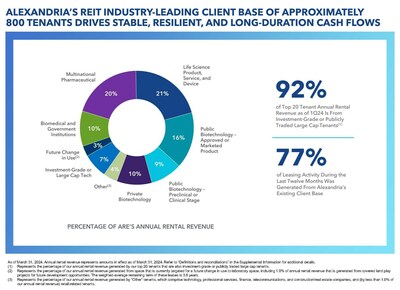
An operationally excellent, industry-leading REIT with a high-quality, diverse client base to support growing revenues, stable cash flows, and strong margins
Percentage of annual rental revenue in effect from mega campuses as of March 31, 2024 | 74 % | |||
Percentage of annual rental revenue in effect from investment-grade or publicly traded large cap tenants as of March 31, 2024 | 52 % | |||
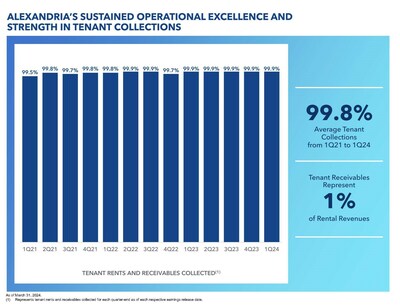
Sustained strength in tenant collections: | ||||
Tenant receivables as of March 31, 2024 represent 1.0% of rental revenues | $ 7.5 | million | ||
April 2024 tenant rents and receivables collected as of April 22, 2024 | 99.7 % | |||
1Q24 tenant rents and receivables collected as of April 22, 2024 | 99.9 % | |||
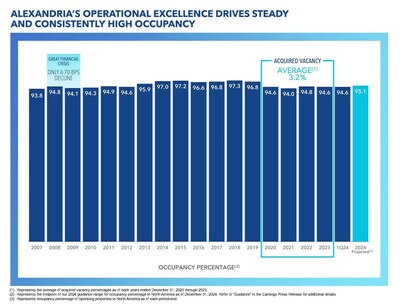
Occupancy of operating properties in North America as of March 31, 2024 | 94.6 % | |||
Operating margin | 72 % | |||
Adjusted EBITDA margin | 72 % | |||
Weighted-average remaining lease term as of March 31, 2024: | ||||
Top 20 tenants | 9.7 | years | ||
All tenants | 7.5 | years |
Strong leasing volume and rental rate increases
- Strong rental rate increases of 33.0% and 19.0% (cash basis).
- Strong leasing volume aggregating 1.1 million RSF during 1Q24.
- 77% of our leasing activity during the last twelve months was generated from our existing tenant base.
1Q24 | ||||||
Total leasing activity – RSF | 1,142,857 | |||||
Leasing of development and redevelopment space – RSF | 100,232 | |||||
Lease renewals and re-leasing of space: | ||||||
RSF (included in total leasing activity above) | 994,770 | |||||
Rental rate increase | 33.0 % | |||||
Rental rate increase (cash basis) | 19.0 % |
Continued solid net operating income and internal growth
- Net operating income (cash basis) of $1.9 billion for 1Q24 annualized, up $132.7 million, or 7.6%, compared to 1Q23 annualized.
- Same property net operating income growth of 1.0% and 4.2% (cash basis) for 1Q24 over 1Q23.
- 96% of our leases contain contractual annual rent escalations approximating 3%.
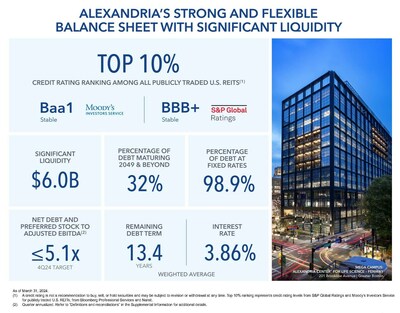
Strong and flexible balance sheet with significant liquidity; top 10% credit rating ranking among all publicly traded U.S. REITs
- Net debt and preferred stock to Adjusted EBITDA of 5.2x and fixed-charge coverage ratio of 4.7x for 1Q24 annualized.
- Significant liquidity of $6.0 billion.
- 32% of our total debt matures in 2049 and beyond.
- 13.4 years weighted-average remaining term of debt.
- 98.9% of our debt has a fixed rate.
- Total debt and preferred stock to gross assets of 28%.
- $1.3 billion of expected capital contribution commitments from existing consolidated real estate joint venture partners to fund construction from 2Q24 through 2027.
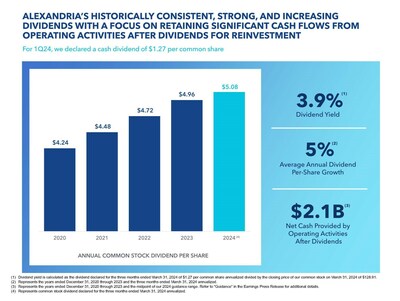
Consistent dividend strategy with a focus on retaining significant net cash flows from operating activities after dividends for reinvestment
- Common stock dividend declared for 1Q24 of $1.27 per common share, aggregating $5.02 per common share for the twelve months ended March 31, 2024, up 24 cents, or 5%, over the twelve months ended March 31, 2023.
- Dividend yield of 3.9% as of March 31, 2024.
- Dividend payout ratio of 54% for the three months ended March 31, 2024.
- Average annual dividend per-share growth of 5% from 2020 through 1Q24 annualized.
- Significant net cash flows from operating activities after dividends retained for reinvestment aggregating $2.1 billion for the years ended December 31, 2020 through 2023 and for the midpoint of our 2024 guidance range for net cash provided by operating activities after dividends.
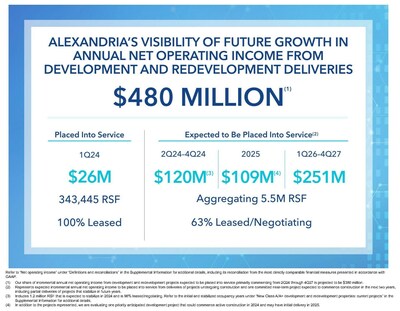
Alexandria's highly leased value-creation pipeline delivered incremental annual net operating income of $26 million commencing during 1Q24 and will drive future incremental annual net operating income aggregating $480 million
- During 1Q24, we placed into service development and redevelopment projects aggregating 343,445 RSF that are 100% leased across multiple submarkets and delivered incremental annual net operating income of $26 million. 1Q24 deliveries include:
- 100,624 RSF at 500 North Beacon Street located on The Arsenal on the Charles mega campus in our Cambridge/Inner Suburbs submarket;
- 115,598 RSF at the Alexandria Center® for Advanced Technologies – Monte Villa Parkway in our Bothell submarket; and
- 72,846 RSF at 99 Coolidge Avenue in our Cambridge/Inner Suburbs submarket.
- Annual net operating income (cash basis) is expected to increase by $101 million upon the burn-off of initial free rent from recently delivered projects. Initial free rent has a weighted-average burn-off period of approximately seven months.
- 69% of the RSF in our total value-creation pipeline is within our mega campuses.
Development and Redevelopment Projects | Incremental Annual Net Operating Income | RSF | Leased/ Negotiating Percentage | |||||||||
(dollars in millions) | ||||||||||||
Placed into service in 1Q24 | $ 26 | 343,445 | 100 % | |||||||||
Expected to be placed into service(1): | ||||||||||||
2Q24 through 4Q24 | $ 120 | (2) | 5,541,380 | 63 % | ||||||||
2025 | 109 | (3) | (4) | |||||||||
1Q26 through 4Q27 | 251 | |||||||||||
$ 480 | ||||||||||||
(1) | Represents expected incremental annual net operating income to be placed into service from deliveries of projects undergoing construction and one committed near-term project expected to commence construction in the next two years, including partial deliveries of projects that stabilize in future years. | |||
(2) | Includes 1.2 million RSF that is expected to stabilize in 2024 and is 98% leased/negotiating. Refer to the initial and stabilized occupancy years under "New Class A/A+ development and redevelopment properties: current projects" in the Supplemental Information for additional details. | |||
(3) | In addition to the projects represented, we are evaluating one priority anticipated development project that could commence active construction in 2024 and may have initial delivery in 2025. | |||
(4) | 72% of the leased RSF of our value-creation projects was generated from our existing tenant base. |
Strong balance sheet management
Key metrics as of or for the three months ended March 31, 2024
- $34.4 billion in total market capitalization.
- $22.2 billion in total equity capitalization, which ranks in the top 10% among all publicly traded U.S. REITs.
1Q24 | Target | |||||
Quarter | Trailing | 4Q24 | ||||
Net debt and preferred stock to Adjusted EBITDA | 5.2x | 5.6x | Less than or equal to 5.1x | |||
Fixed-charge coverage ratio | 4.7x | 4.7x | Greater than or equal to 4.5x |
Key capital events
- In February 2024, we issued $1.0 billion of unsecured senior notes payable with a weighted-average interest rate of 5.48% and a weighted-average maturity of 23.1 years. The unsecured senior notes include:
- $400.0 million of 5.25% unsecured senior notes due 2036; and
- $600.0 million of 5.625% unsecured senior notes due 2054.
- In January 2024, our ATM program became inactive upon expiration of the associated shelf registration. In February 2024, we entered into a new ATM common stock offering program, which allows us to sell up to an aggregate of $1.5 billion of our common stock. As of April 22, 2024, the full amount remained available for future sales of our common stock.
Investments
- As of March 31, 2024:
- Our non-real estate investments aggregated $1.5 billion.
- Unrealized gains presented in our consolidated balance sheet were $220.2 million, comprising gross unrealized gains and losses aggregating $320.4 million and $100.2 million, respectively.
- Investment income of $43.3 million for 1Q24 presented in our consolidated statement of operations consisted of $28.8 million of realized gains, partially offset by impairment charges of $14.7 million, and $29.2 million of unrealized gains.
Other key highlights
Key items included in net income attributable to Alexandria's common stockholders:
| ||||||||
1Q24 | 1Q23 | 1Q24 | 1Q23 | |||||
(in millions, except per share amounts) | Amount | Per Share – Diluted | ||||||
Unrealized gains (losses) on non-real estate investments | $ 29.2 | $ (65.9) | $ 0.17 | $ (0.39) | ||||
Gain on sales of real estate | 0.4 | — | — | — | ||||
Impairment of non-real estate investments | (14.7) | — | (0.09) | — | ||||
Total | $ 14.9 | $ (65.9) | $ 0.08 | $ (0.39) | ||||
Refer to "Funds from operations and funds from operations per share" in the Earnings Press Release for additional details. |
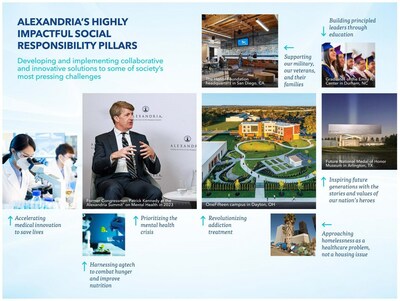
Industry and corporate responsibility leadership: catalyzing and leading the way for positive change to benefit human health and society
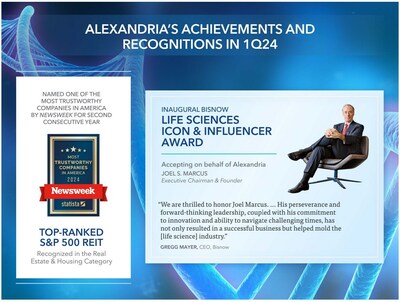
- In March 2024, Alexandria was named one of Newsweek's Most Trustworthy Companies in America for the second consecutive year based on three touchpoints of trust: customer trust, investor trust, and employee trust. On the 2024 list, Alexandria holds the top rank among the three S&P 500 REITs recognized in the real estate and housing category.
- In March 2024, Alexandria's executive chairman and founder, Joel S. Marcus, was selected to receive the inaugural Bisnow Life Sciences Icon & Influencer Award. This prestigious award highlights Mr. Marcus and the company's significant contributions to and lasting impact on the life science real estate sector and broader life science industry. Mr. Marcus will accept the award on behalf of Alexandria at Bisnow's International Life Sciences & Biotech Conference in September 2024.
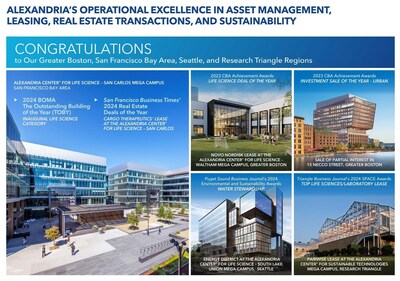
- During 1Q24, Alexandria earned several awards in recognition of operational excellence in asset management, leasing, real estate transactions, and sustainability across our regions:
- In our Greater Boston market, Alexandria won two 2023 Commercial Broker Association Achievement Awards: Life Science Deal of the Year for our lease with Novo Nordisk at 60 Sylvan Road on the Alexandria Center® for Life Science – Waltham mega campus and Investment Sale of the Year – Urban for our strategic sale of partial interest in 15 Necco Street.
- In our San Francisco Bay Area market, the Alexandria Center® for Life Science – San Carlos mega campus won a TOBY (The Outstanding Building of the Year) Award from BOMA (Building Owners and Managers Association) in the region's new Life Science category. Alexandria also received a San Francisco Business Times' 2024 Real Estate Deal of the Year Award for our lease with CARGO Therapeutics, a clinical-stage biotechnology company, at 835 Industrial Road on this mega campus.
- In our Seattle market, Alexandria was an honoree in the Water Stewardship category of the Puget Sound Business Journal's 2024 Environmental and Sustainability Awards in recognition of our implementation of an innovative energy district at the Alexandria Center® for Life Science – South Lake Union mega campus featuring one of the largest wastewater heat recovery systems in North America. This wastewater heat recovery system, which will provide an alternative energy source to heat our buildings and enhance building resilience and operating performance, demonstrates our continued focus on reducing greenhouse gas emissions in our laboratory facilities.
- In our Research Triangle market, we earned the Top Life Sciences/Laboratory Lease in the Triangle Business Journal's 2024 SPACE Awards for our lease with Pairwise, a health-focused food and agriculture company, at 110 and 112 TW Alexander Drive on the Alexandria Center® for Sustainable Technologies mega campus. The annual SPACE Awards recognize the Research Triangle's top commercial real estate developments and transactions.
- In February 2024, Alexandria, in partnership with former congressman Patrick J. Kennedy and The Kennedy Forum, held its second Alexandria Summit® on Mental Health in Washington, DC. Alexandria convened a diverse set of key decision makers, influential life science industry thought leaders, members of Congress, regulatory agency executives, and other key policymakers to advance the development of novel, effective psychiatric therapies to address vast unmet need.
About Alexandria Real Estate Equities, Inc.
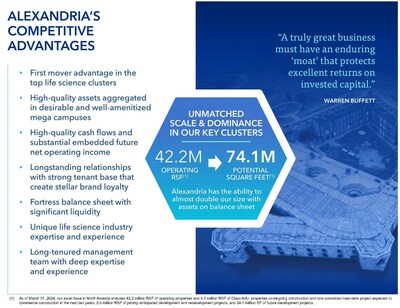
Alexandria Real Estate Equities, Inc. (NYSE: ARE), an S&P 500® company, is a best-in-class, mission-driven life science REIT making a positive and lasting impact on the world. As the pioneer of the life science real estate niche since our founding in 1994, Alexandria is the preeminent and longest-tenured owner, operator, and developer of collaborative life science mega campuses in AAA innovation cluster locations, including Greater Boston, the San Francisco Bay Area, San Diego, Seattle, Maryland, Research Triangle, and New York City. Alexandria has a total market capitalization of $34.4 billion and an asset base in North America of 74.1 million SF as of March 31, 2024, which includes 42.2 million RSF of operating properties, 5.3 million RSF of Class A/A+ properties undergoing construction and one committed near-term project expected to commence construction in the next two years, 2.5 million RSF of priority anticipated development and redevelopment projects, and 24.1 million SF of future development projects. Alexandria has a longstanding and proven track record of developing Class A/A+ properties clustered in life science mega campuses that provide our innovative tenants with highly dynamic and collaborative environments that enhance their ability to successfully recruit and retain world-class talent and inspire productivity, efficiency, creativity, and success. Alexandria also provides strategic capital to transformative life science companies through our venture capital platform. We believe our unique business model and diligent underwriting ensure a high-quality and diverse tenant base that results in higher occupancy levels, longer lease terms, higher rental income, higher returns, and greater long-term asset value. For additional information on Alexandria, please visit www.are.com.
Guidance | |
The following guidance for 2024 has been updated to reflect our current view of existing market conditions and assumptions for the year ending December 31, 2024. on page 7 of this Earnings Press Release for additional details. Key updates to our 2024 guidance from January 29, 2024 include updates to earnings per share, funds from operations per share, and funds from operations per share, as adjusted, as shown in the table below. We updated our guidance range for 2024 earnings per share and funds from operations per share. In addition, we narrowed our guidance range for 2024 funds from operations per share, as adjusted, to 12 cents from 20 cents with the midpoint of $9.47 unchanged from our prior guidance on January 29, 2024. |
Key Credit Metric Targets(1) | ||
Net debt and preferred stock to Adjusted EBITDA – 4Q24 annualized | Less than or equal to 5.1x | |
Fixed-charge coverage ratio – 4Q24 annualized | Greater than or equal to 4.5x |
Projected 2024 Earnings per Share and Funds From Operations per Share Attributable to Alexandria's Common Stockholders – Diluted | |||||||||
As of 4/22/2024 | As of 1/29/2024 | ||||||||
Earnings per share(2) | $3.60 to $3.72 | $3.49 to $3.69 | |||||||
Depreciation and amortization of real estate assets | 5.95 | 5.95 | |||||||
Allocation to unvested restricted stock awards | (0.06) | (0.07) | |||||||
Funds from operations per share(1) | $9.49 to $9.61 | $9.37 to $9.57 | |||||||
Unrealized gains on non-real estate investments | (0.17) | — | |||||||
Impairment of non-real estate investments | 0.09 | — | |||||||
Funds from operations per share, as adjusted(1) | $9.41 to $9.53 | $9.37 to $9.57 | |||||||
Midpoint | $9.47 | $9.47 |
Key Sources and Uses of Capital | Range | Midpoint | ||||
Sources of capital: | ||||||
Incremental debt | $ 900 | $ 900 | $ 900 | |||
Net cash provided by operating activities after dividends | 400 | 500 | 450 | |||
Dispositions, sales of partial interests, and common equity(3) | 900 | 1,900 | 1,400 | |||
Total sources of capital | $ 2,200 | $ 3,300 | $ 2,750 | |||
Uses of capital: | ||||||
Construction | $ 1,950 | $ 2,550 | $ 2,250 | |||
Acquisitions | 250 | 750 | 500 | |||
Total uses of capital | $ 2,200 | $ 3,300 | $ 2,750 | |||
Incremental debt (included above): | ||||||
Issuance of unsecured senior notes payable(4) | $ 1,000 | $ 1,000 | $ 1,000 | |||
Unsecured senior line of credit, commercial paper, and other | (100) | (100) | (100) | |||
Net incremental debt | $ 900 | $ 900 | $ 900 |
Key Assumptions | Low | High | |||
Occupancy percentage in North America as of December 31, 2024 | 94.6 % | 95.6 % | |||
Lease renewals and re-leasing of space: | |||||
Rental rate increases | 11.0 % | 19.0 % | |||
Rental rate increases (cash basis) | 5.0 % | 13.0 % | |||
Same property performance: | |||||
Net operating income increases | 0.5 % | 2.5 % | |||
Net operating income increases (cash basis) | 3.0 % | 5.0 % | |||
Straight-line rent revenue | $ 169 | $ 184 | |||
General and administrative expenses | $ 181 | $ 191 | |||
Capitalization of interest | $ 325 | $ 355 | |||
Interest expense | $ 154 | $ 184 | |||
Realized gains on non-real estate investments(5) | $ 95 | $ 125 |
(1) | Refer to "Definitions and reconciliations" in the Supplemental Information for additional details. |
(2) | Excludes unrealized gains or losses on non-real estate investments after March 31, 2024 that are required to be recognized in earnings and are excluded from funds from operations per share, as adjusted. |
(3) | We expect to continue pursuing our strategy to fund a significant portion of our capital requirements for the year ending December 31, 2024 with dispositions and sales of partial interests and are actively pursuing several dispositions and partial interest sale opportunities. In February 2024, we entered into a new ATM common stock offering program, which allows us to sell up to an aggregate of $1.5 billion of our common stock. As of April 22, 2024, the full amount remained available for future sales of our common stock. |
(4) | In February 2024, we issued $1.0 billion of unsecured senior notes payable with a weighted-average interest rate of 5.48% and a weighted-average maturity of 23.1 years. The unsecured senior notes consisted of $400.0 million of 5.25% unsecured senior notes due 2036 and $600.0 million of 5.625% unsecured senior notes due 2054. Our 2024 guidance for issuance of unsecured senior notes payable assumes we issue new unsecured senior notes payable in 2025 to fund the repayment of our $600.0 million unsecured senior notes payable due on April 30, 2025. Subject to market conditions, we may seek opportunities in 2024 to fund the repayment of our 2025 debt maturity through issuance of additional unsecured senior notes payable. |
(5) | Represents realized gains and losses included in funds from operations per share – diluted, as adjusted, and excludes significant impairments realized on non-real estate investments, if any. Refer to "Investments" in the Supplemental Information for additional details. |
Acquisitions March 31, 2024 (Dollars in thousands)
| |||||||||||||
Property | Submarket/Market | Date of Purchase | Operating Occupancy | Future Development RSF(1) | Purchase Price | ||||||||
Completed in 1Q24: | |||||||||||||
285, 299, 307, and 345 Dorchester Avenue (60% interest in consolidated JV) | Seaport Innovation District/Greater Boston | 1/30/24 | N/A | 1,040,000 | $ | 155,321 | |||||||
Other | 39,490 | ||||||||||||
194,811 | |||||||||||||
Completed in April 2024 | 7,000 | ||||||||||||
Pending acquisitions subject to signed letters of intent or purchase and sale agreements | 75,350 | ||||||||||||
$ | 277,161 | ||||||||||||
2024 guidance range | $250,000 – $750,000 | ||||||||||||
(1) | We expect to provide total estimated costs and related yields for development and redevelopment projects in the future, subsequent to the commencement of construction. |
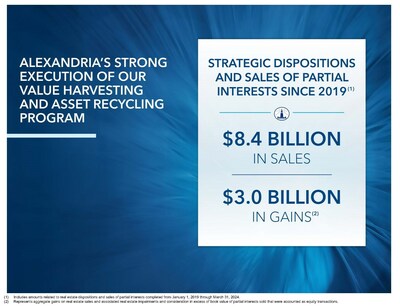
Dispositions and Sales of Partial Interests March 31, 2024 (Dollars in thousands)
| ||||||||||||
Property | Submarket/Market | Date of Sale | Interest Sold | RSF | Sales Price | |||||||
Value harvesting dispositions of 100% interest in properties not integral to our mega campus strategy | ||||||||||||
Completed in 1Q24: | ||||||||||||
99 A Street(1) | Seaport Innovation District/Greater Boston | 3/8/24 | 100 % | 235,000 | $ 13,350 | |||||||
Other | 3,863 | |||||||||||
17,213 | ||||||||||||
Pending transactions subject to letters of intent or purchase and sale agreement negotiations | 258,095 | |||||||||||
Additional targeted dispositions and sales of partial interests | TBD | |||||||||||
$ 275,308 | ||||||||||||
(1) | We completed the sale during the three months ended March 31, 2024 and recognized no gain or loss. |
Earnings Call Information and About the Company
March 31, 2024
We will host a conference call on Tuesday, April 23, 2024, at 3:00 p.m. Eastern Time ("ET")/noon Pacific Time ("PT"), which is open to the general public, to discuss our financial and operating results for the first quarter ended March 31, 2024. To participate in this conference call, dial (833) 366-1125 or (412) 902-6738 shortly before 3:00 p.m. ET/noon PT and ask the operator to join the call for Alexandria Real Estate Equities, Inc. The audio webcast can be accessed at www.are.com in the "For Investors" section. A replay of the call will be available for a limited time from 5:00 p.m. ET/2:00 p.m. PT on Tuesday, April 23, 2024. The replay number is (877) 344-7529 or (412) 317-0088, and the access code is 1133562.
Additionally, a copy of this Earnings Press Release and Supplemental Information for the first quarter ended March 31, 2024 is available in the "For Investors" section of our website at www.are.com or by following this link: https://www.are.com/fs/2024q1.pdf.
For any questions, please contact corporateinformation@are.com; Joel S. Marcus, executive chairman and founder; Peter M. Moglia, chief executive officer and chief investment officer; Marc E. Binda, chief financial officer and treasurer; Paula Schwartz, managing director of Rx Communications Group, at (917) 633-7790; or Sara M. Kabakoff, senior vice president – chief content officer.
About the Company
Alexandria Real Estate Equities, Inc. (NYSE: ARE), an S&P 500® company, is a best-in-class, mission-driven life science REIT making a positive and lasting impact on the world. As the pioneer of the life science real estate niche since our founding in 1994, Alexandria is the preeminent and longest-tenured owner, operator, and developer of collaborative life science mega campuses in AAA innovation cluster locations, including Greater Boston, the San Francisco Bay Area, San Diego, Seattle, Maryland, Research Triangle, and New York City. Alexandria has a total market capitalization of $34.4 billion and an asset base in North America of 74.1 million SF as of March 31, 2024, which includes 42.2 million RSF of operating properties, 5.3 million RSF of Class A/A+ properties undergoing construction and one committed near-term project expected to commence construction in the next two years, 2.5 million RSF of priority anticipated development and redevelopment projects, and 24.1 million SF of future development projects. Alexandria has a longstanding and proven track record of developing Class A/A+ properties clustered in life science mega campuses that provide our innovative tenants with highly dynamic and collaborative environments that enhance their ability to successfully recruit and retain world-class talent and inspire productivity, efficiency, creativity, and success. Alexandria also provides strategic capital to transformative life science companies through our venture capital platform. We believe our unique business model and diligent underwriting ensure a high-quality and diverse tenant base that results in higher occupancy levels, longer lease terms, higher rental income, higher returns, and greater long-term asset value. For additional information on Alexandria, please visit www.are.com.
Forward-Looking Statements
This document includes "forward-looking statements" within the meaning of Section 27A of the Securities Act of 1933, as amended, and Section 21E of the Securities Exchange Act of 1934, as amended. Such forward-looking statements include, without limitation, statements regarding our 2024 earnings per share, 2024 funds from operations per share, 2024 funds from operations per share, as adjusted, net operating income, and our projected sources and uses of capital. You can identify the forward-looking statements by their use of forward-looking words, such as "forecast," "guidance," "goals," "projects," "estimates," "anticipates," "believes," "expects," "intends," "may," "plans," "seeks," "should," "targets," or "will," or the negative of those words or similar words. These forward-looking statements are based on our current expectations, beliefs, projections, future plans and strategies, anticipated events or trends, and similar expressions concerning matters that are not historical facts, as well as a number of assumptions concerning future events. There can be no assurance that actual results will not be materially higher or lower than these expectations. These statements are subject to risks, uncertainties, assumptions, and other important factors that could cause actual results to differ materially from the results discussed in the forward-looking statements. Factors that might cause such a difference include, without limitation, our failure to obtain capital (debt, construction financing, and/or equity) or refinance debt maturities, lower than expected yields, increased interest rates and operating costs, adverse economic or real estate developments in our markets, our failure to successfully place into service and lease any properties undergoing development or redevelopment and our existing space held for future development or redevelopment (including new properties acquired for that purpose), our failure to successfully operate or lease acquired properties, decreased rental rates, increased vacancy rates or failure to renew or replace expiring leases, defaults on or non-renewal of leases by tenants, adverse general and local economic conditions, an unfavorable capital market environment, decreased leasing activity or lease renewals, failure to obtain LEED and other healthy building certifications and efficiencies, and other risks and uncertainties detailed in our filings with the Securities and Exchange Commission ("SEC"). Accordingly, you are cautioned not to place undue reliance on such forward-looking statements. All forward-looking statements are made as of the date of this Earnings Press Release and Supplemental Information, and unless otherwise stated, we assume no obligation to update this information and expressly disclaim any obligation to update or revise any forward-looking statements, whether as a result of new information, future events, or otherwise. For more discussion relating to risks and uncertainties that could cause actual results to differ materially from those anticipated in our forward-looking statements, and risks to our business in general, please refer to our SEC filings, including our most recent annual report on Form 10-K and any subsequent quarterly reports on Form 10-Q.
This document is not an offer to sell or a solicitation to buy securities of Alexandria Real Estate Equities, Inc. Any offers to sell or solicitations to buy our securities shall be made only by means of a prospectus approved for that purpose. Unless otherwise indicated, the "Company," "Alexandria," "ARE," "we," "us," and "our" refer to Alexandria Real Estate Equities, Inc. and our consolidated subsidiaries. Alexandria®, Lighthouse Design® logo, Building the Future of Life-Changing Innovation®, That's What's in Our DNA®, At the Vanguard and Heart of the Life Science Ecosystem™, Alexandria Center®, Alexandria Technology Square®, Alexandria Technology Center®, and Alexandria Innovation Center® are copyrights and trademarks of Alexandria Real Estate Equities, Inc. All other company names, trademarks, and logos referenced herein are the property of their respective owners.
Consolidated Statements of Operations March 31, 2024 (Dollars in thousands, except per share amounts)
| ||||||||||
Three Months Ended | ||||||||||
3/31/24 | 12/31/23 | 9/30/23 | 6/30/23 | 3/31/23 | ||||||
Revenues: | ||||||||||
Income from rentals | $ 755,551 | $ 742,637 | $ 707,531 | $ 704,339 | $ 687,949 | |||||
Other income | 13,557 | 14,579 | 6,257 | 9,561 | 12,846 | |||||
Total revenues | 769,108 | 757,216 | 713,788 | 713,900 | 700,795 | |||||
Expenses: | ||||||||||
Rental operations | 218,314 | 222,726 | 217,687 | 211,834 | 206,933 | |||||
General and administrative | 47,055 | 59,289 | 45,987 | 45,882 | 48,196 | |||||
Interest | 40,840 | 31,967 | 11,411 | 17,072 | 13,754 | |||||
Depreciation and amortization | 287,554 | 285,246 | 269,370 | 273,555 | 265,302 | |||||
Impairment of real estate | — | 271,890 | 20,649 | 168,575 | — | |||||
Total expenses | 593,763 | 871,118 | 565,104 | 716,918 | 534,185 | |||||
Equity in earnings of unconsolidated real estate joint ventures | 155 | 363 | 242 | 181 | 194 | |||||
Investment income (loss) | 43,284 | 8,654 | (80,672) | (78,268) | (45,111) | |||||
Gain on sales of real estate | 392 | 62,227 | — | 214,810 | — | |||||
Net income (loss) | 219,176 | (42,658) | 68,254 | 133,705 | 121,693 | |||||
Net income attributable to noncontrolling interests | (48,631) | (45,771) | (43,985) | (43,768) | (43,831) | |||||
Net income (loss) attributable to Alexandria Real Estate Equities, Inc.'s stockholders | 170,545 | (88,429) | 24,269 | 89,937 | 77,862 | |||||
Net income attributable to unvested restricted stock awards | (3,659) | (3,498) | (2,414) | (2,677) | (2,606) | |||||
Net income (loss) attributable to Alexandria Real Estate Equities, Inc.'s common stockholders | $ 166,886 | $ (91,927) | $ 21,855 | $ 87,260 | $ 75,256 | |||||
Net income (loss) per share attributable to Alexandria Real Estate Equities, Inc.'s common stockholders: | ||||||||||
Basic | $ 0.97 | $ (0.54) | $ 0.13 | $ 0.51 | $ 0.44 | |||||
Diluted | $ 0.97 | $ (0.54) | $ 0.13 | $ 0.51 | $ 0.44 | |||||
Weighted-average shares of common stock outstanding: | ||||||||||
Basic | 171,949 | 171,096 | 170,890 | 170,864 | 170,784 | |||||
Diluted | 171,949 | 171,096 | 170,890 | 170,864 | 170,784 | |||||
Dividends declared per share of common stock | $ 1.27 | $ 1.27 | $ 1.24 | $ 1.24 | $ 1.21 |
Consolidated Balance Sheets March 31, 2024 (In thousands) | ||||||||||
3/31/24 | 12/31/23 | 9/30/23 | 6/30/23 | 3/31/23 | ||||||
Assets | ||||||||||
Investments in real estate | $ 32,323,138 | $ 31,633,511 | $ 31,712,731 | $ 31,178,054 | $ 30,889,395 | |||||
Investments in unconsolidated real estate joint ventures | 40,636 | 37,780 | 37,695 | 37,801 | 38,355 | |||||
Cash and cash equivalents | 722,176 | 618,190 | 532,390 | 924,370 | 1,263,452 | |||||
Restricted cash | 9,519 | 42,581 | 35,321 | 35,920 | 34,932 | |||||
Tenant receivables | 7,469 | 8,211 | 6,897 | 6,951 | 8,197 | |||||
Deferred rent | 1,138,936 | 1,050,319 | 1,012,666 | 984,366 | 974,865 | |||||
Deferred leasing costs | 520,616 | 509,398 | 512,216 | 520,610 | 527,848 | |||||
Investments | 1,511,588 | 1,449,518 | 1,431,766 | 1,495,994 | 1,573,018 | |||||
Other assets | 1,424,968 | 1,421,894 | 1,501,611 | 1,475,191 | 1,602,403 | |||||
Total assets | $ 37,699,046 | $ 36,771,402 | $ 36,783,293 | $ 36,659,257 | $ 36,912,465 | |||||
Liabilities, Noncontrolling Interests, and Equity | ||||||||||
Secured notes payable | $ 130,050 | $ 119,662 | $ 109,110 | $ 91,939 | $ 73,645 | |||||
Unsecured senior notes payable | 12,087,113 | 11,096,028 | 11,093,725 | 11,091,424 | 11,089,124 | |||||
Unsecured senior line of credit and commercial paper | — | 99,952 | — | — | 374,536 | |||||
Accounts payable, accrued expenses, and other liabilities | 2,503,831 | 2,610,943 | 2,653,126 | 2,494,087 | 2,479,047 | |||||
Dividends payable | 222,134 | 221,824 | 214,450 | 214,555 | 209,346 | |||||
Total liabilities | 14,943,128 | 14,148,409 | 14,070,411 | 13,892,005 | 14,225,698 | |||||
Commitments and contingencies | ||||||||||
Redeemable noncontrolling interests | 16,620 | 16,480 | 51,658 | 52,628 | 44,862 | |||||
Alexandria Real Estate Equities, Inc.'s stockholders' equity: | ||||||||||
Common stock | 1,720 | 1,719 | 1,710 | 1,709 | 1,709 | |||||
Additional paid-in capital | 18,434,690 | 18,485,352 | 18,651,185 | 18,812,318 | 18,902,821 | |||||
Accumulated other comprehensive loss | (23,815) | (15,896) | (24,984) | (16,589) | (20,536) | |||||
Alexandria Real Estate Equities, Inc.'s stockholders' equity | 18,412,595 | 18,471,175 | 18,627,911 | 18,797,438 | 18,883,994 | |||||
Noncontrolling interests | 4,326,703 | 4,135,338 | 4,033,313 | 3,917,186 | 3,757,911 | |||||
Total equity | 22,739,298 | 22,606,513 | 22,661,224 | 22,714,624 | 22,641,905 | |||||
Total liabilities, noncontrolling interests, and equity | $ 37,699,046 | $ 36,771,402 | $ 36,783,293 | $ 36,659,257 | $ 36,912,465 |
Funds From Operations and Funds From Operations per Share |
The following table presents a reconciliation of net income (loss) attributable to Alexandria's common stockholders, the most directly comparable financial measure presented in accordance with U.S. generally accepted accounting principles ("GAAP"), including our share of amounts from consolidated and unconsolidated real estate joint ventures, to funds from operations attributable to Alexandria's common stockholders – diluted, and funds from operations attributable to Alexandria's common stockholders – diluted, as adjusted, for the periods below: |
Three Months Ended | ||||||||||
3/31/24 | 12/31/23 | 9/30/23 | 6/30/23 | 3/31/23 | ||||||
Net income (loss) attributable to Alexandria's common stockholders | $ 166,886 | $ (91,927) | $ 21,855 | $ 87,260 | $ 75,256 | |||||
Depreciation and amortization of real estate assets | 284,950 | 281,939 | 266,440 | 270,026 | 262,124 | |||||
Noncontrolling share of depreciation and amortization from consolidated real estate JVs | (30,904) | (30,137) | (28,814) | (28,220) | (28,178) | |||||
Our share of depreciation and amortization from unconsolidated real estate JVs | 1,034 | 965 | 910 | 855 | 859 | |||||
Gain on sales of real estate | (392) | (62,227) | — | (214,810) | — | |||||
Impairment of real estate – rental properties | — | 263,982 | 19,844 | 166,602 | — | |||||
Allocation to unvested restricted stock awards | (3,469) | (2,268) | (838) | (872) | (1,359) | |||||
Funds from operations attributable to Alexandria's common stockholders – diluted(1) | 418,105 | 360,327 | 279,397 | 280,841 | 308,702 | |||||
Unrealized (gains) losses on non-real estate investments | (29,158) | (19,479) | 77,202 | 77,897 | 65,855 | |||||
Impairment of non-real estate investments | 14,698 | (2) | 23,094 | 28,503 | 22,953 | — | ||||
Impairment of real estate | — | 7,908 | 805 | 1,973 | — | |||||
Acceleration of stock compensation expense due to executive officer resignations | — | 18,436 | 1,859 | — | — | |||||
Allocation to unvested restricted stock awards | 247 | (472) | (1,330) | (1,285) | (867) | |||||
Funds from operations attributable to Alexandria's common stockholders – diluted, as adjusted | $ 403,892 | $ 389,814 | $ 386,436 | $ 382,379 | $ 373,690 |
Refer to "Definitions and reconciliations" in the Supplemental Information for additional details. | |
(1) | Calculated in accordance with standards established by the Nareit Board of Governors. |
(2) | Primarily related to one non-real estate investment in a privately held entity that does not report NAV. |
Funds From Operations and Funds From Operations per Share (continued) |
The following table presents a reconciliation of net income (loss) per share attributable to Alexandria's common stockholders, the most directly comparable financial measure presented in accordance with GAAP, including our share of amounts from consolidated and unconsolidated real estate joint ventures, to funds from operations per share attributable to Alexandria's common stockholders – diluted, and funds from operations per share attributable to Alexandria's common stockholders – diluted, as adjusted, for the periods below. Per share amounts may not add due to rounding. |
Three Months Ended | ||||||||||
3/31/24 | 12/31/23 | 9/30/23 | 6/30/23 | 3/31/23 | ||||||
Net income (loss) per share attributable to Alexandria's common stockholders – diluted | $ 0.97 | $ (0.54) | $ 0.13 | $ 0.51 | $ 0.44 | |||||
Depreciation and amortization of real estate assets | 1.48 | 1.48 | 1.40 | 1.42 | 1.38 | |||||
Gain on sales of real estate | — | (0.36) | — | (1.26) | — | |||||
Impairment of real estate – rental properties | — | 1.54 | 0.12 | 0.98 | — | |||||
Allocation to unvested restricted stock awards | (0.02) | (0.01) | (0.01) | (0.01) | (0.01) | |||||
Funds from operations per share attributable to Alexandria's common stockholders – diluted | 2.43 | 2.11 | 1.64 | 1.64 | 1.81 | |||||
Unrealized (gains) losses on non-real estate investments | (0.17) | (0.11) | 0.45 | 0.46 | 0.39 | |||||
Impairment of non-real estate investments | 0.09 | 0.13 | 0.17 | 0.13 | — | |||||
Impairment of real estate | — | 0.05 | — | 0.02 | — | |||||
Loss on early extinguishment of debt | — | — | — | — | — | |||||
Acceleration of stock compensation expense due to executive officer resignations | — | 0.11 | 0.01 | — | — | |||||
Allocation to unvested restricted stock awards | — | (0.01) | (0.01) | (0.01) | (0.01) | |||||
Funds from operations per share attributable to Alexandria's common stockholders – diluted, as adjusted | $ 2.35 | $ 2.28 | $ 2.26 | $ 2.24 | $ 2.19 | |||||
Weighted-average shares of common stock outstanding – diluted | 171,949 | 171,096 | 170,890 | 170,864 | 170,784 |
Refer to "Definitions and reconciliations" in the Supplemental Information for additional details. |

SOURCE Alexandria Real Estate Equities, Inc.
-
What’s Happening In the Markets This Week
-
How the Tokyo Stock Exchange Is Pushing for Better Capital Allocation
-
Magnificent 7 Stocks Earnings Updates: AI Remains the Focus
-
Where We See Opportunities After an Ugly Month for Stocks
-
After Earnings, Is Alphabet Stock a Buy, a Sell, or Fairly Valued?
-
When Will the Fed Start Cutting Interest Rates?
-
What’s the Difference Between the CPI and PCE Indexes?
-
Powell Unfazed By Sticky Inflation, but Rate Cuts Are Far Off
-
3 Dividend Stocks for May 2024
-
Amgen Earnings: Obesity Drug Update Is Highly Encouraging
-
What’s Going on With Apple, Tesla, and Alphabet?
-
Apple Earnings: A Weak 2024, but Optimism for 2025
-
4 Utility Stocks to Play the AI Data Center Boom
-
Albemarle Earnings: We Expect Improved Results In the Rest of Year Following Cyclically Low Profits
-
Novo Nordisk Earnings: Raised Fair Value Estimate Still a Contrast to Market Overenthusiasm
-
After Earnings, Is Verizon Stock a Buy, a Sell, or Fairly Valued?