
What a Government Shutdown Would Mean for Stocks
Expect portfolio volatility during the debt battle in Congress.

On Sept. 25, the US Senate voted 78-18 to pass a bipartisan Continuing Resolution (CR; H.R. 9747) to extend federal spending and avert a government shutdown through Dec. 20. The US House passed the measure unanimously by voice vote also on Sept. 25, just days before the end of fiscal year 2024 on Sept. 30 and beginning of fiscal year 2025 on Oct. 1. After several weeks of uncertainty, Democratic and Republican leaders—from both chambers—announced a compromise package that would prevent a government shutdown and extend the next deadline until March. However, on Dec. 18, Elon Musk and Donald Trump recommended rejecting the deal, demanding that any resolution include a debt-ceiling increase, while also rejecting many Democratic spending demands. Thus, the risks of a shutdown have increased significantly, particularly with the Republican House holding the thinnest of majorities. Before reviewing the historical evidence, we need to review some key facts.
From Jan. 2, the US Treasury will no longer be able to boost the amount of debt that would be subject to the limit, which as of Dec. 18 stood at more than $36 trillion, $28 trillion of which is publicly held debt. Because the federal government will continue to spend more than it receives, the Treasury will need to run down its stockpile of cash in order to keep making good on obligations, including payments to government bondholders, retirees, and veterans. As of Dec. 17, that cash balance was about $831 billion. Importantly, that may be sufficient to keep the Treasury going for months. And in March, it’s set to receive a big influx of cash from individual tax payments, which are due in mid-April.
In the meantime, the Treasury will use accounting gimmicks (referred to as extraordinary measures), which have been used in the past repeatedly, to make sure its cash buffer doesn’t completely run out. These measures include suspending the reinvestment of Treasury securities held by various government funds, including retirement funds for government employees. Those accounts are then made whole later, once the debt limit is set aside or increased. However, these measures can only last so long. Bond market strategists have anticipated that moment would probably arrive between mid- to late 2025.
The Historical Evidence
One of my favorite expressions is “what you don’t know about investing is the investment history you don’t know.” With that in mind, I thought it would be helpful to review the historical evidence. Government shutdowns have occurred with a fair amount of frequency—since 1976 shutdowns have happened 20 times. Likely defying most investor expectations, the average return for the S&P 500 Index during government shutdowns has been flat. The logical explanation for the lack of much if any impact on stock prices is that investors assume any shutdown will be short-lived (due to pressures to reach an agreement), and thus any economic impact will be muted.
Flat Returns During Shutdowns
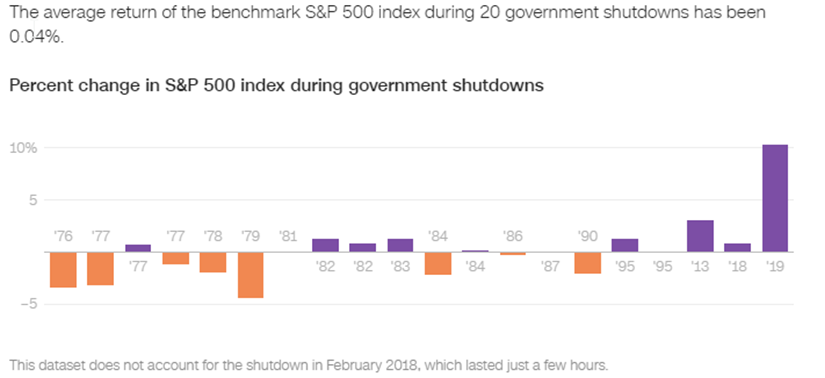
The longest shutdown of the US government occurred in 2018-19 and lasted for 35 days, from Dec. 22, 2018, to Jan. 25, 2019. During that time, approximately 800,000 federal employees were furloughed or required to work without pay. Despite that, as seen in the above chart, the S&P 500 rose 10.3%.
The historical evidence suggests that investors are best served by not acting on their fears. With that said, this time the battle over government funding centers on concerns over our country’s growing debt problem, which both parties have contributed to and neither party has been willing to address. The main sources of the rise in the deficit have been the wars in Iraq, Afghanistan, and Ukraine and increases in social spending programs without funding for those expenditures while cutting taxes.
To help investors understand the nature and depth of the debt problem, I’ll review the current situation, examine forecasts of the increasing size of the problem, and review the empirical research findings on the impact of a high-debt/gross domestic product ratio on economic growth.
The Growing Government Debt Problem
By the end of 1999, the government debt/GDP ratio had fallen to less than 40%, the lowest level since 1973. Unfortunately, 25% of all US government debt outstanding has been added just since the beginning of 2020. As of Dec. 18, publicly held Treasury securities outstanding had reached $28 trillion.
Federal Debt Held by the Public as Percent of Gross Domestic Product
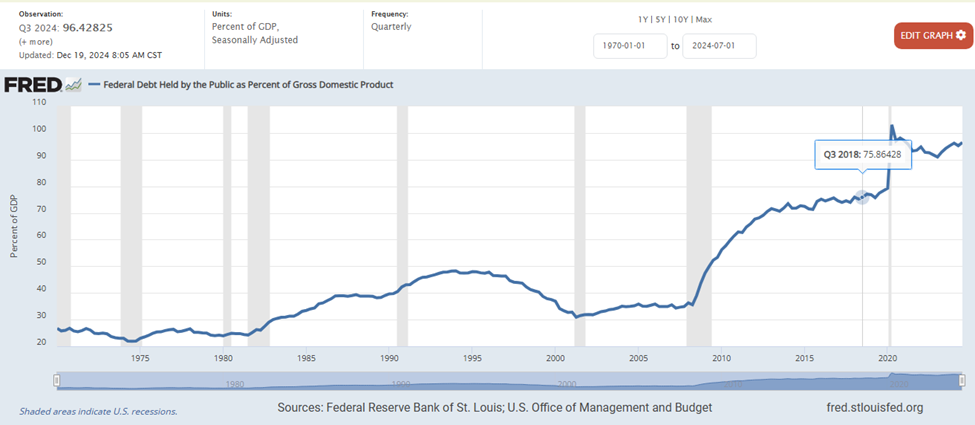
With higher debt levels and higher interest rates, debt-servicing costs have been increasing sharply as a percent of GDP since the Federal Reserve abandoned its zero-rate policy to fight the inflation caused by excessive government spending. Making matters worse is that instead of taking advantage of the low-rate environment that had existed to extend maturities (as did many countries, individuals, and corporations), the Treasury decided to borrow at the very short end of the curve. Thus, with interest rates now much higher, the average cost of debt is set to rise significantly, with current rates much higher than the 3.3% rate as of Oct. 31, 2024.
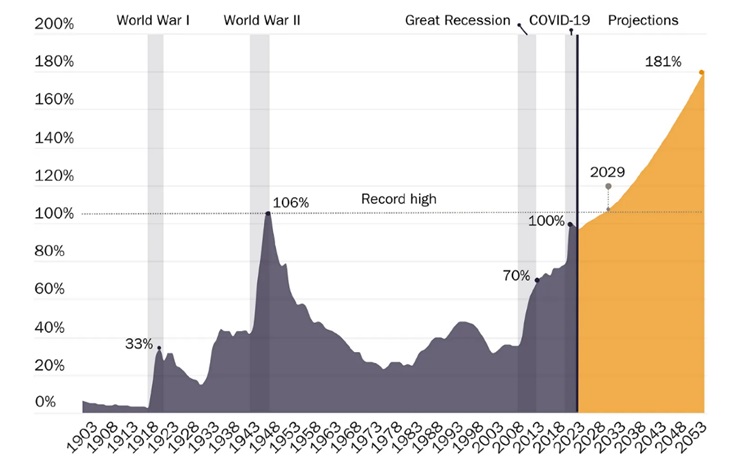
According to the Congressional Budget Office’s latest long‐term budget outlook, publicly held debt will grow from 98% to 181% of GDP by 2053. Most economic research finds that excessive public debt reduces economic growth, with dampening effects kicking in when debt reaches around 78% of GDP.
Federal Debt Held by the Public, Share of Gross Domestic Product
The Cato Institute, the libertarian think tank, says that the country’s ever-expanding debt is now an issue of national security and that entitlement reform is a necessity; the current growth rate of our debt is unsustainable. Entitlement spending is driving the unsustainable growth in federal debt. Between 2023 and 2053, total federal spending is expected to increase from 24.2% to 29.1% of GDP. That’s nearly one third higher than the 30‐year historical spending average (21% of GDP) spanning 1992-2022.
Major entitlements like Social Security and Medicare are almost entirely responsible for noninterest spending growth. In 2023, Social Security and Medicare’s combined contribution to the deficit was 2.1% of GDP. By 2053, their annual deficit contribution is expected to be 5.4% of GDP. That’s more than half or 54% of the estimated total deficit that year (assuming additional borrowing past trust fund exhaustion and no other policy changes).
The authors of the Cato Institute’s “National Security Implications of Unsustainable Spending and Debt” stated:
“Delaying responsible fiscal reforms in the face of growing federal debt invites economic and national decline. High and rising U.S. federal debt leads to suppressed private investment, reduced incomes, and increased risk of a sudden fiscal crisis. A weaker economy and growing concerns by international bondholders of U.S. Treasuries about the government’s ability and willingness to service its debt—without resorting to high inflation—will drive up interest costs and eventually impact America’s international standing negatively. … National defense is a core responsibility of the federal government. To maximize Americans’ safety and prosperity, prudence should guide both strategy and the budget. A dire fiscal crisis would erode the economic foundation of America’s strength, limiting U.S. capacity to defend its vital interests at home and abroad.”
The unsustainability of the current fiscal situation led Fitch on Aug. 1, 2023, to downgrade the US Long-Term Foreign-Currency Issuer Default Rating to AA+ from AAA. At the same time, it removed its negative watch and assigned a stable outlook. Fitch stated: “The rating downgrade of the United States reflects the expected fiscal deterioration over the next three years, a high and growing general government debt burden, and the erosion of governance relative to ‘AA’ and ‘AAA’-rated peers over the last 2 decades that has manifested in repeated debt limit standoffs and last-minute resolutions.”
It also cited the underfunding of Social Security, Medicare, and Medicaid (along with the aging population) and the lack of political will to address the problem.
While many criticized the downgrade, saying it was unnecessary, facts support the move: The US ratio of interest payments to revenue is projected by Fitch to reach 10% by 2025 compared with a 2.8% average for the other AA rated sovereigns and 1.0% for the AAA rated. The simple arithmetic will become nasty if the inflation-adjusted rate on the debt rises above the economy’s underlying growth rate, which it seems likely to do. The 2023 deficit of 6.3% of GDP is an indefensible figure when the economy is at full employment—we should be running large primary surpluses, not deficits. The problematic arithmetic of rising rates on a large stock of debt is already kicking in.
The ratings downgrade itself could result in higher interest costs on our debt due to reduced confidence in our ability to repay it. In turn, that could lead to sales of Treasury debt by foreign investors, putting upward pressure on interest rates and exacerbating the debt issue, especially if the fiscal problem is not resolved. Unfortunately, the outlook is not good, as Fitch forecasts a fiscal deficit of 6.6% of GDP in 2024 and a further widening to 6.9% of GDP in 2025. These are unsustainable levels. Another problem with rising debt/GDP levels is that they would likely limit our ability to respond to future contractions in the economy with fiscal stimulus.
In summary, estimates from econometric studies of highly indebted industrialized economies indicate that the government expenditure multiplier will be positive for the first four to six quarters after the initial deficit financing and will then turn negative after three years. This implies that a dollar of debt-financed federal expenditures eventually reduces private GDP. In other words, today’s stimulus is tomorrow’s burden. Lower economic growth has negative implications for future equity returns.
Investor Takeaways
Equity markets dislike uncertainty. The battle over the growing debt burden along with the continued threat of government shutdowns likely means there will be continued uncertainty around the problem, one that is exacerbated by the unprecedented surge in deficit spending at a time of overall growth in the economy and historically low levels of unemployment. A fierce debate will likely occur on Capitol Hill about the nation’s fiscal policies as lawmakers face a potential government shutdown again in March and choices over trillions of dollars in expiring tax cuts. Thus, equity investors should be prepared for the possibility of increased volatility.
There are two ways to address the risks of a portfolio’s volatility. The first is to reduce exposure to stocks and longer-term bonds and bonds with significant credit risks, while increasing exposure to shorter-term, relatively safe credit risks. Investors can benefit from running a Monte Carlo simulation to determine if they can lower their equity allocation, as the need to take risk in stocks has been reduced by the higher real yield available on safe bonds.
Another way to address the risks is to diversify exposure to risk assets to include other sources of risk that have had historically low to no correlation with the economic cycle risk of stocks and/or the inflation risk of traditional bonds but also have provided risk premiums. The following are alternative assets that historically have provided diversification benefits. Alternative funds carry their own risks; therefore, investors should consult with their financial advisors about their own circumstances prior to making any adjustments to their portfolio.
- Reinsurance. The asset class looks attractive, as losses in recent years have led to dramatic increases in premiums, and terms (such as increasing deductibles and tougher underwriting standards) have become more favorable.
- Private middle-market lending (specifically senior, secured, sponsored corporate debt). This asset class also looks attractive, as base lending rates have risen sharply, credit spreads have widened, lender terms have been enhanced (upfront fees have gone up), and credit standards have tightened (stronger covenants).
- Consumer credit. While credit risks have increased, lending rates have risen sharply, credit spreads have widened, and credit standards have tightened.
- Long-short factor funds.
As Kevin Grogan and I demonstrated in our book, Reducing the Risk of Black Swans, adding unique risks has historically reduced the downside tail risk associated with conventional stock and bond portfolios.
Larry Swedroe is the author or co-author of 18 books on investing, including his latest Enrich Your Future.
The author or authors do not own shares in any securities mentioned in this article. Find out about Morningstar’s editorial policies.
Larry Swedroe is a freelance writer. The opinions expressed here are the author’s. Morningstar values diversity of thought and publishes a broad range of viewpoints.

 United States