
Stock Funds Floundered in October, With Investors Opting for Bond Funds and Alternatives
Economic and political uncertainty likely shaped October’s fund flows as investors gravitated toward safety.



US funds collected $82 billion in October, which is one of their stronger showings this year and much better than their roughly $50 billion in outflows in October of last year. Investors gravitated toward safety: Equity funds floundered; fixed-income funds enjoyed strong inflows; and alternative fund flows soared. A toss-up presidential election and escalating conflict in the Middle East might have contributed to investors’ modest risk appetite.
US Fund Flows
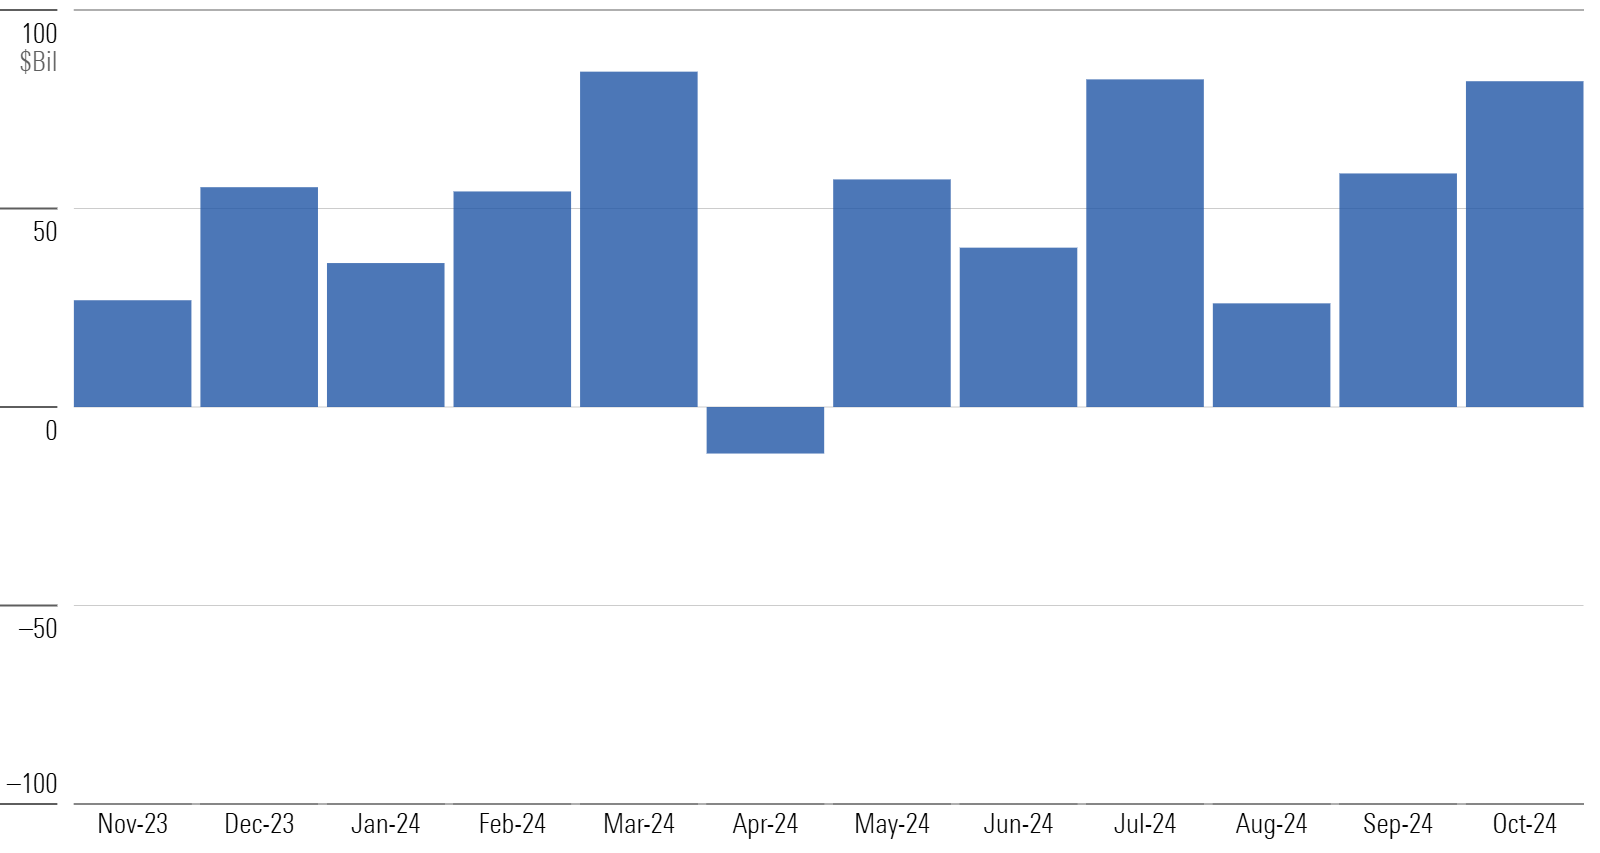
Taxable-Bond Funds Post Best Inflows in More Than Three Years
Taxable-bond funds continued their tremendous year, gathering $59 billion of inflows in October. That marked their best month since April 2021 in absolute terms and when scaled for assets. Investors have piled $413 billion into taxable-bond funds in 2024, nearly 9 times the amount of the next-closest category group.
Taxable Bond Organic Growth Rates
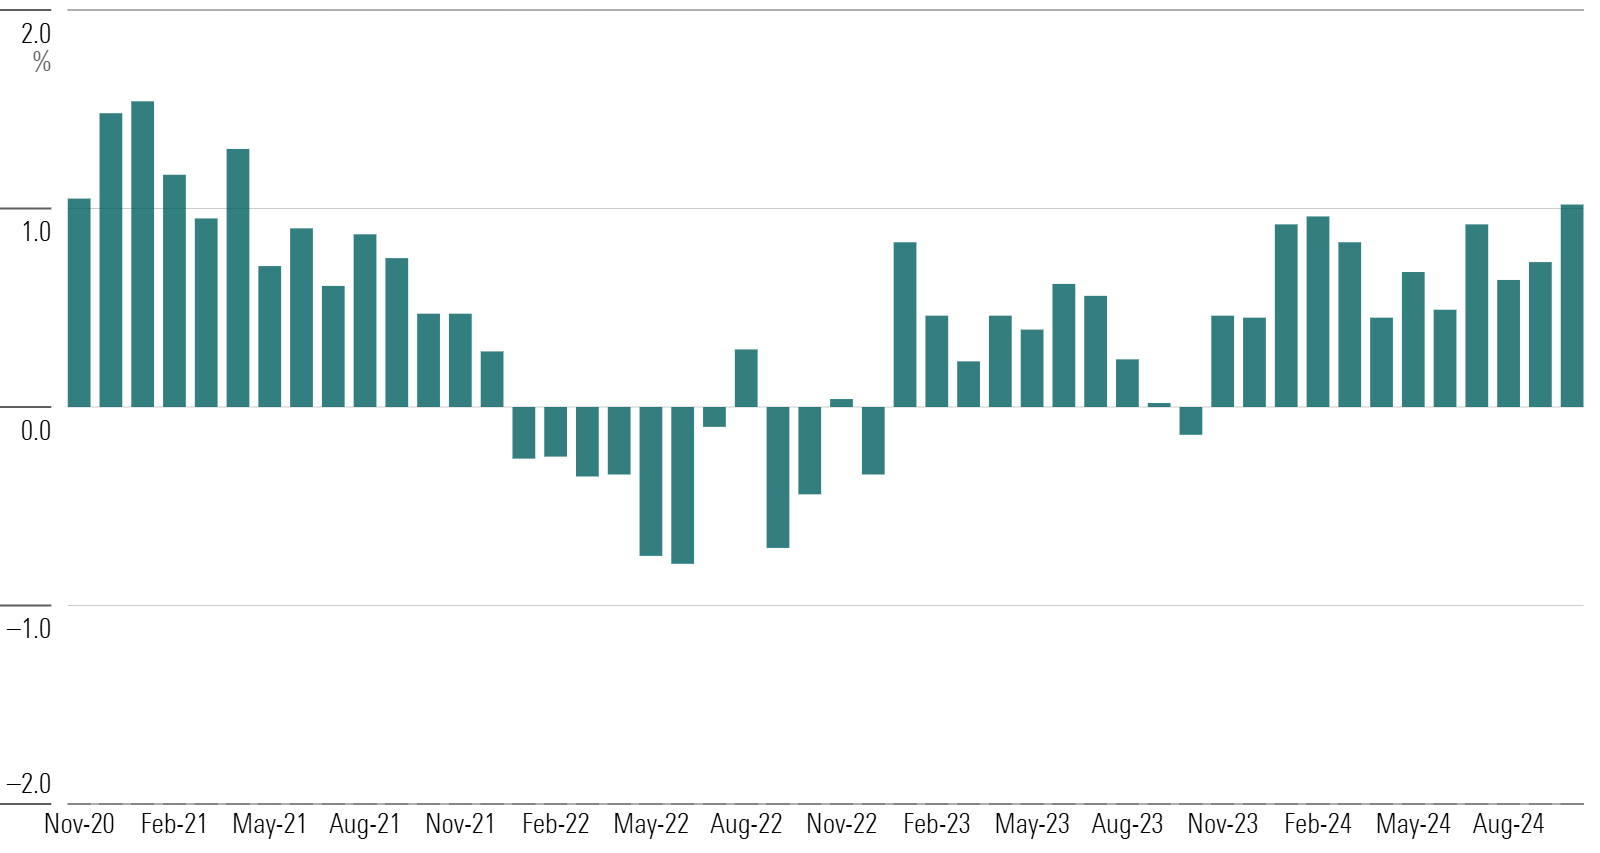
TIPS Funds’ Triumphant Return Is Shaded by Narrow Demand
Inflation-protected bond funds raked in more than $7 billion in October, an about-face from the outflows that shrank the category by more than 30% since the end of 2021. One fund drove most of the October reversal: Fidelity SAI Inflation-Protected Bond Index FSPWX. It raked in nearly $8 billion alone. It might have benefited from concerns about the growing US national deficit, an issue the presidential election pushed to the forefront.
TIPS Flows
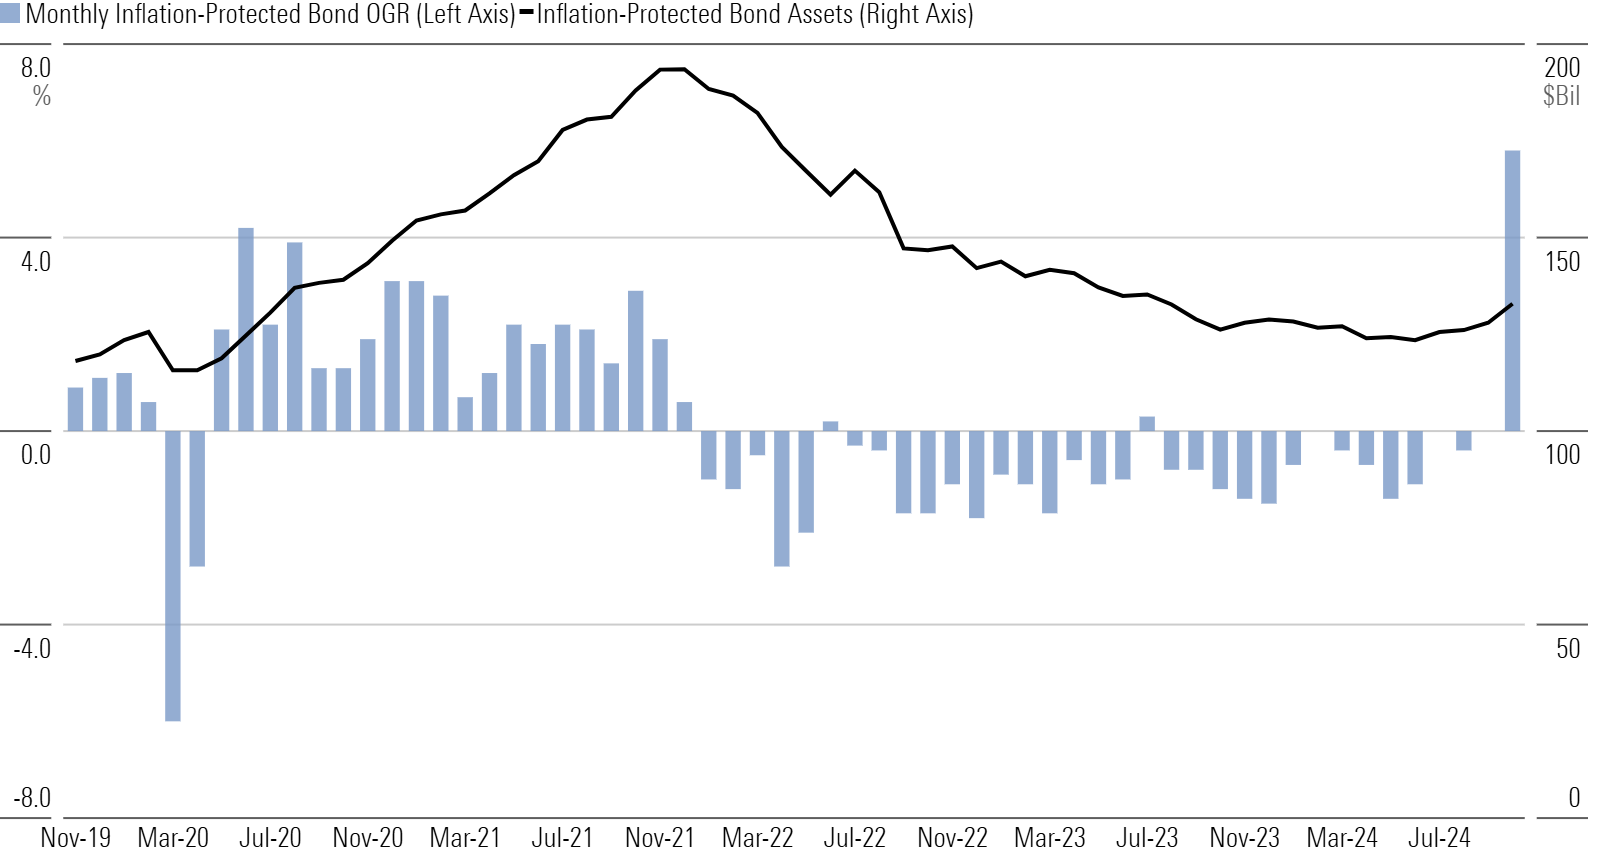
Municipal-Bond Funds Join the Party
Municipal-bond funds collected $8.5 billion in October, their best month since August 2021. More than $5 billion rushed into intermediate-term municipal-bond funds in their best month since December 2020. The election might have pushed taxes to the top of investors’ minds, helping to drive the stellar month for this cohort.
Municipal Bond Flows

A Trio of Subpar Months for US Equity Funds
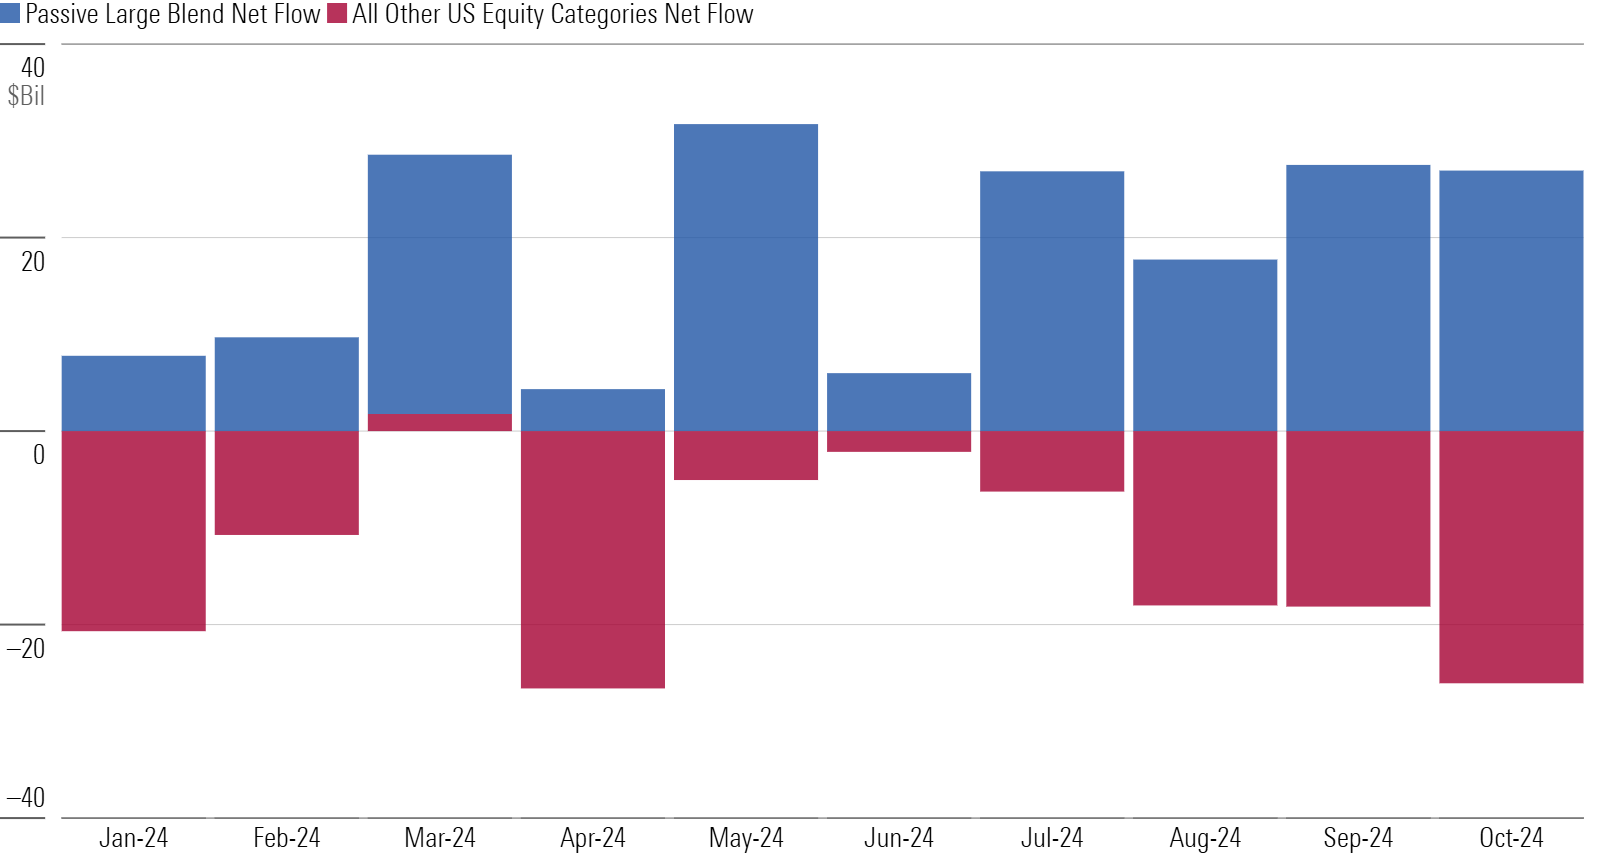
After shedding net assets in August and taking in about $10 billion in September, US equity funds collected a paltry $1 billion in October. Eight of the group’s nine categories suffered outflows, with the usual positive flows into large-blend index funds as the group’s saving grace. Passive US equity inflows roughly offset active outflows.
US Equity Flows
A Great Wall of Money Flows Into China
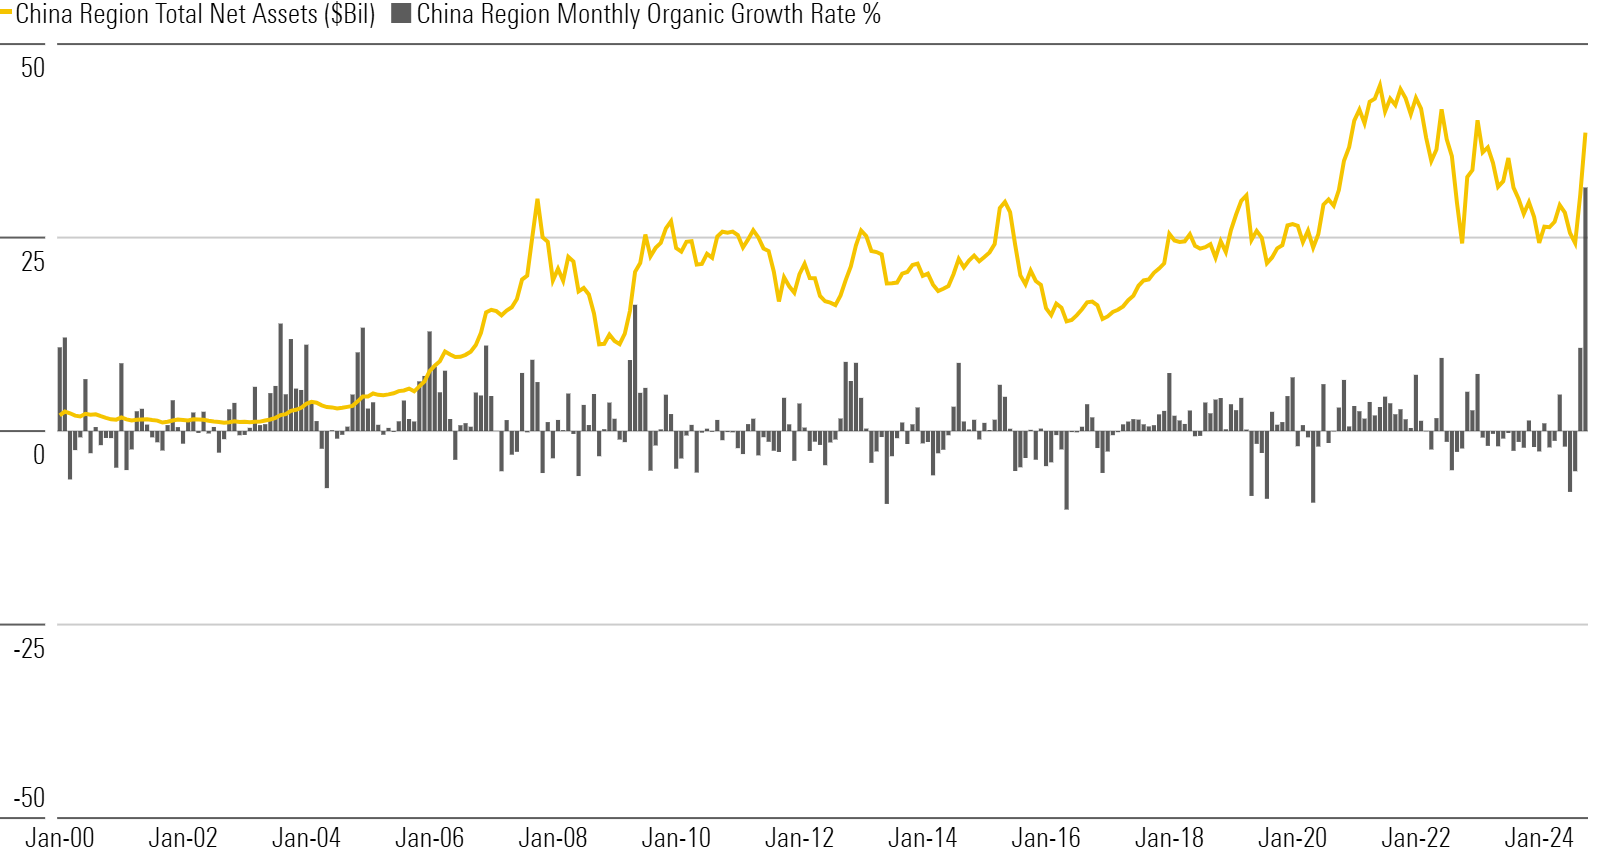
China-region funds’ $9.6 billion haul in October made September’s otherwise notable $2.6 billion inflow seem small. Never has this much money flowed into these funds on an absolute or relative basis. Passive funds took in virtually all flows: iShares China Large-Cap ETF FXI took in $5.5 billion, while Xtrackers Harvest CSI 300 China A ETF ASHR and iShares MSCI China ETF MCHI each collected over $1 billion.
China Region Flows
Growing Menu Helps Derivative-Income Flows
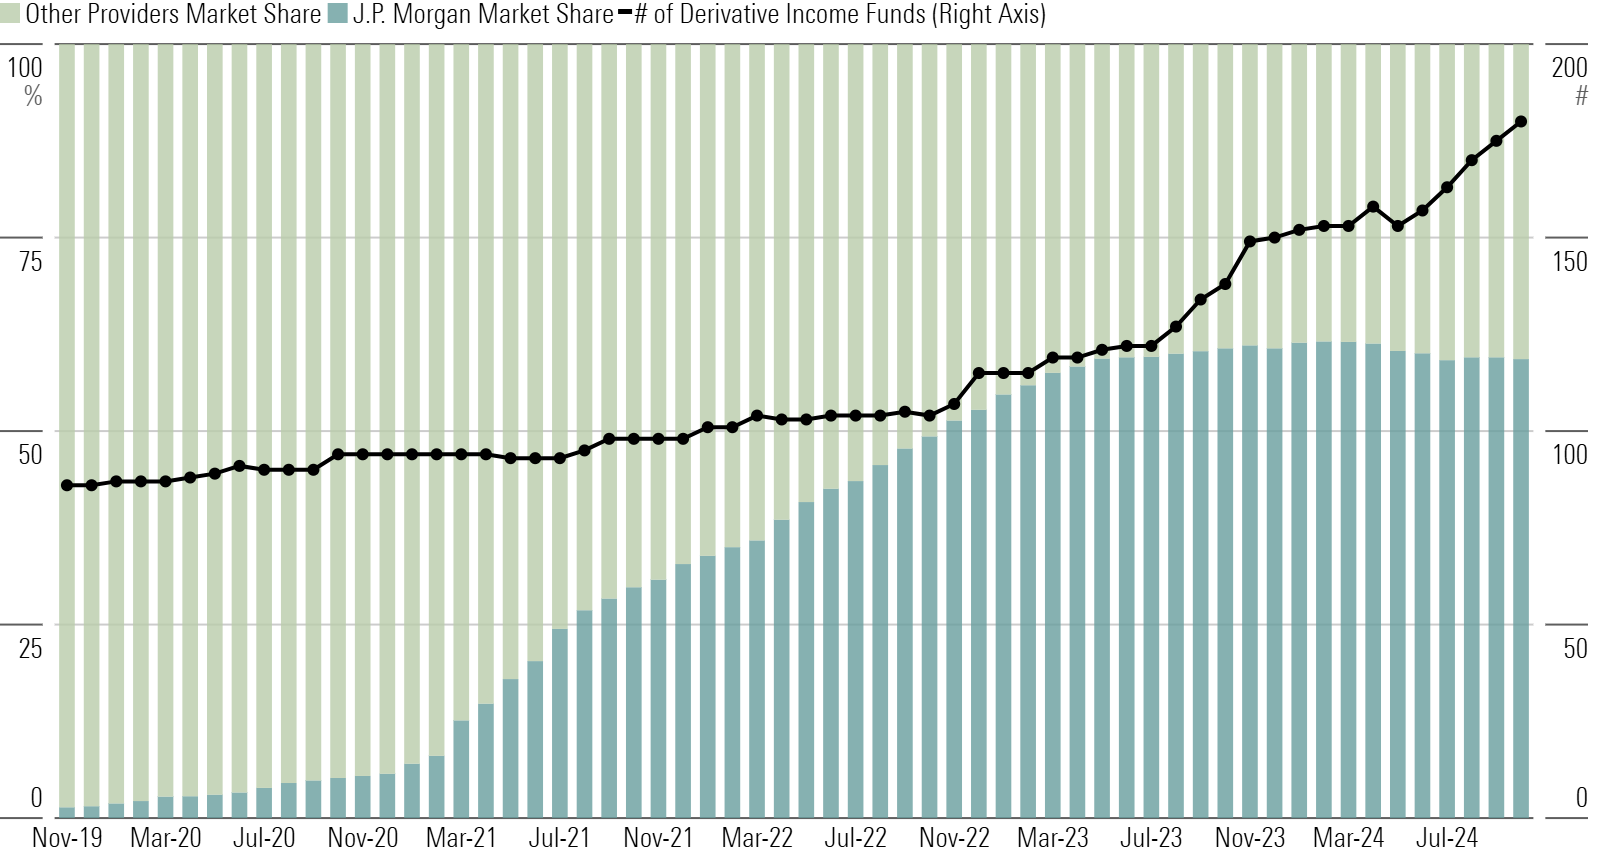
Derivative-income funds pulled in a record $3.5 billion in October. JPMorgan Equity Premium Income ETF JEPI and JPMorgan Nasdaq Equity Premium Income ETF JEPQ, the category’s two largest, led the way. That duo helped J.P. Morgan seize the derivative-income market in recent years, but flows into this space have broadened out as rival fund providers launched similar products—77 of them since the start of 2023, to be exact.
Derivative-Income Flows
This article is adapted from the Morningstar Direct US Asset Flows Commentary for October 2024. Download the full report here.
The author or authors do not own shares in any securities mentioned in this article. Find out about Morningstar’s editorial policies.

 United States