
Most Funds Are Priced to Fail
Return expectations have drifted lower, but prices haven't kept pace.
/s3.amazonaws.com/arc-authors/morningstar/550ce300-3ec1-4055-a24a-ba3a0b7abbdf.png)
Summary The average pre-fee excess returns of most U.S. stock funds have pinched lower in recent years and now sit well below the norm of the past few decades.
- Fees haven't fallen as steeply, and, thus, more than two thirds of U.S. equity funds levy annual expenses that would wipe out their estimated future pre-fee excess returns. Those funds recently held nearly $2 trillion in assets.
- Of the funds that charge less than our estimates of future pre-fee excess returns, many have little margin for error (that is, their fees are no more than 0.30% below potential future excess returns before fees).
- Fund overpricing is most rampant among U.S. large-cap funds and least widespread among U.S. small-cap funds.
- Faced with the prospect of reaping smaller pre-fee excess returns in the future, fund companies will likely have to slash expenses or mothball costly funds that are unlikely to succeed.
Study Overview Investors seeking to assess whether an active fund is worth the bother really need only two data points:
1. The fund's annual cost
2. The fund's potential future pre-fee excess returns versus the benchmark concerned
The larger the second is compared with the first, the more worthwhile an investor would consider the fund, and vice versa.
We already possess the first piece of data: the fund's annual expense ratio. To estimate the second, we compiled the rolling annualized pre-fee excess returns of every U.S. open-end fund in our database for the 10-year periods ended October 2006 through October 2016. We derived these excess returns by calculating the difference between each fund's gross annualized returns and the returns of the benchmark index assigned to its Morningstar Category, repeating for all other funds. (We used each fund's end-of-rolling-period category classification to determine which index to compare it against.)
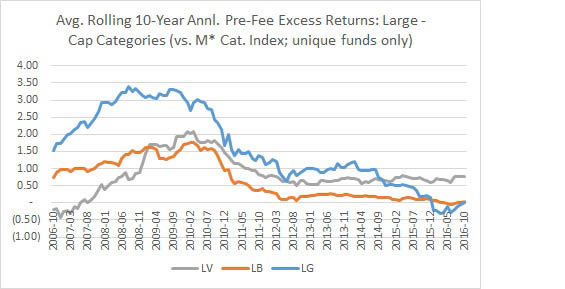
From there, we calculated category averages (again based on each fund's end-of-rolling-period classification) and formed a time series of those category averages. Those time series, in turn, gave us the ability to assess the recent level, historical trend, and range of pre-fee excess returns for each category. For example, here is the time series of the average rolling 10-year pre-fee excess returns of the U.S. large-cap categories:
Source:
Morningstar Analysts
From the above, we can observe recent level (as of Oct. 31, 2016, 0.76% for large value; 0.04% for large blend; 0% for large growth), trend (150-300 basis points lower since the global financial crisis), and range (negative 0.85% to 1.62% for large value; negative 0.04% to 1.68% for large blend; negative 0.34% to 3.51% for large growth).
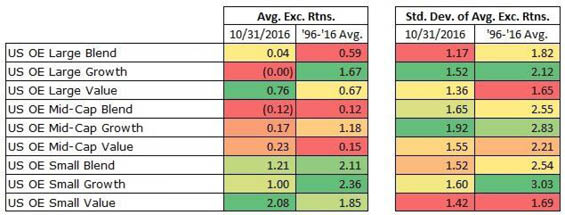
Findings We can repeat this exercise for all other categories. For example, here's a table that summarizes the most recent average pre-fee excess returns and historical average pre-fee excess returns for the major U.S. stock categories.
Source:
Morningstar Analysts
From this, we can take away a few things. First, average pre-fee excess returns have generally declined and now sit below the historical averages. Second, the standard deviation of those excess returns--that is, the variance around the mean--has fallen across the board. What that suggests is the pre-fee payoff to active management has shrunk while our ability to "bound" the range of outcomes has grown.
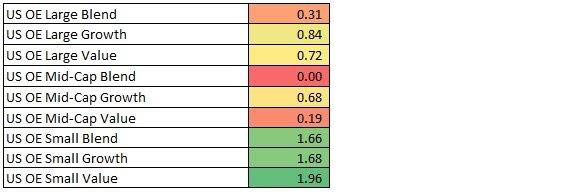
That said, we opted to adjust the latest figures. Why? Active investing has been in a deep funk, and while some of it reflects structural change ("paradox of skill," and so on), there's probably also a cyclical dimension (stylistic headwinds, returns dispersion, market trends, and so on). If we met the longer-term average halfway, here are the pre-fee excess returns we'd project:
Source
:
Morningstar Analysts
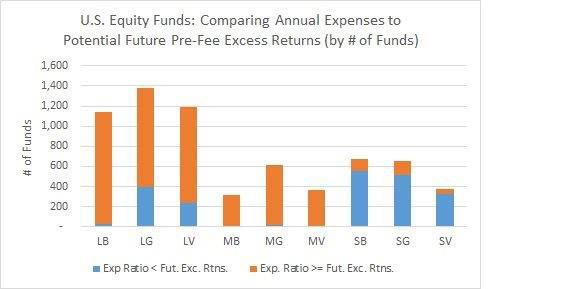
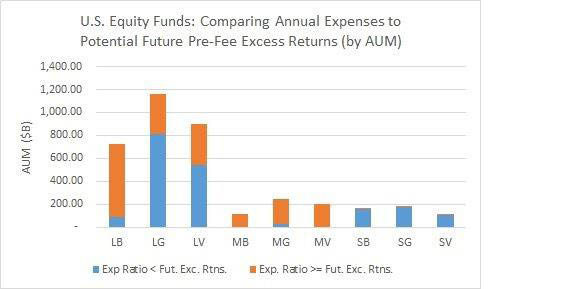
Having assembled these data, we turned our attention to assessing whether funds are priced "right" (that is, annual expenses less than potential future average pre-fee excess returns) or "wrong" (the reverse). Here's how that picture looks based on the most recent expense ratio data in our database.
Source:
Morningstar Analysts
To summarize the above, 4,635 of 6,708 active U.S. equity funds in our database were recently levying expense ratios that would wipe out their potential future pre-fee excess returns (that is, the estimates in the table above). At their current price, and assuming those estimates approximate actual pre-fee excess returns in the future, these funds would have no prayer of beating their benchmarks after fees.
How much money is sitting in these potentially overpriced active funds? $1.9 trillion, as shown below.
Source:
Morningstar Analysts
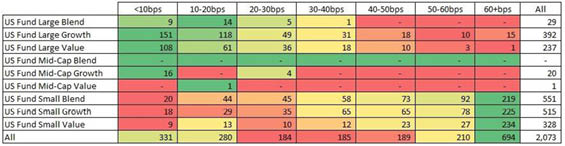
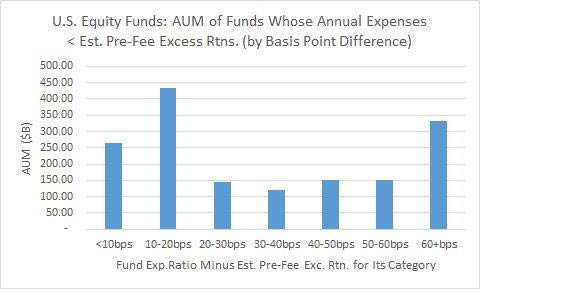
It's worth noting that, of the funds with expenses that do not exceed our estimates of future pre-fee excess returns, the margin often isn't very wide. To illustrate, the chart below breaks down these 2,073 active funds based on the differences between their expense ratios and the pre-fee excess return estimates for their categories.
Source:
Morningstar Analysts
As is evident from the table, most active large-cap funds have less than 30 basis points of breathing room (that is, their annual expenses are usually not more than 0.30% lower than our estimate of future annual pre-fee excess returns). In contrast, given their larger potential future pre-fee excess returns, it appears that most active small-cap funds have greater maneuverability and therefore would seem to represent a better bet.
Some might wonder how the results would differ if we excluded funds that levy distribution and marketing fees (that is, 12b-1 fees). In effect, this would remove some of the costliest funds from the study, leaving those that ostensibly stood a better chance of delivering positive excess returns after fees.
When we did so, we still found that the majority of funds were priced to fail: 1,773 of 3,246 levy expenses that exceed our estimates of the potential pre-fee excess returns for their categories, and those funds were recently home to more than $1 trillion in assets in aggregate. And of the funds with expenses lower than estimated potential annual pre-fee excess returns, most had 30 basis points or less of breathing room per year. All told, those more competitively priced funds held around $850 billion in assets as of Oct. 31, 2016, as shown in the chart below.
Source:
Morningstar Analysts
Conclusions Many active U.S. stock funds are too expensive to succeed. This is especially true of U.S. large-cap funds, the clear majority of which charge well more than our estimates of potential future pre-fee excess returns. All told, it appears that overpriced active U.S. equity funds (that is, those with fees exceeding likely future excess returns) still hold nearly $2 trillion in assets, and there's little margin for error among funds that are less expensive. The exceptions are small-cap funds, where it appears fees are still below estimated future pre-fee excess returns.
To succeed, expensive funds must buck the trend toward lower pre-fee excess returns and generate significant outperformance in the future. This is unlikely. Therefore, fund companies must decide between slashing fees to levels that give these funds a chance to outperform their benchmarks and mothballing them altogether.
/cloudfront-us-east-1.images.arcpublishing.com/morningstar/FGC25JIKZ5EATCXF265D56SZTE.jpg)
/d10o6nnig0wrdw.cloudfront.net/04-25-2024/t_d30270f760794625a1e74b94c0d352af_name_file_960x540_1600_v4_.jpg)
/cloudfront-us-east-1.images.arcpublishing.com/morningstar/DOXM5RLEKJHX5B6OIEWSUMX6X4.png)
:quality(80)/s3.amazonaws.com/arc-authors/morningstar/550ce300-3ec1-4055-a24a-ba3a0b7abbdf.png)