
An ETF Gained Almost 42% a Year. Its Investors Still Lost Money
Say hello to the YieldMax ETFs.


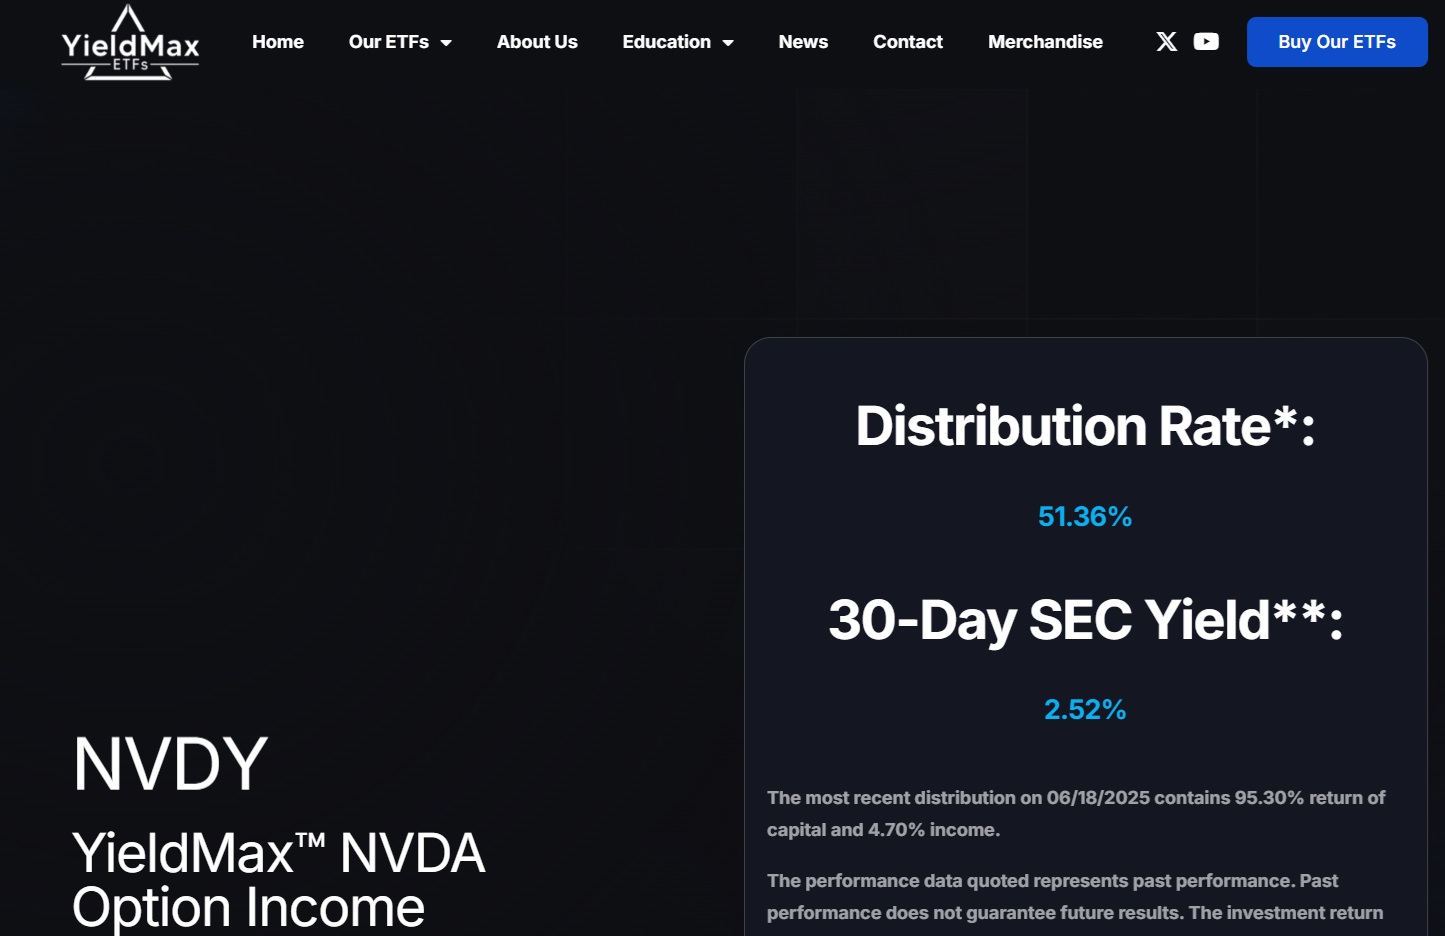
The YieldMax exchange-traded funds have earned notoriety by touting enormous yields. For instance, the first thing to greet a visitor to the web page for YieldMax NVDA Option Income Strategy ETF recently was its 51.4% “distribution rate.”
YieldMax NVDA Option Income Strategy ETF Webpage
That might not be subtle, but it seems to have worked for the manager: As of July 31, 2025, the YieldMax ETFs had drawn over $22 billion in cumulative net inflows since November 2022, which is when the first two YieldMax ETFs—YieldMax TSLA Option Income Strategy ETF and YieldMax Innovation Option Income Strategy—debuted.
YieldMax ETFs: Net Inflows by Year
Have the YieldMax ETFs worked for investors, though? It’s questionable at best.
Poor Dollar-Weighted Returns
Assuming shareholders reinvested 80% of the distributions they received, I estimate the average dollar invested in YieldMax ETFs would have lost 11.2% per year from Dec. 1, 2022, through July 31, 2025. Over the trailing one and two years ended July 31, 2025, I estimate the YieldMax ETFs earned dollar-weighted returns of 14.2% and 6.4% per year, respectively.
(These estimates can vary depending on the reinvestment rate assumed. For conservatism, I assumed 80% because it resulted in higher dollar-weighted return estimates, while acknowledging that at least some YieldMax investors are not reinvesting all of the distributions they receive. However, given this potential variation, I’ve shown the range of estimated dollar-weighted returns at various reinvestment rates in an Appendix. A YieldMax representative was not able to provide data on reinvestment rates.)
While these estimated dollar-weighted returns might look respectable in absolute terms, at least over the trailing one and two years ended July 31, 2025, they were typically far lower than the ETFs’ total returns, to say nothing of the returns of the single stocks or other ETFs those YieldMax ETFs reference.
For instance, over the trailing year ended July 31, 2025, I estimate the average dollar invested in YieldMax ETFs gained 14.2%, which would be less than half the buy-and-hold return of the ETFs themselves (30.3%) and only about a quarter of the underlying stocks’ total return over this period (53.9%).
YieldMax ETFs: Annual Investor and Total Returns
The YieldMax ETFs 8.4% aggregate annual total return over the trailing two years ended July 31, 2025 (such as the return from buying-and-holding the YieldMax ETFs that existed as of July 31, 2023, setting their initial weights in proportion to the ETFs’ net assets on that date), badly lagged the S&P 500 (19.2% per year) but with nearly three times the volatility. It stands to reason the average dollar invested in the YieldMax ETFs experienced similar volatility. But as mentioned, the average dollar earned a lower return than the ETFs did in aggregate, which would imply it had an even worse risk/reward profile.
I also estimated the dollar-weighted returns of individual YieldMax ETFs from inception through July 31, 2025, comparing those estimates with the ETFs’ total returns, again assuming shareholders reinvested 80% of their distributions.
According to my estimates, the average dollar’s return would have lagged the ETF’s at all but one of the 29 YieldMax ETFs. Moreover, the shortfall was often large, with the dollar-weighted returns of 22 YieldMax ETFs lagging the ETFs’ total returns by at least 5 percentage points per year.
YieldMax ETFs: Est. Dollar-Weighted Returns vs. Total ETF and Stock Returns
Though not shown in the chart (for scaling reasons), YieldMax MSTR Option Income Strategy ETF is an especially vivid example. I estimate that ETF earned a 38.9% annual dollar-weighted return from its Feb. 21, 2024, inception through July 31, 2025. While this is very strong in absolute terms, it pales when compared with the ETF’s 177% per-year return over that span, to say nothing of Strategy’s meteoric 246% annual gain.
Don’t Take My Word for It
Estimates aside, YieldMax’s own accounting suggests shareholders have not fared well in dollar terms.
To illustrate, here are the aggregate reported income and net gains of the YieldMax TSLA and YieldMax Innovation ETFs for the six months ended April 30 and Oct. 31 of each year from November 2022 through April 30, 2025. All told, these two ETFs lost a cumulative $112 million over this 29-month period based on figures reported in the ETFs’ annual and semiannual reports dated April 30, 2023, Oct. 31, 2023, April 30, 2024, Oct. 31, 2024, and April 30, 2025.
Operating Results: YieldMax TSLA Option Income Strategy and YieldMax ARKK Option Income Strategy
That analysis encompassed only two YieldMax ETFs so I expanded it to include the 27 other YieldMax ETFs that launched before July 31, 2024, and tallied up their aggregate reported net income and gains in the same fashion. Here’s what that picture looked like.
Operating Results: YieldMax ETFs
In total, these 29 ETFs earned around $521 million in net income and gains from November 2022 through April 30, 2025. However, most of that came from a single ETF—YieldMax MSTR Option Income Strategy—which saw about $823 million in cumulative gains compared with roughly $302 million in cumulative losses for the other 28 YieldMax ETFs. Twenty of the 29 YieldMax ETFs reported net losses in dollar terms over this period, as shown below.
YieldMax ETFs' Since-Inception Operating Results as a Pctg. of Avg. Daily Net Assets
(I’ve expressed each ETF’s reported net income and gains as a percentage of its average daily net assets from its inception through April 30, 2025. Note that the return of the YieldMax MRNA Option Income Strategy ETF isn’t shown because its net operating losses exceeded its average daily net assets.)
Those results typically fell far shy of the ETFs’ performance. To illustrate, the next chart juxtaposes the returns shown above with the ETFs’ total returns (I’ve excluded YieldMax MSTR Option Income Strategy ETF from the chart for scaling reasons; its $1.6 billion cumulative gain was equivalent to a 68%-per-year return as a percentage of its average daily net assets compared with the ETF’s 226% total return over this period.)
Comparing YieldMax ETF Operating Results With ETFs' Total Returns
Case Study: YieldMax COIN Option Income Strategy ETF
For example, YieldMax COIN Option Income Strategy ETF lost a cumulative $35.5 million from its August 2023 inception through April 30, 2025, which was equivalent to a 6.3% annual loss when measured as a percentage of its average daily net assets over that period. Yet, during that time, the ETF earned a 41.9%-per-year annual return (Coinbase stock itself rose 71% annually over that span).
How could investors have lost money in an ETF that gained nearly 42% a year? Dismal timing. The ETF surged to an 81% gain from Oct. 1 to Dec. 31, 2023. That drew investors, who pumped over $190 million into the ETF from Dec. 15, 2023, to Jan. 15, 2024. But that demand spike more or less coincided with a 20%-plus loss in the month of January 2024. That drawdown spurred $23 million in outflows in February and March 2024, during which the ETF gained 65%.
Investors responded by pouring another $700 million into the ETF over the ensuing six months ended Sept. 30, 2024. But that once again came just as the ETF’s performance was moderating—it slid to a 26% loss from April to September 2024.
YieldMax COIN Option Income Strategy ETF: Growth of $10k vs. Daily Net Flows
Similarly, from mid-November 2024 to mid-March 2025, investors shoveled another $730 million into the ETF amid resurgent returns, as the ETF rose nearly 48% from November 2024 through January 2025. But once again that was a prelude to deteriorating performance—the ETF lost 14%, 21%, and 18% in December 2024, February 2025, and March 2025, respectively.
All told, this appears to explain why the average dollar invested in the ETF lost money from its inception through April 30, 2025, while the ETF earned big gains. And although performance improved in absolute terms from May through July 31, 2025, there was still a large gap between the ETF’s 16.9% since-inception dollar-weighted annual return and the ETF’s nearly 43% per-year return over that span.
Anatomy of a Shortfall
Keep in mind that throughout this period, YieldMax COIN Option Income Strategy ETF routinely made huge distributions to shareholders. From inception through July 31, 2025, it made 23 distributions totaling $1.3 billion in aggregate, with the average distribution accounting for around 8% of the fund’s assets at the time.
YieldMax COIN Option Income Strategy ETF: Time Lapse of Monthly Distributions
While that would seem to suggest shareholders should have been able to salt away gains each month when the ETF made these distributions, that wasn’t the case. And that’s because the bulk of those distributions wasn’t income, but rather investors’ own capital being returned to them. In all, about $0.83 of every dollar the ETF distributed was return of capital.
YieldMax COIN Option Income Strategy ETF: Time-Lapse of Distributions, by Funding Source
Why would an ETF that gained almost 42% per year be unable to fund these distributions from earnings? For one, there’s the sheer size of the distributions the manager chose to declare. The average distribution accounted for 8% of the ETF’s assets at a given time, which would translate to nearly 100% of assets over a full year. Thus, for the fund to have fully funded those distributions over a year it would have had to earn the equivalent of 100% of its assets and distribute those earnings in full.
Then there’s the matter of the manager seeming to raise or lower the distribution rate in sync with the ETF’s recent total returns. To illustrate, this chart compares the YieldMax COIN ETF’s total return in the month leading up to a distribution with the change in the distribution rate that month versus the prior month. In general, higher distribution rates followed higher returns, and the opposite, when returns weakened.
YieldMax COIN Option Income Strategy ETF: CONY Return vs. Month-to-Month Chg. in Distribution Rate
| Return in a Month | Avg. Change in Distribution Rate (Percentage Points) |
|---|---|
| < -20% | -1.0 |
| -10% to -20% | -1.7 |
| -5% to -10% | 0.6 |
| 0% to -5% | -0.9 |
| 0% to 5% | 2.7 |
| 5% to 10% | 1.0 |
| 10% to 20% | 0.6 |
| > 20% | 0.2 |
While there’s nothing nefarious about this practice, we’ve already seen that the ETF’s performance tended to wrong-foot investors, who chased higher returns to their detriment. But if the manager is adjusting distribution rates based on the ETF’s recent total returns, it’s possible to envision a scenario where the advisor committed to a higher distribution rate at a time (after strong returns) the base of distributable earnings was shrinking (due to large dollar losses incurred after assets flooded in). That, too, could contribute to a shortfall.
Which brings us to the third factor: The return of capital itself. When a fund repeatedly returns capital as this ETF has, it arrests any future compounding on those assets. That’s especially pernicious in a scenario where investors have lost in dollar terms by mistiming their purchases, as it pushes out capital before it has a chance to recover. This, too, likely explains why the average dollar’s return lagged to such a large extent.
Spinning Plates
Unfortunately, it’s been commonplace for other YieldMax ETFs to seemingly overdistribute in this manner. To illustrate, here’s a breakdown of all YieldMax ETFs’ aggregate reported income and gains (losses) before fees, fees, and distributions for the fiscal years ended Oct. 31, 2023 and 2024, and the six-month period ended April 30, 2025 (excluding ETFs that incepted after July 31, 2024).
YieldMax ETFs: Breakdown of Changes in Net Assets (excluding Net Flows)
All told, the YieldMax ETFs earned a cumulative $643 million in income and gains before fees. Net of the $77 million in cumulative fees that YieldMax charged, that left at most $565 million in distributable earnings. But that sum was dwarfed by the $5.4 billion in cumulative distributions that YieldMax elected to make over this period.
That appears to explain the YieldMax ETFs’ increasingly rampant practice of returning capital. Here’s a breakdown of the YieldMax ETFs’ aggregate distributions by funding source (for example, from earnings or return of capital), bearing in mind that the figures for the six months ended April 30, 2025, are still preliminary.
YieldMax ETFs: Time-Lapse of Distributions, by Funding Source
By YieldMax’s own accounting, $4.2 of the $5.4 billion the ETFs distributed was return of capital.
When asked for comment, a YieldMax representative indicated that the firm sets distribution rates based on the reference stocks’ implied volatility at the time, with the objective of delivering total returns in the most tax-efficient manner.
Conclusion
The YieldMax ETFs conjure the image of wringing income from the volatile stocks they reference, as if drawing blood from a stone. But it appears the ETFs can scarcely support the huge distribution rates they tout from options income alone, making them reliant on appreciation of the reference stock to fund the payouts.
At times, those stocks have performed quite well and that, coupled with the ETFs’ eye-popping distribution rates, have enticed investors. But those investors have often arrived late, missing big chunks of the ETFs’ returns and in some cases incurring losses.
Because the manager appears to have ratcheted the ETFs’ distribution rates up or down in sync with recent returns, it could have placed additional pressure on the ETFs to support their payouts. Why? The asset base could be shrinking in dollar terms—due to assets flooding in as performance is reversing—at the same time the payout demands were rising.
That’s led to massive gaps between the ETFs’ distributable earnings and the payouts the managers have committed to. To plug those shortfalls, YieldMax has repeatedly returned capital to shareholders. But that has probably further sapped the assets’ earnings’ potential, as it arrests compounding, which can be especially damaging when those investments have already incurred losses.
Taken together, these factors seem to explain why investors appear to have fared so poorly in the YieldMax ETFs. By YieldMax’s own accounting, 20 of 29 ETFs lost in dollar terms from their inception through April 30, 2025. Based on my estimates, the average dollar invested in YieldMax ETFs lost money from Dec. 1, 2022, through July 31, 2025. And the ETFs’ dollar-weighted returns badly lagged their total returns, to say nothing of the underlying stocks and other ETFs they refer to, over the trailing year and two years ended July 31, 2025.
Switched On
Here are other things I’m writing, reading, listening to, or watching:
- Related: “Wish I Was Making This Up”
- My colleague Jack Shannon on the hocus-pocus of secondary fund returns
- More from Robin Wigglesworth regarding crazy swings in ARK Innovation ETF flows (and the lengths traders will go to get an IPO pop); Matt Levine had his own take
- Some folks will do anything for a view
- Oh heck yeah: HBO’s new cops-and-robbers serial Task
- Lydia Loveless and Jason Hawk (by way of Rilo Kiley): “Portion for Foxes”
Don’t Be a Stranger
I love hearing from you. Have some feedback? An angle for an article? Email me at jeffrey.ptak@morningstar.com. If you’re so inclined, you can also follow me on Twitter/X at @syouth1, and I do some odds-and-ends writing on a Substack called Basis Pointing.
Appendix
Here are the estimated dollar-weighted returns of the YieldMax ETFs at various assumed reinvestment rates over the trailing year and two years ended July 31, 2025, as well as the Nov. 30, 2022, to July 31, 2025 period.
| Assumed Reinv. Rate | Trailing 1 Year | Trailing 2 Years | Since Nov. 30, 2022 |
|---|---|---|---|
| 0% | -44.3% | -36.7% | -50.9% |
| 10% | -38.9% | -32.3% | -46.9% |
| 20% | -33.0% | -27.6% | -42.6% |
| 30% | -26.6% | -22.7% | -38.1% |
| 40% | -19.7% | -17.5% | -33.3% |
| 50% | -12.2% | -12.0% | -28.2% |
| 60% | -4.1% | -6.2% | -22.8% |
| 70% | 4.7% | 0.0% | -17.2% |
| 80% | 14.2% | 6.4% | -11.2% |
| 90% | 24.4% | 13.2% | -4.9% |
| 100% | 35.5% | 20.4% | 1.8% |
Correction: We corrected the chart titled “Operating Results: YieldMax ETFs” and the descriptive paragraph that followed it. Originally, that paragraph stated that YieldMax MSTR Option Income Strategy ETF saw about $1.6 billion in cumulative gains from November 2022 through April 30, 2025 and the other 28 YieldMax ETFs incurred $1.1 billion in cumulative losses over that period. The YieldMax MSTR Option Income Strategy ETF reported $823 million in cumulative gains from November 2022 through April 30, 2025 while the other YieldMax ETFs incurred $302 million in cumulative losses. Also, the x-axes in “YieldMax ETFs' Since-Inception Operating Results as a Pctg. of Avg. Daily Net Assets” and “Comparing YieldMax ETF Operating Results With ETFs' Total Returns” were updated to change the ticker NVLY to NVDY.
The author or authors do not own shares in any securities mentioned in this article. Find out about Morningstar’s editorial policies.

 United States