
An Introduction to Morningstar’s ETF Index Tracking Analysis Notebook
/s3.amazonaws.com/arc-authors/morningstar/a90ba90e-1da2-48a4-98bf-a476620dbff0.jpg)

Index portfolio management is a game of inches. Portfolio managers’ objective is to track their benchmarks as closely as possible. The ETF Index Tracking Analysis notebook in Direct Analytics lab allows Direct users to assess the quality of portfolio management for index-tracking exchange-traded funds. Here, I will use a side-by-side comparison of two ETFs underpinned by the S&P 500 index--SPDR S&P 500 ETF (SPY) and iShares Core S&P 500 ETF (IVV)--to demonstrate the notebook’s capabilities.
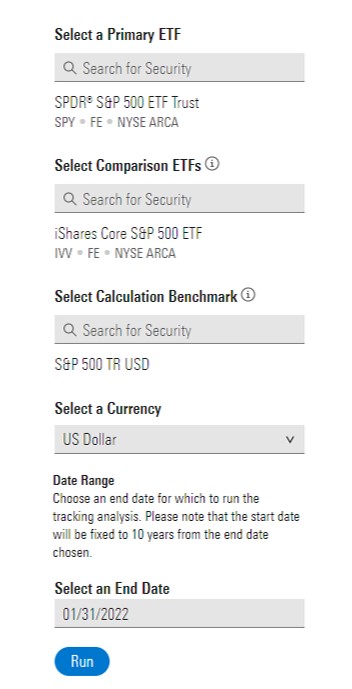
Where Do We Begin? When they launch the ETF Index Tracking Analysis notebook in Direct Analytics Lab, users can select a primary ETF by clicking into the search box under "Select a Primary ETF" and entering the ETF's name or ticker. Here, I've selected SPDR S&P 500 ETF (SPY) as the primary ETF.
Next, users can select up to 10 comparison ETFs by entering the names or tickers into the search field under "Select Comparison ETFs."
Once users have selected comparison ETFs, they can also select a calculation benchmark. The calculation benchmark will automatically default to the prospectus benchmark for the primary ETF, but users have the option to select a different calculation index (or ETF proxy).
The “Select a Currency” drop-down menu allows users to pick a calculation currency of their choosing.
Finally, users must enter an end date in MM/DD/YYYY format in the “Select an End Date” field. As is noted above that field, the beginning of the calculation window will be fixed to a date 10 years prior to the chosen end date.
Once you’ve entered an end date, click the blue Run button.
- source: Morningstar Analysts
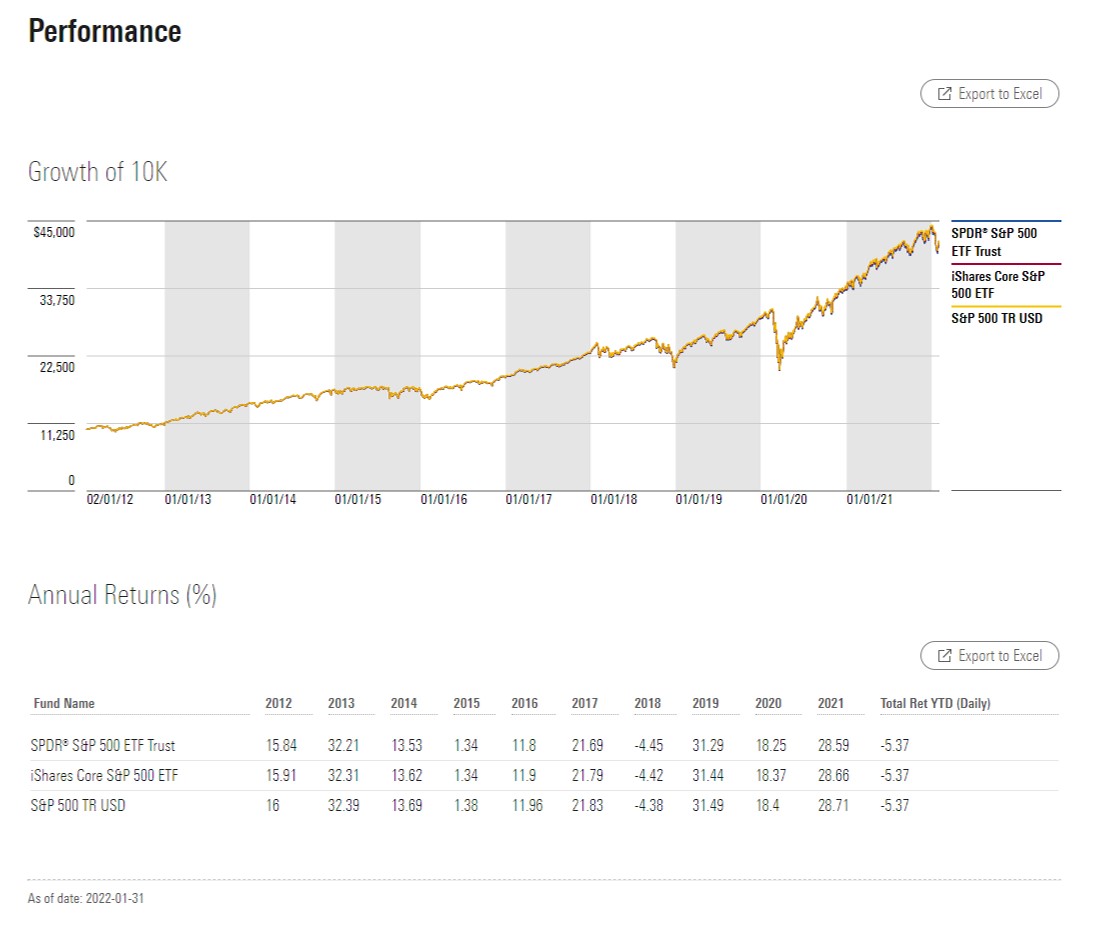
What Am I Looking at Here? Once the notebook has run, it will serve users a table featuring key information and statistics for the selected ETFs. This data, along with the data in any of the tables that appear throughout the notebook, can be exported directly to Microsoft Excel by clicking the Export to Excel button in the upper right-hand corner of the table or graph. Below the "Key Statistics" table, users will find summary performance information for the funds they've selected, including a "Growth of 10,000" chart and calendar-year returns.
- source: Morningstar Analysts
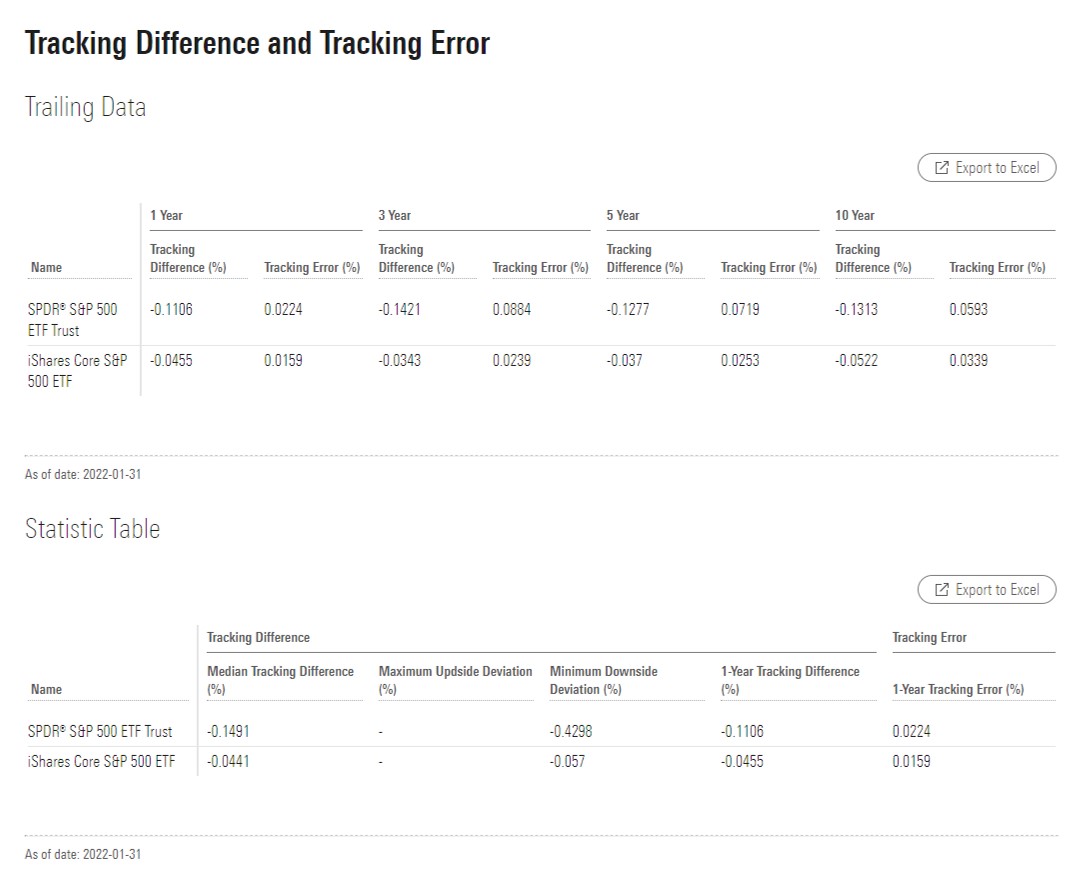
The Star of the Show Below the summary performance information, users will find a pair of tables showcasing a snapshot of tracking performance statistics for the ETFs they selected. The "Trailing Data" table includes tracking difference and tracking error (see our methodology for full details on how we've calculated these figures and how to interpret them) figures for the trailing one-, three-, five-, and 10-year periods (when available). The "Statistic" Table contains more detailed information regarding the funds' tracking difference for the year ended on users' selected end date.
- source: Morningstar Analysts
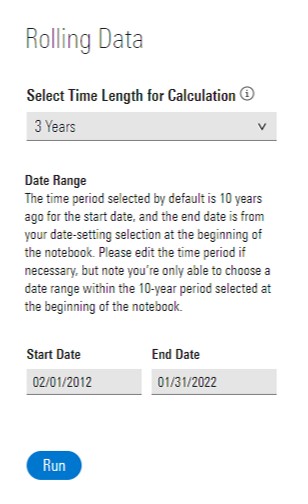
Stay on Target The pair of tables in the "Tracking Difference and Tracking Error" section provide a useful snapshot. But ETFs' tracking performance can vary over time, owing to a variety of factors. Some of those factors are more stable and predictable, like fees. Others are more volatile, like market conditions. Rolling calculations can shine a light on the forces that influence ETFs' ability to hug their benchmarks.
Under “Rolling Data,” users can select the length of the rolling periods they would like to analyze, choosing one-, three-, five-, or 10-year rolling windows from the drop-down menu. Users can then select a start and end date of their choosing. As was the case with the first menu, the end date will default to the most recent month end and the start date to 10 years prior. Once users make their start- and end-date selections, they can click the blue Run button.
- source: Morningstar Analysts
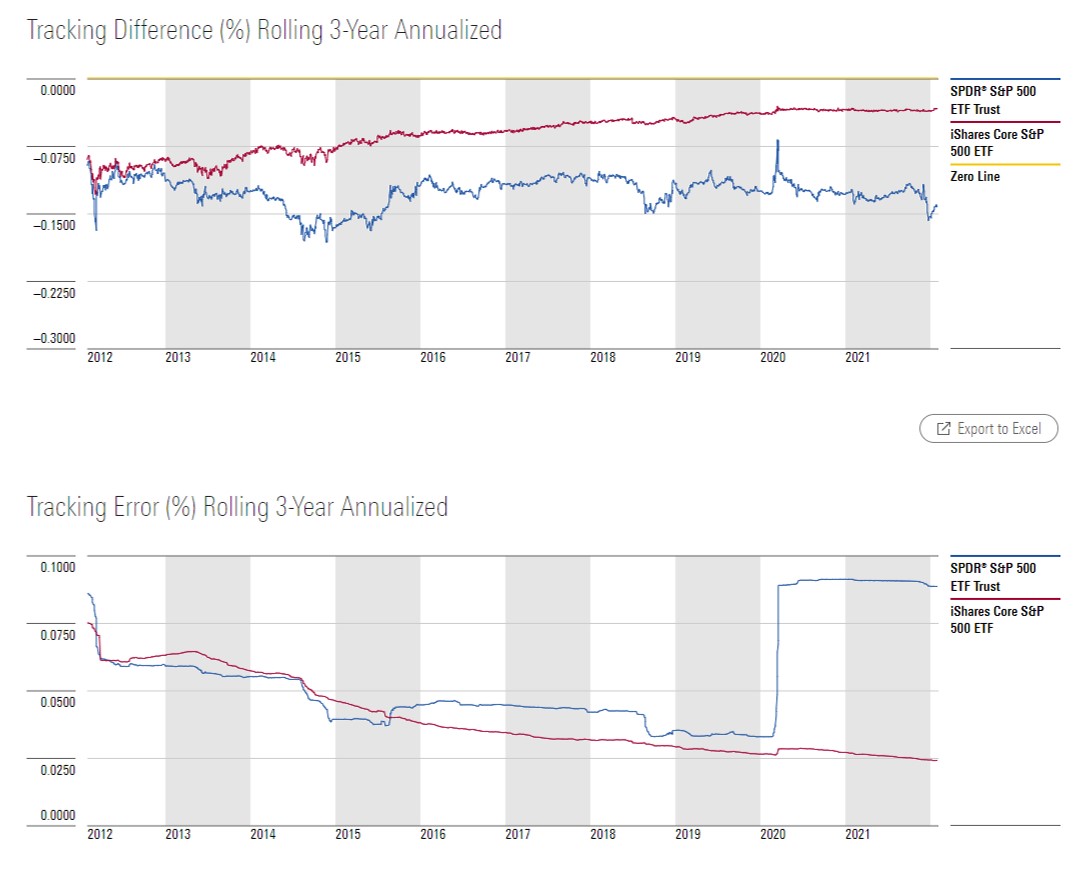
Now We're Rolling Clicking Run produces a pair of plots. The first shows the selected funds' tracking difference on a rolling three-year basis. The second shows their rolling three-year tracking error.
In this example, iShares Core S&P 500 ETF’s tracking difference has hewed closely to the fund’s expense ratio over time. (Selected ETFs’ current fees are featured in the “Key Statistics” table.) The fund reduced its annual fee to 0.07% from 0.09% in October 2012, to 0.04% from 0.07% in late 2016, and to 0.03% from 0.04% in mid-2020. The fact that its tracking difference has almost precisely equaled its fee over the past 10 years is evidence of high-quality index portfolio management.
On the other hand, SPDR S&P 500 ETF’s tracking difference has generally been greater than what can be explained by its 0.0945% fee and somewhat volatile. This can be largely explained by the fact that the SPDR ETF is structured as a unit investment trust. As such, it cannot reinvest dividends before paying them out to shareholders, nor can it lend stocks from its portfolio to generate additional revenues for the fund to help offset the drag created by its fee and other portfolio management frictions. This structural disadvantage relative to the iShares fund (which is a traditional 1940 Act mutual fund) explains the SPDR ETF’s tracking troubles.
The impact of cash drag on the SPDR ETF’s performance is most evident during moments of pronounced market volatility. For example, during the coronavirus-induced sell-off from February through March 2020, the SPDR ETF’s cash holdings had a positive impact on the fund’s tracking performance. Its cash balance helped the fund hold up slightly better as the market went down. This explains the sharp uptick in the fund’s three-year annualized tracking difference--coinciding with the market’s drawdown, as seen in the first plot below. Also, the combination of cash drag and pronounced volatility during this period resulted in larger daily tracking differences (both positive and negative). This translated to a spike in the fund’s three-year annualized tracking error, which is immediately apparent in the second plot below.
- source: Morningstar Analysts
/cloudfront-us-east-1.images.arcpublishing.com/morningstar/24UPFK5OBNANLM2B55TIWIK2S4.png)
/d10o6nnig0wrdw.cloudfront.net/04-25-2024/t_29c382728cbc4bf2aaef646d1589a188_name_file_960x540_1600_v4_.jpg)
/cloudfront-us-east-1.images.arcpublishing.com/morningstar/T2LGZCEHBZBJJPPKHO7Y4EEKSM.png)
:quality(80)/s3.amazonaws.com/arc-authors/morningstar/a90ba90e-1da2-48a4-98bf-a476620dbff0.jpg)