
7 min read
Past Performance Is Still Not a Promise—Here’s What Predicts Mutual Fund Success
A Morningstar analysis of nearly 11,500 active funds reveals which factors may be more effective at identifying future outperformers.

Investors have heard the disclaimer for decades: Past performance does not guarantee future results. Yet when it comes time to select a mutual fund, many still reach for the track record. Our research suggests that other signals may carry more useful information.
The full Persistence in European Mutual Fund Performance report examines nearly 11,500 Europe-domiciled active funds representing approximately 4.6 trillion euros in assets as of December 2025. We studied whether funds that ranked near the top or bottom of their categories tended to maintain their positions.
The results offer a practical reframe for advisors when evaluating the funds in client portfolios.
Top Performers Rarely Sustain Their Edge
A common approach to assessing performance persistence is to identify the leading funds within a category and assess whether they continue to outperform in subsequent years. We apply this approach to actively managed mutual funds and ETFs, identifying those in the top 20% of their category and whether they continued to rank in the top quintile over the next three years.
Performance quintiles reflect all funds within each category, but the analysis focuses on active funds only.
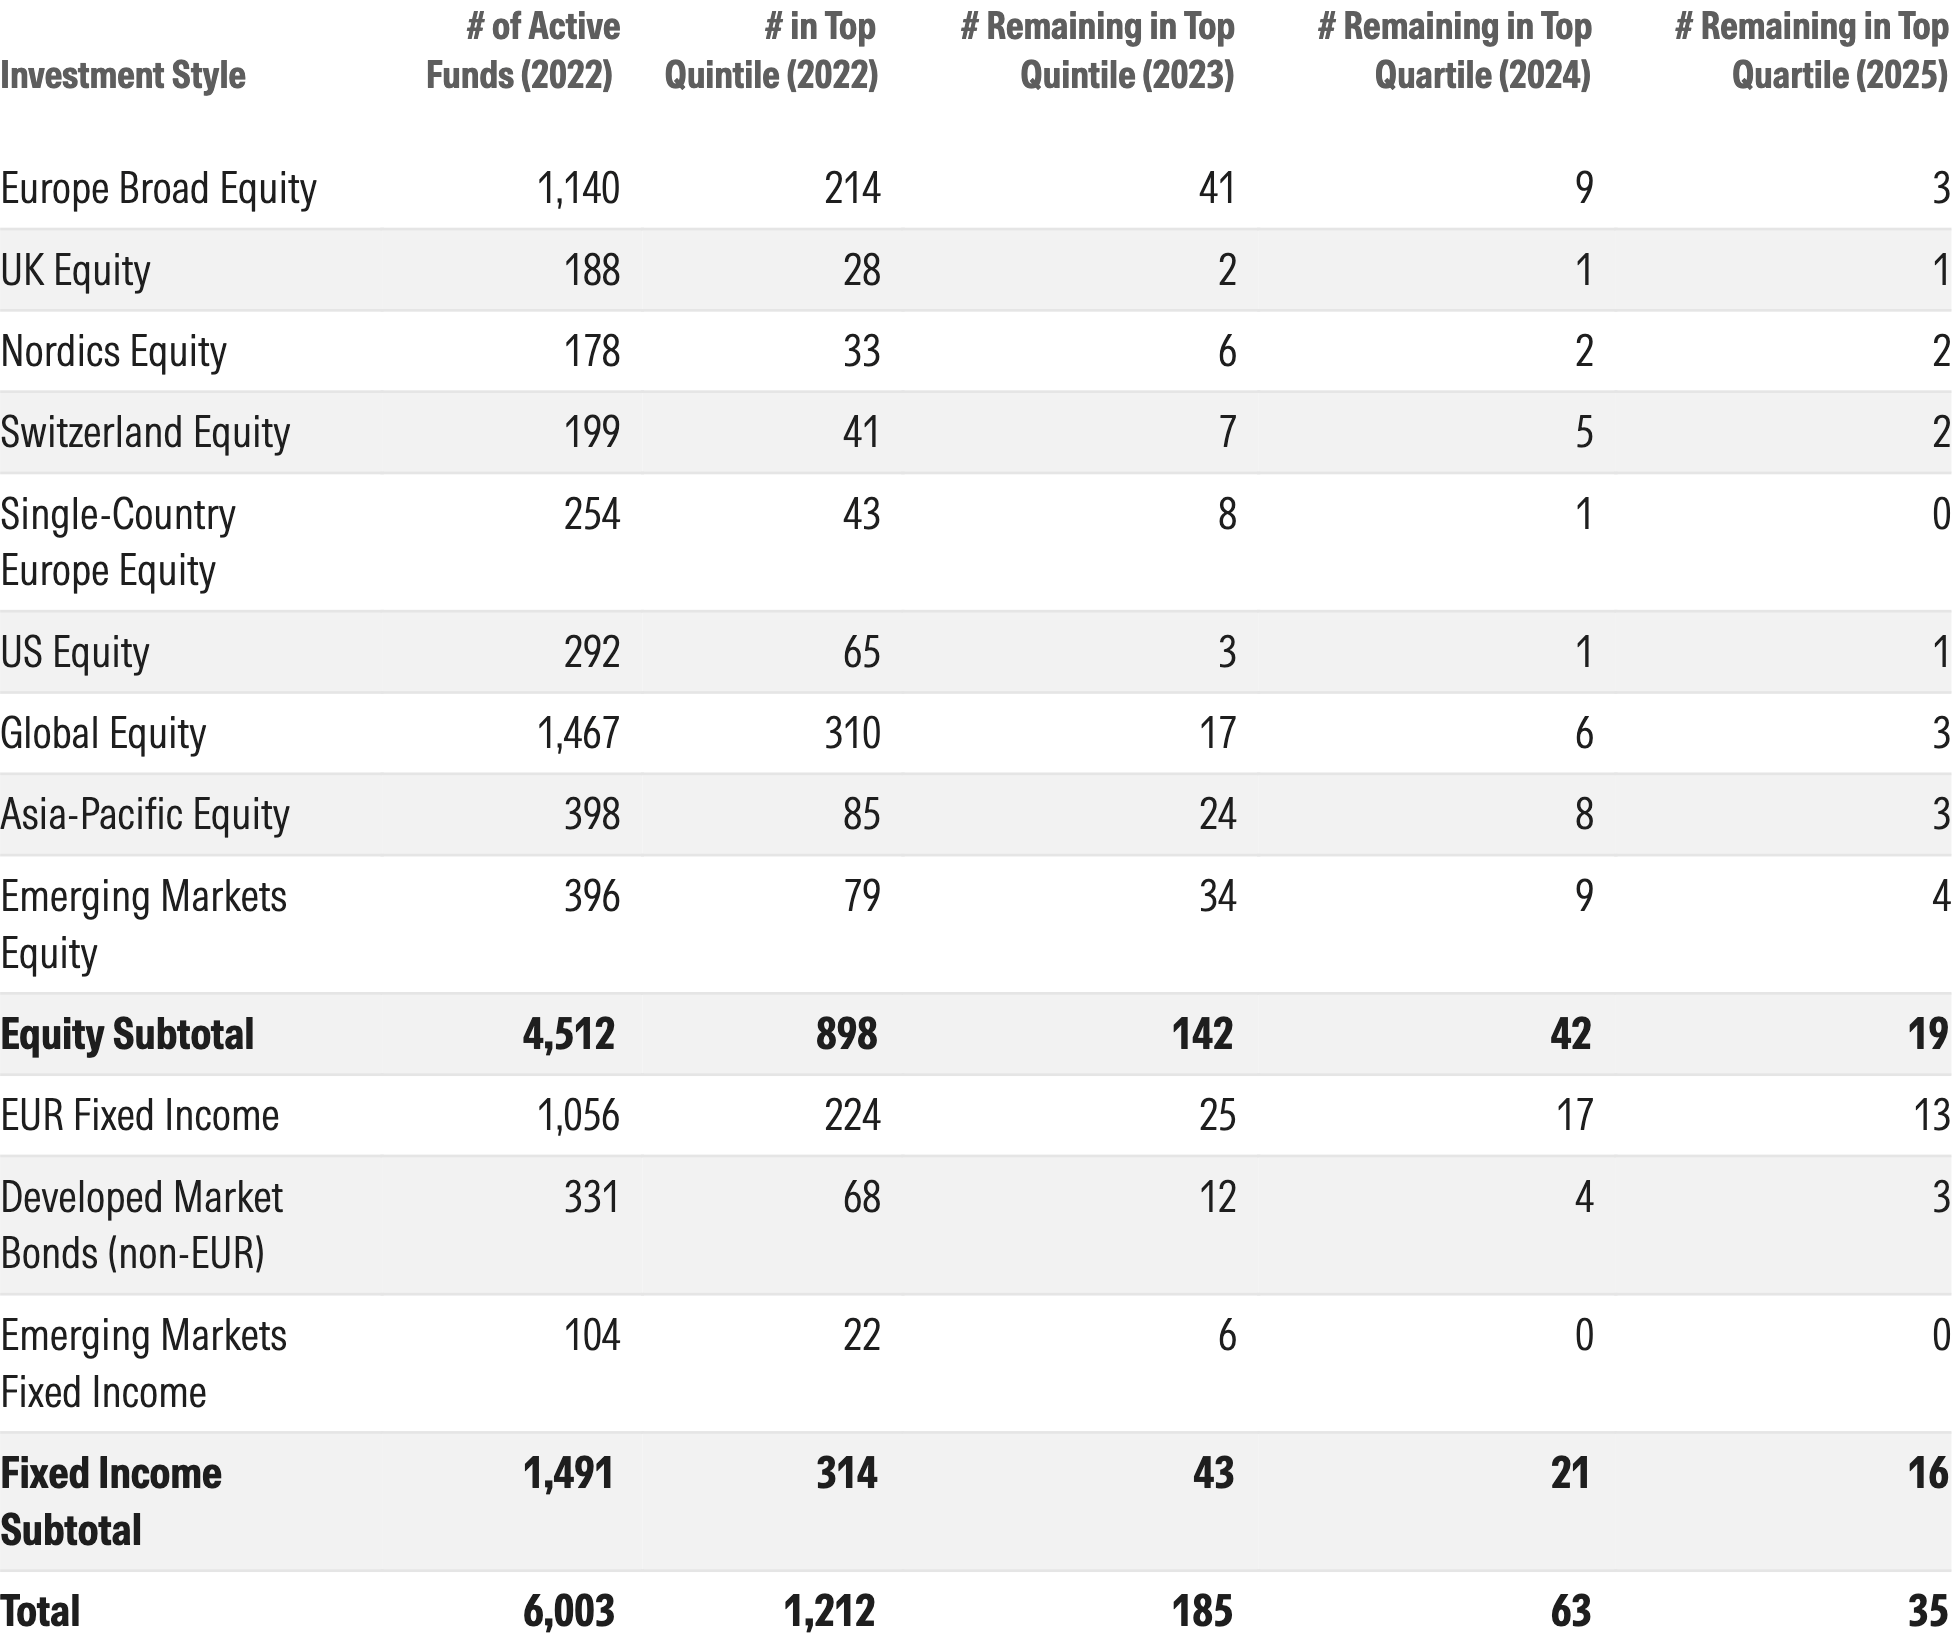
Of the 6,003 active funds tracked in 2022, 1,212 ranked in the top quintile of one-year performance in their respective categories. Only 35 remained in the top quintile in each subsequent year through 2025, representing just 0.6% of the overall fund sample.
Even over a one-year period, only 15.2% of top-performing funds maintained their position in 2023.
Persistence Scorecard: One-Year Persistence of Actively Managed Funds
Source: Morningstar Direct. Data as of Dec. 31, 2025.
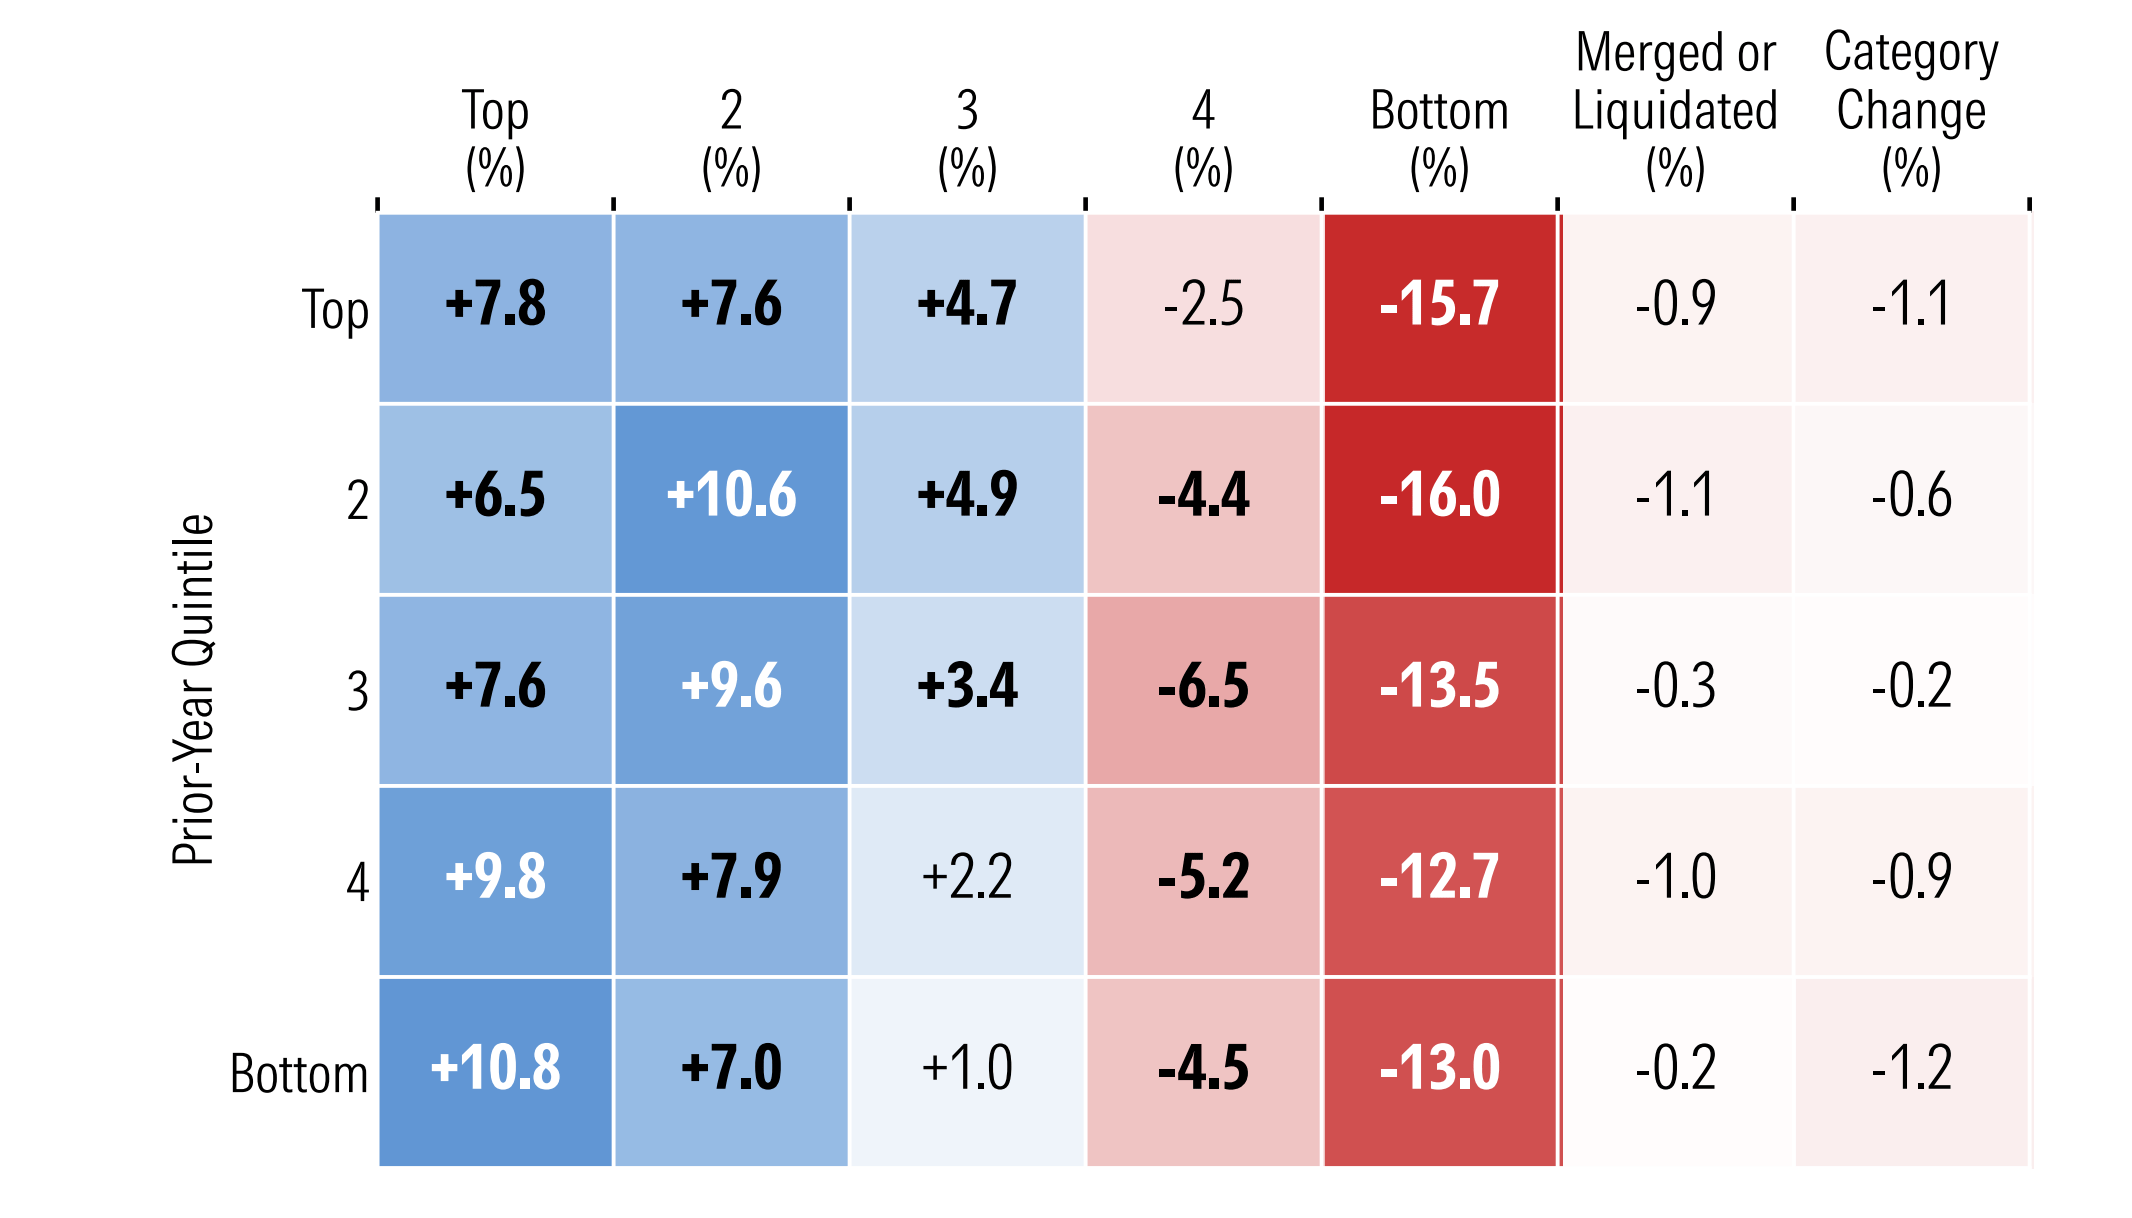
To assess persistence more broadly, we analyze how funds move between performance quintiles from one year to the next. If outcomes were purely random, funds would have roughly equal chances of landing in any quintile.
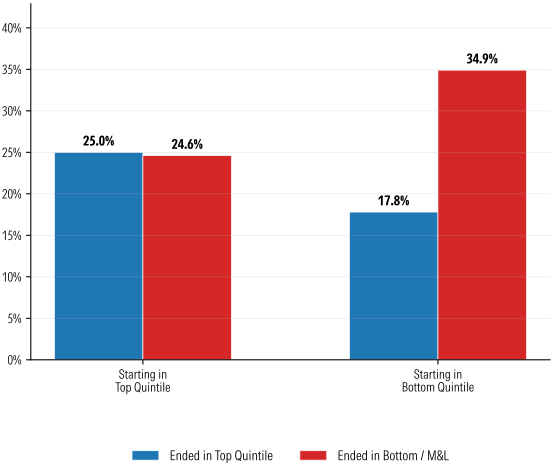
On average, one in four top-performing funds stay at the top the following year. The odds of that same fund falling to the bottom quintile, being merged, or liquidated within a year are nearly identical at 24.6% combined.
In other words, a fund's strong prior-year performance tells you little about whether it will be a strong performer or a poor one the following year.
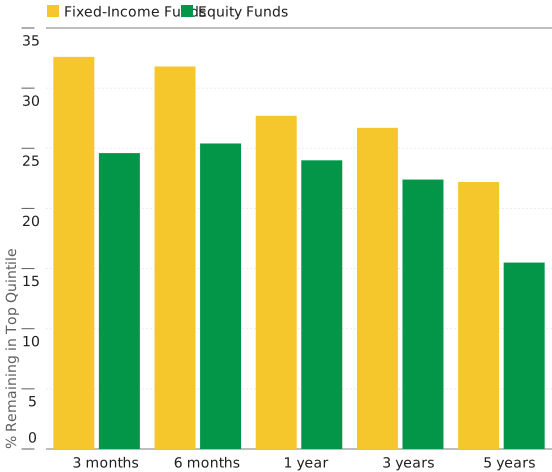
The picture dims further over longer horizons. In equity funds, the likelihood of remaining in the top quintile declines sharply over longer horizons. Fixed-income funds hold up better—their persistence remains meaningfully above chance even over a five-year horizon—but the trend is the same.
The data also show that top performance persistence tends to erode during periods of market stress. Following the sharp increase in the VIX in early 2020, used here as a proxy for market volatility, the probability of remaining in the top quintile dropped from above 40% to around 15%.
Higher levels of market volatility tend to be associated with lower persistence, a meaningful relationship that advisors should factor into how they interpret recent outperformance during turbulent stretches.
Active Funds Performance Persistence Over Various Horizons
Source: Morningstar Direct. Data as of Dec. 31, 2025
Poor Performance Is the Stickier Signal
When mergers and liquidations are factored in, bottom-quintile funds are roughly twice as likely to remain poor or exit the market as they are to rebound.
That asymmetry has implications for portfolio construction. Avoiding persistently underperforming funds may be a more actionable and reliable strategy than chasing persistent outperformers.
Transition Probabilities of Consistent Top and Bottom Performance
Source: Morningstar Direct. Data as of Dec. 31, 2025.
The One Factor That Holds Up: Fees
If past performance is a weak predictor, cost proves remarkably durable.
Low-cost active equity funds—those in the cheapest 20% of their category—have a 25.9% probability of remaining in the top performance quintile from one year to the next. Their counterparts in the most expensive 20% have a 18.1% probability of staying in the top quintile, a gap of 7.8 percentage points.
The spread at the bottom is even wider. Expensive funds have a 13.0-percentage-point higher probability of remaining in the lowest quintile than cheap funds. Across both equity and fixed-income categories, the pattern is consistent and monotonic: Lower costs are associated with better relative outcomes at every starting point in the performance distribution.
Differences in 1-Year Persistence: Cheap Minus Expensive Active Equity Funds
Source: Morningstar Direct. Data as of Dec. 31, 2025.
The fee effect compounds over longer periods. Over successive three-year windows, the average probability of consistently poor performance is 21.7 percentage points higher for expensive fixed-income funds than for their low-cost counterparts.
This aligns with a longstanding body of Morningstar research identifying fund costs as among the most reliable predictors of future investor outcomes—and it underscores the practical case for making fees a primary screen.
Risk-Taking, Not Skill, Often Explains Mutual Fund Persistence
When performance does persist, it frequently reflects a fund's exposure to rewarded risk factors rather than repeatable manager skill.
In equity funds, top-quintile persistence tracks closely with momentum returns, with a correlation exceeding 60%. Funds that ranked highly in a given year often did so in part because they held momentum-oriented stocks—securities that had already outperformed and continued to do so in the near term. That also helps explain weaker persistence in volatile markets, when momentum strategies are more prone to sharp reversals.
One-Year Persistence Probabilities and Momentum Returns
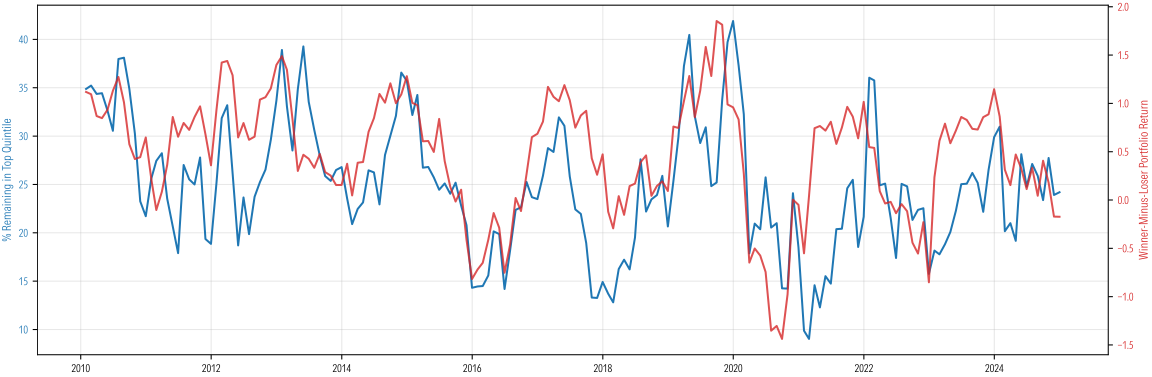
Source: Morningstar Direct. Data as of Dec. 31, 2025. Momentum returns are from Kenneth French Data Library
In fixed-income funds, the parallel dynamic is reach-for-yield behavior where funds can increase expected income, and often near-term returns, by holding higher-yielding bonds rather than safer, lower-yielding securities.
Mutual funds sorted into the highest-yield-to-maturity quintile are about 15 percentage points more likely to remain in the top performance quintile than funds in the lowest-yield quintile. That is economically large—and it reflects not skillful portfolio construction but a deliberate tilt toward higher-risk bonds. A higher yield is compensation for credit, liquidity, or duration risk, not evidence of manager insight.
For advisors, the implication is practical: When a fund's performance looks persistent, it is worth asking whether that persistence reflects genuine selection skill or simply a stable factor tilt that could reverse quickly in an adverse environment.
Other Factors That Predict Persistence
Beyond fees, several fund characteristics show measurable effects.
- Larger funds and those attracting stronger investor demand are more likely to sustain strong performance.
- Single-manager funds show lower top-quintile persistence and higher rates of bottom-quintile stickiness compared with team-managed vehicles.
- Funds rated High or Above Average on the Morningstar Process Pillar exhibit significantly stronger persistence at the top of the distribution.
Differences in 1-Year Persistence, High Minus Low: Active Equity Funds
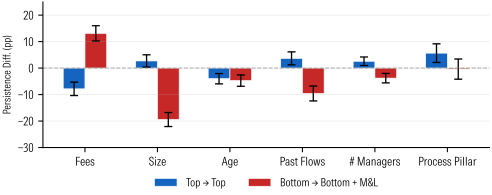
Source: Morningstar Direct. Data as of Dec. 31, 2025.
Competitive dynamics also matter. Performance persistence is stronger in categories where assets are concentrated among a small number of fund families, and weaker in more fragmented categories or those where active managers find it more difficult to outperform index funds.
A 10-percentage-point increase in a category's annual success rate—defined as the share of active funds that survive and outperform their average passive peer—is associated with a 1.8-percentage-point increase in the probability of top-quintile persistence. The more competitive the environment, the harder it is for any fund to sustain an edge.
What Advisors Should Take Away
For financial advisors working with clients who naturally gravitate toward recent winners, this report offers a clear reframe.
Fees matter more than recent returns. Fees are a particularly important signal. Manager structure and process ratings also provide meaningful information. In the absence of clear evidence of persistent skill, the more useful question to ask about any fund may not be where it has been, but whether its performance can be explained by compensated risks that advisors and clients are consciously willing to bear.. And in the absence of clear evidence of persistent skill, the more useful question to ask about any fund may not be where it has been, but whether its performance can be explained by compensated risks that advisors and clients are consciously willing to bear.
Our analysis is based on data from Morningstar Direct. Start your free trial to explore the data, evaluate funds, and access the same research tools used by Morningstar analysts.