
What Drives ETFs' Premiums and Discounts?
There are three key factors at play.
/s3.amazonaws.com/arc-authors/morningstar/a90ba90e-1da2-48a4-98bf-a476620dbff0.jpg)
Summary
- Premiums and discounts to net asset value are a feature of exchange-traded funds, not a bug.
- As we've seen recently, there are episodes where the spreads between ETFs' prices and their net asset values widen significantly.
- These dislocations create profit opportunities for ETF market makers. Exploiting these opportunities brings ETFs' prices back in line with their NAVs.
- Premiums and discounts can be roughly decomposed into three constituent parts: differences in portfolio valuation, costs borne by market makers, and the supply and demand for ETFs' shares.
- Together, these factors represent a portion of the cost of liquidity. Investors should be mindful of this cost and, if they must trade, do so carefully.
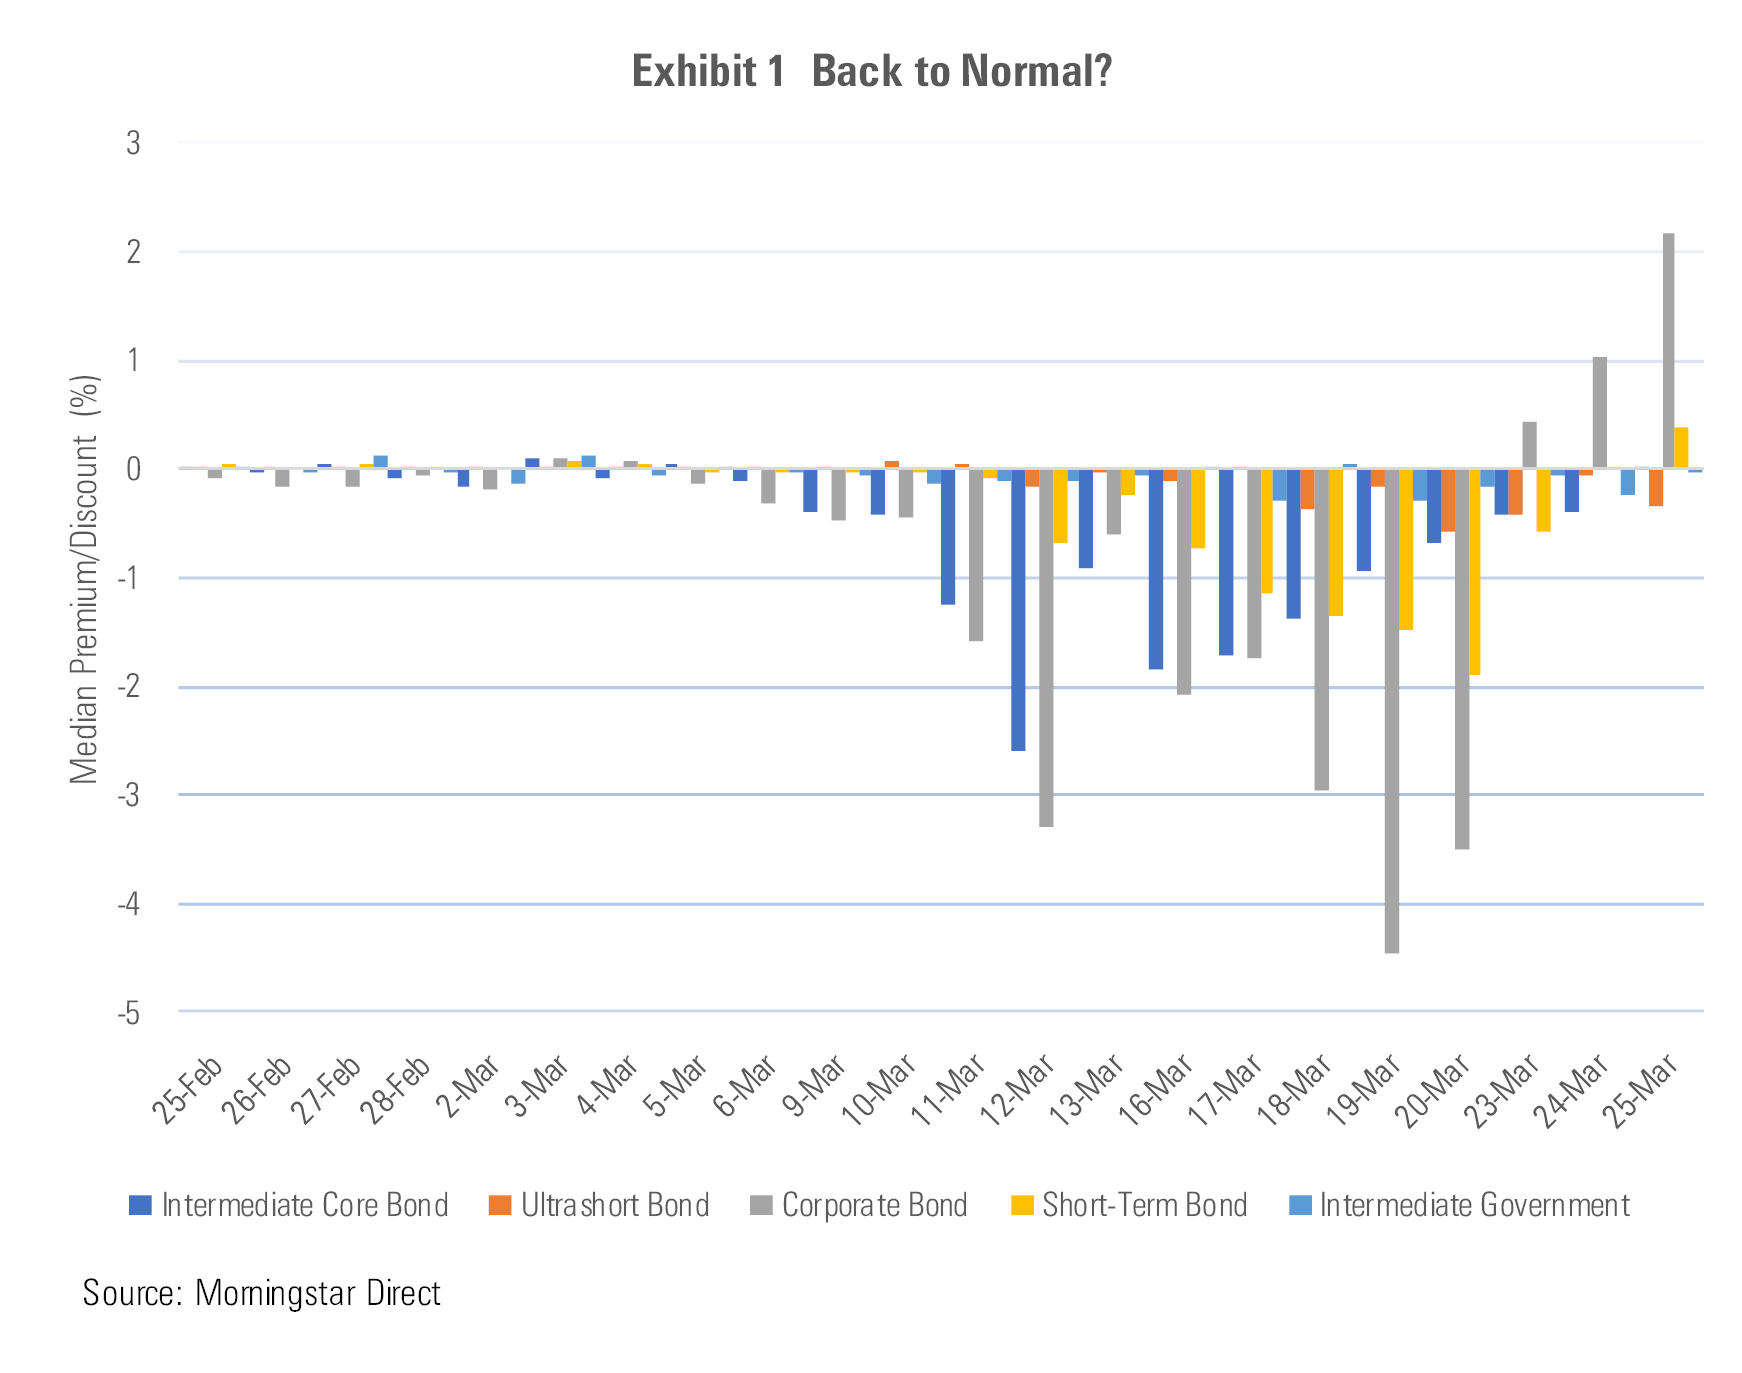
Recent market volatility has caused the prices of some ETFs to come unmoored from their NAVs. But these episodic dislocations are a feature of ETFs, not a bug. These circumstances create opportunities for ETF market makers to profit from bringing ETFs’ prices back in line with their NAVs. During the week of March 23, the prices and NAVs for many of the ETFs that saw the most extreme discounts were again reunited. As of March 25, things were mostly back to normal, as shown in Exhibit 1.
Here, I’ll dig a bit deeper into the factors that explain these sporadic dislodgments.
The Price Is Right? ETFs' prices and their NAVs aren't always going to agree. Premiums and discounts come with the territory. One of the biggest factors explaining them are differences in portfolio valuation.
ETFs’ NAVs are all stale--to varying degrees. Each and every tick in the funds’ share prices isn’t synced with a tick in each and every one of the securities in its portfolio. These mismatches vary depending on what’s in the fund. A U.S. equity ETF like iShares Core S&P 500 ETF IVV keeps the same market hours as the stocks it holds. Both the fund and its holdings trade a lot, so it should hew closely to its NAV all day long. At the other end of the spectrum are Japanese equity ETFs. Every day, while iShares MSCI Japan ETF EWJ is trading on the New York Stock Exchange, the stocks in its portfolio are tucked in for the night as the Tokyo Stock Exchange closes before New York opens and opens after New York has closed. In these instances, the ETF acts as a “price discovery” vehicle. In other words, when Tokyo is closed, it is a means for investors to express their views on the value of Japanese stocks in real time in the United States.
Fixed-income ETFs are on a different plane. Bonds are not stocks. They do not trade like stocks. In fact, many bonds might not trade at all on a given day. This means that there tends to be less information for the market to use in pricing bond ETF shares, and that available information may be dated. ETF market makers rely on proprietary models to try to bring this information into the now when they set bond ETFs’ prices during the trading day. Because bond ETFs trade in large volumes in real time, they contain massive amounts of information regarding the market’s view of the value of their underlying bonds. That said, they are a somewhat blunt instrument to the extent that their prices are more an expression of the market’s top-down view of the value of the basket of bonds they represent than a bottom-up bond-by-bond valuation exercise that takes place once a millisecond.
Bond ETFs trade while equity markets are open. Bonds trade when bond markets are open. The bond market closes an hour earlier than the stock market. Closing prices for bond ETFs are set an hour after the values for the bonds they hold are struck--the values baked into their end-of-day NAV. This mismatch explains a portion of the structural (that is, persistent and readily explainable) premiums and discounts we see among bond ETFs.
Bonds are not priced like stocks. Besides being set an hour earlier than ETF prices, the prices for bonds that are plugged into ETFs’ NAVs are based on bonds’ bid prices--the highest prevailing price that someone was willing to pay for the bond at the time the data was captured. ETFs’ closing prices are set at the midpoint between their last bid and offer prices. This difference partially explains why many bond ETFs tend to have structural premiums to their NAV.
Agency Costs The second component of ETFs' premiums and discounts is an agency cost of sorts. Market makers are agents of the ETF providers. They provide essential aftermarket support once funds have been rolled off sponsors' assembly lines. They earn their rent by ensuring that premiums and discounts are small and fleeting and by quoting tight bid-ask spreads. This keeps the cost of liquidity in ETF shares in check.
ETF market makers don’t do this out of the goodness of their hearts. They have a profit motive. Every opportunity for them to profit is accompanied by costs and carries risk. The risks they face and the costs they incur in doing their work are positively correlated with market volatility. When markets get hairy, ETFs’ premiums and discounts widen, as do their bid-ask spreads. This directly reflects greater price uncertainty and wider bid-ask spreads in the underlying markets. It also speaks to the increased risk that market makers face holding ETF shares and/or the underlying on their books in these conditions.
There is another structural cost that is part of ETF market makers’ calculus. This is the creation and redemption fees charged to them by ETF providers. These fees are charged directly to market makers when they create or destroy ETF shares in the primary market. The purpose of these fees is to protect existing ETF shareholders from the costs that result from flows into and out of the fund. BlackRock and Vanguard have recently increased the variable portion of the redemption fee for cash redemptions for some of their ETFs to the maximum allowable level (2%). These charges are a portion of the agency costs embedded in ETFs’ premiums and discounts.
Supply and Demand At risk of stating the obvious, the balance of supply and demand for ETFs' shares drives their prices, and thus has an impact on their premiums and discounts. These forces vary across market conditions and can even vary across ETFs offering the same exposures.
Recent examples abound, but the most notable one is from the intermediate core bond Morningstar Category. Exhibit 2 shows the ratio of the recent daily price returns for iShares Core U.S. Aggregate Bond ETF AGG and Vanguard Total Bond Market ETF BND. Given that the funds’ portfolios are near identical, you would expect their prices to move more or less in lock-step and that this ratio would hover around 1. While that has been the long-term trend, there have been significant deviations in recent days.
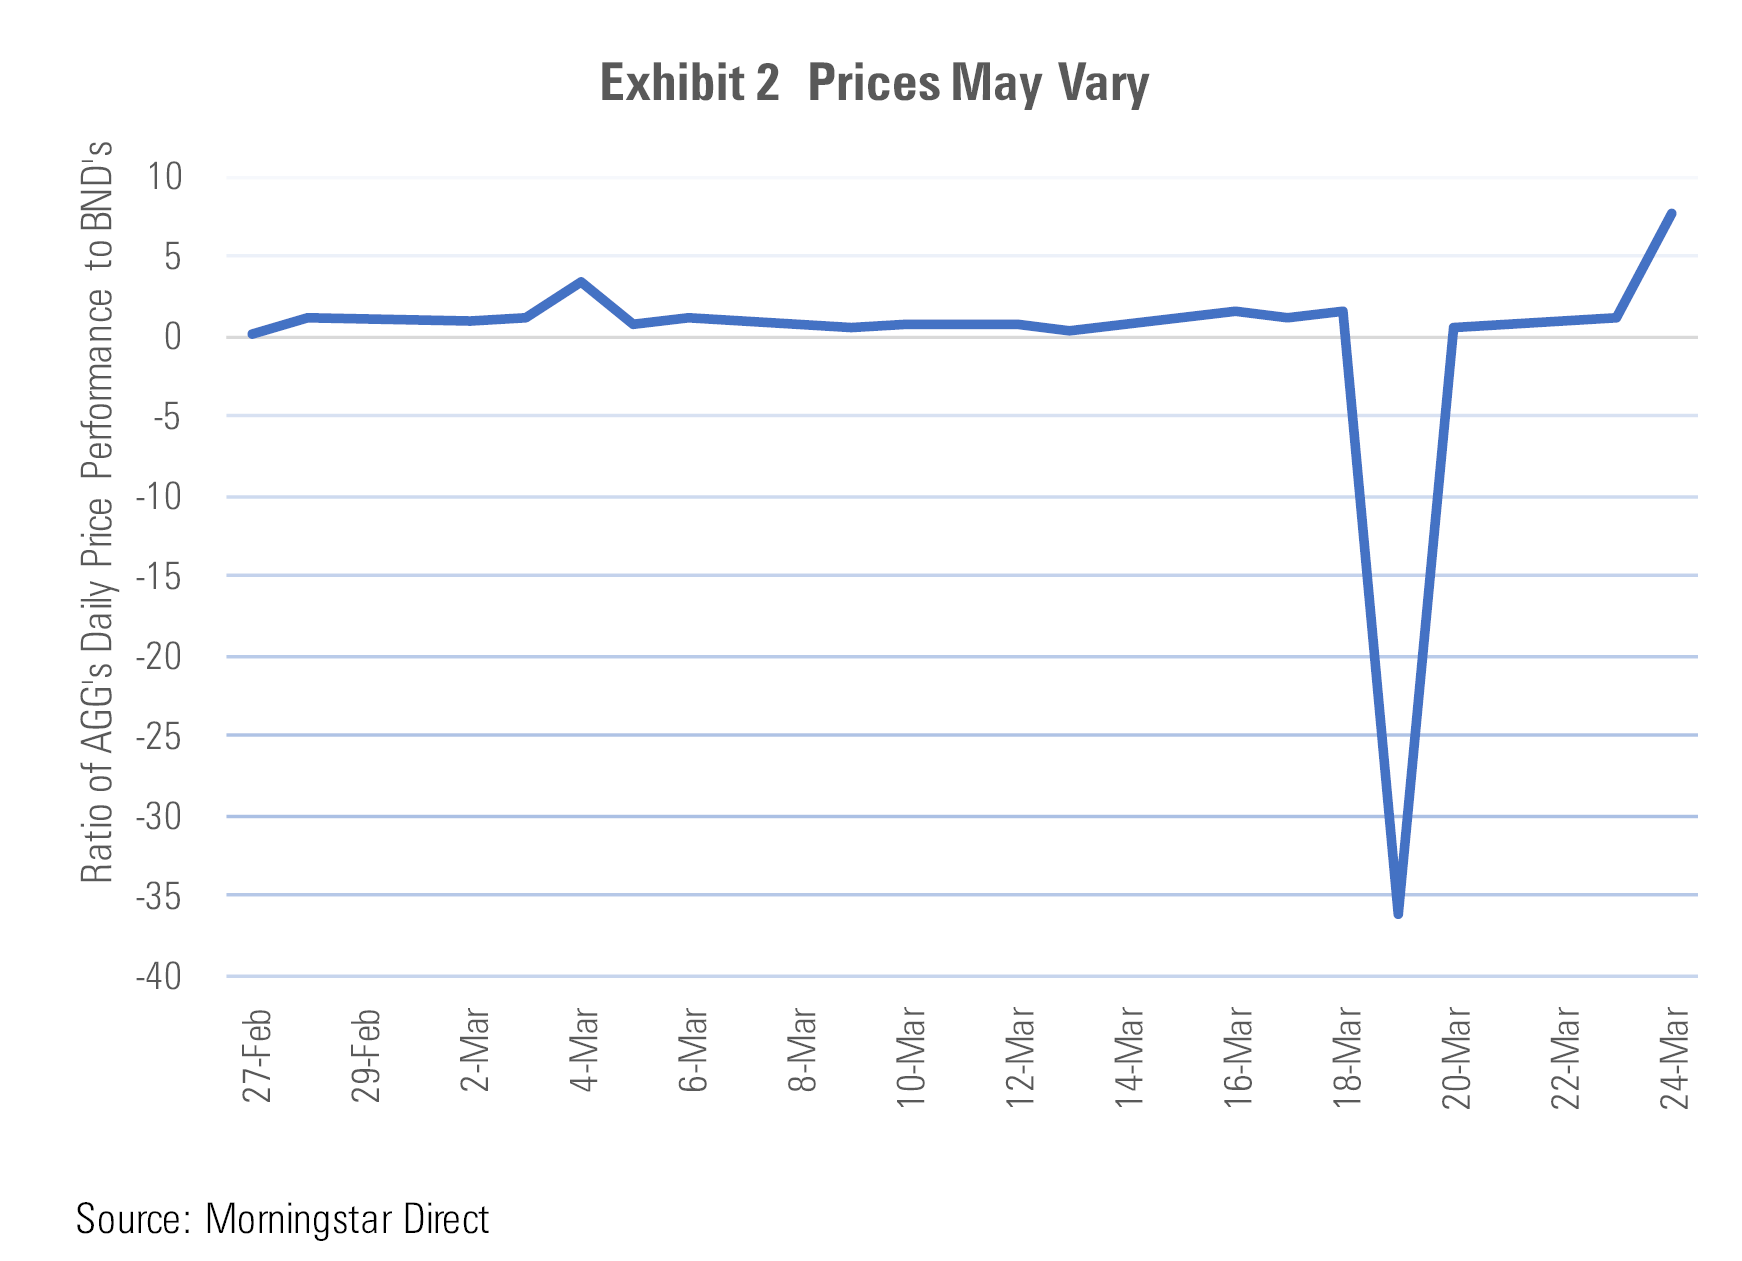
What explains this? Again, supply and demand are ultimately going to set ETFs’ prices. Different ETFs offering exposure to the same or substantially similar underlying exposures may have materially different shareholder bases. In this case, AGG tends to be more heavily traded and caters more to institutional investors and traders. BND trades less frequently and has a larger following among individual investors and advisors. The differing needs and tendencies of these different shareholder bases results in different supply and demand dynamics for these funds and can lead to short-term discrepancies in their price performance. This fund-specific dynamic is another key driver of ETFs’ premiums and discounts.
New Normal? While ETFs' prices and NAVs have begun to realign, episodic dislocations will remain a feature of the ETF wrapper. ETFs' prices have historically predicted the subsequent trajectory of their NAVs, but there are other factors at play--most notably the agency costs and fund-specific supply and demand dynamics outlined above. The sum of these factors materializes in costs that are absorbed by investors that need liquidity in these funds--the buyers and sellers. The fact that ETFs externalize these costs is beneficial to ongoing shareholders.
Premiums and discounts are a portion of the cost of liquidity in ETF shares. If possible, investors should avoid trading during times like these. For those than must trade, use limit orders.
Disclosure: Morningstar, Inc. licenses indexes to financial institutions as the tracking indexes for investable products, such as exchange-traded funds, sponsored by the financial institution. The license fee for such use is paid by the sponsoring financial institution based mainly on the total assets of the investable product. Please click here for a list of investable products that track or have tracked a Morningstar index. Neither Morningstar, Inc. nor its investment management division markets, sells, or makes any representations regarding the advisability of investing in any investable product that tracks a Morningstar index.
/cloudfront-us-east-1.images.arcpublishing.com/morningstar/24UPFK5OBNANLM2B55TIWIK2S4.png)
/cloudfront-us-east-1.images.arcpublishing.com/morningstar/T2LGZCEHBZBJJPPKHO7Y4EEKSM.png)
/d10o6nnig0wrdw.cloudfront.net/04-18-2024/t_34ccafe52c7c46979f1073e515ef92d4_name_file_960x540_1600_v4_.jpg)
:quality(80)/s3.amazonaws.com/arc-authors/morningstar/a90ba90e-1da2-48a4-98bf-a476620dbff0.jpg)