
Has the Bear Market Been a Bonanza for Active Funds? Nope.
What types of funds fared better or worse?
/s3.amazonaws.com/arc-authors/morningstar/550ce300-3ec1-4055-a24a-ba3a0b7abbdf.png)
Editor’s note: Read the latest on how the coronavirus is rattling the markets and what investors can do to navigate it.
We recently published a piece examining the performance of active U.S. stock funds during the recent bear market. In this piece, we'll expand on that by analyzing the performance of all types of active funds amid the sell-off. We'll look at which types of funds have fared better or worse, how that compares with recent history, and what kind of payoff investors in successful active funds have enjoyed.
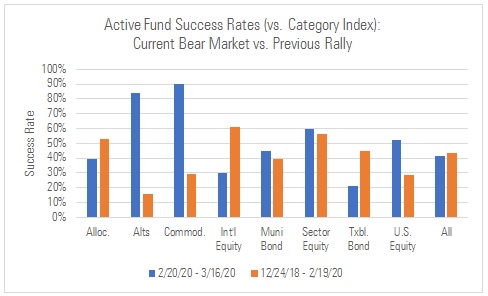
To summarize, about 42% of active funds beat their indexes during the bear market (Feb. 20, 2020 – March 16, 2020). That's slightly worse than the preceding rally (Dec. 24, 2018 – Feb. 19, 2020), when roughly 44% of active funds outperformed. Thus, it does not appear active funds have succeeded in greater numbers during the sell-off than they did amid the preceding rally.
Source: Morningstar.
Success rates during the bear market were highest among active funds in the commodities (90%), alternative (84%), and sector equity (60%) asset classes; they were lowest in the taxable-bond (21%), international-equity (30%), and allocation (39%) asset classes.
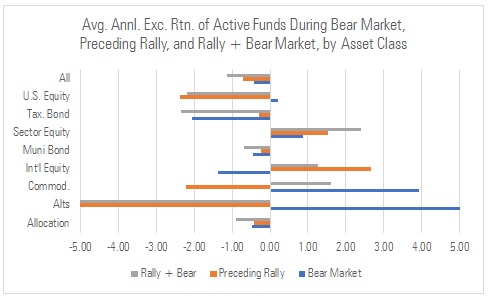
The average active fund lagged its index by around 0.42% during the bear market, compared with 0.72% during the preceding rally.
Source: Morningstar.
Alternatives funds beat their indexes by the widest margin during the bear market (6.89%, on average), followed by commodities (3.92%) and sector equity funds (0.86%). On the flip side, taxable-bond funds underperformed their benchmarks to the largest degree (negative 2.07% average excess return), followed by international-equity (negative 1.36%) and allocation (negative 0.47%) funds.
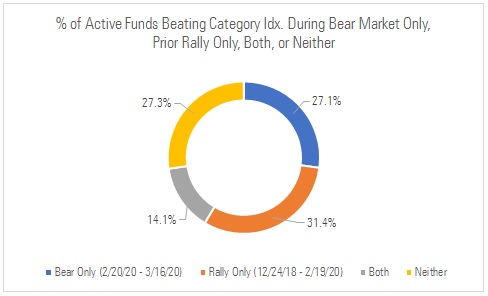
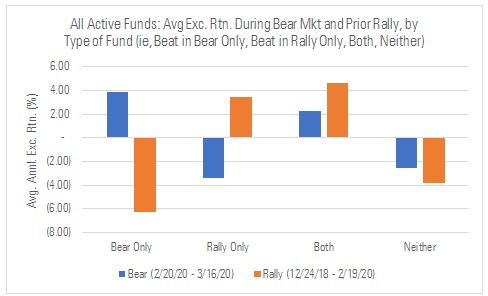
About two thirds of the active funds that outperformed during the bear market had lagged during the preceding rally.
Source: Morningstar.
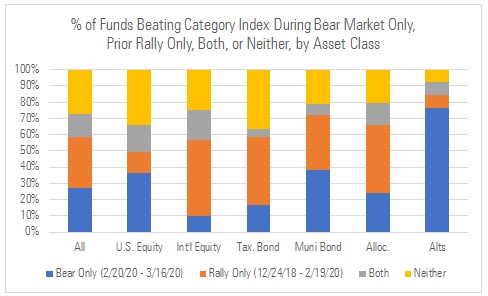
The international-equity asset class saw the most active funds beat their indexes during both the bear market and the preceding rally (19% of such funds). Conversely, very few active taxable-bond funds outperformed during the sell-off and the rally (5%). Active alternatives funds saw the biggest turnabout from the rally (when only 8% outperformed) to the bear market (when 84% outperformed).
Source: Morningstar Analysts.
Among funds that beat their indexes in the bear market but not the preceding rally, the average fund outperformed by around 3.93% during the sell-off. Yet, that average fund lagged its benchmark by more than 600 basis points, per year, during the preceding rally. Taken together, this left the average bear-market outperformer lagging its index over the full Dec. 24, 2018 - March 16, 2020 period.
Source: Morningstar.
By contrast, funds that beat their indexes during the rally but lagged in the recent sell-off essentially matched their indexes over the full period, on average.
Turning to individual peer groups, here are the 10 Morningstar Categories that had the highest success rates during the bear-market sell-off. Funds in the long-short equity category beat their indexes en masse largely because they're not fully exposed to the equity market like the S&P 500 is. (This also explains why these funds largely underperformed during the recent rally.) Similarly, because multialternative and tactical-allocation funds tend to invest less in stocks than their benchmarks, most of those funds outperformed amid the equity pullback as well.
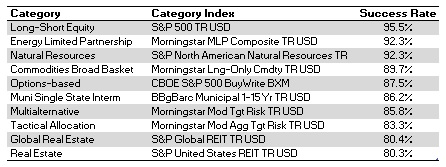
Source: Morningstar.
And here are the 10 Morningstar Categories where active funds had the least success. As a general rule, the more that risk portfolio managers entered the bear market with, the more their funds were punished. That principle certainly seems relevant to the categories below; many of them are homogeneous fixed-income peer groups whose indexes are loaded with high-grade, interest-rate sensitive bonds. That largely explains why active funds failed in large numbers in these cases.
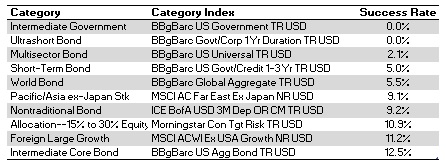
Source: Morningstar.
/cloudfront-us-east-1.images.arcpublishing.com/morningstar/FGC25JIKZ5EATCXF265D56SZTE.jpg)
/d10o6nnig0wrdw.cloudfront.net/04-25-2024/t_d30270f760794625a1e74b94c0d352af_name_file_960x540_1600_v4_.jpg)
/cloudfront-us-east-1.images.arcpublishing.com/morningstar/DOXM5RLEKJHX5B6OIEWSUMX6X4.png)
:quality(80)/s3.amazonaws.com/arc-authors/morningstar/550ce300-3ec1-4055-a24a-ba3a0b7abbdf.png)