
No Escape from Low Rates
Low interest rates depress expected returns for both stock and bond investors.
/s3.amazonaws.com/arc-authors/morningstar/56fe790f-bc99-4dfe-ac84-e187d7f817af.jpg)
A version of this article previously appeared in the October issue of Morningstar ETFInvestor. Click here to download a copy.
Interest rates influence the prices and expected returns of nearly every investment. Low and falling rates tend to inflate asset prices but reduce their future returns. That makes investors feel richer today but increases the challenge of growing wealth and generating income in the future. Rising rates have the opposite effect.
It was once unthinkable that interest rates would remain as low as they have for as long as they have, or that the Federal Reserve would cut the federal-funds rate below 2% with unemployment below 4%. While it's tough to predict what will happen to interest rates, investors shouldn't count on rates reverting to their historical norms. They can remain low for a long time, particularly when inflation expectations are low, as they are now. In Japan, short-term rates have been below 1% for more than 20 years.
There's nothing you can do to change interest rates or easily overcome the challenges low rates create. It's better to adjust expectations about the returns your investments can offer and determine whether they provide sufficient compensation for their risk.
Term Risk Currently, term risk doesn't pay well. Term risk is the extra interest-rate sensitivity that long-term bonds carry relative to short-term bonds. When interest rates rise, long-term bonds' prices tend to fall more than short-term bonds'. So, they should offer higher expected returns to compensate, and historically they have, as Exhibit 1 shows.
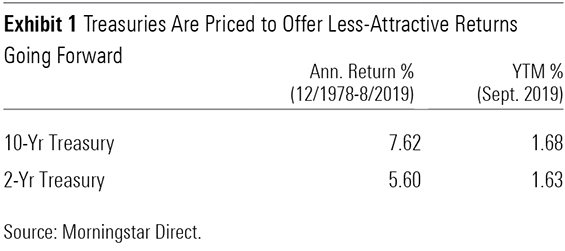
Most of the time, long-term bonds offer higher yields than short-term bonds. However, the Treasury yield curve, which plots the yields of Treasury bonds across the maturity spectrum, is currently fairly flat.
The shape of the yield curve reflects both the term risk premium and the market's expectations of future short-term rates. If the market expects short-term rates to fall significantly, the yield curve could slope down, even if long-term bonds offer a term premium. In that case, long-term bonds would still be priced to offer better returns than investing in short-term bonds and rolling the proceeds over to a successive series of newly issued short-term bonds at maturity, owing to future rate cuts. Typically, such cuts coincide with slowing economic growth, so an inverted yield curve is often interpreted as a sign of trouble ahead.
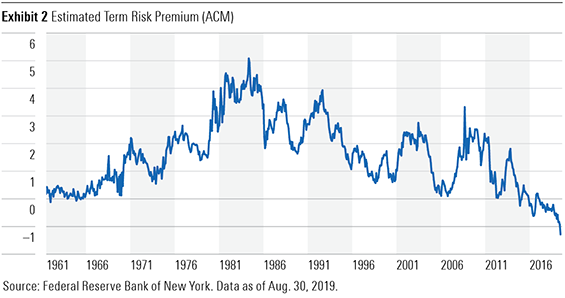
The term premium isn't directly observable, but an econometric model developed by economists at the New York Fed suggests that it has become negative in recent years, as shown in Exhibit 2. It's hard to explain why. However, the negative premium may be attributable to low inflation expectations, central bank purchases of long-term bonds, a desire to lock in long-term returns, and low rates in other countries.
With a negative term premium, it's more likely for the yield curve to be flat or inverted. The curve could be inverted if investors expect interest rates to remain flat or even rise slightly, which reduces its power to predict recessions. A negative term premium also suggests, even when the yield curve is sloping upward, that investors could earn higher returns by investing in short-term bonds and rolling those funds into newly issued short-term bonds at maturity than investing in long-term bonds.
Because long-term rates are low and the estimated term premium is negative, it may be prudent to consider tilting toward short-term bonds. One option worth considering is Vanguard Short-Term Bond ETF BSV, which carries a Morningstar Analyst Rating of Silver.
However, some caveats are in order. Short-term bonds have greater reinvestment rate risk than long-term bonds, creating greater uncertainty about the long-term return investors can get from them. And while short-term bonds tend to do better relative to long-term bonds when the yield spread between them is smaller, that relationship is noisy. So, long-term bonds can still offer higher returns even when the curve is flat.
A regression analysis revealed that the yield spread between 10-year and two-year Treasuries explained less than 10% of the subsequent return difference between those bonds over the next few years, as shown in Exhibit 3. That's because the shape of the yield curve changes over time, which changes short and long-term bonds' returns relative to each other.
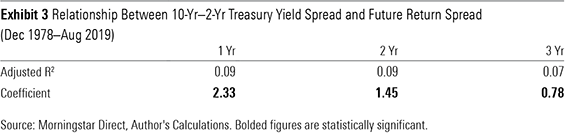
That said, the relationship between long- and short-term spreads and future returns was statistically significant (so it probably wasn't attributable to chance) and went in the expected direction. The results were similar using the estimated term premium in place of the simple yield spread.
Credit Risk When high-quality bonds, like Treasuries, are offering paltry rates--as they are now--it may be tempting to increase credit risk to boost yield. Credit risk isn't inherently bad; it should be rewarded over the long term. However, it's not prudent to let a yield target determine how much credit risk to take. Doing so can lead to excessive risk-taking when rates are low.
Above all else, investors' risk tolerance should drive the level of credit risk in a portfolio, but tactical adjustments may be warranted depending on how much compensation the market is offering for that risk. Currently, the expected return to credit risk is lower than average but not unusually low.
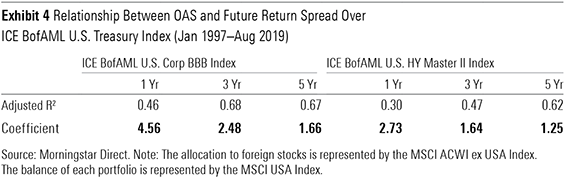
Option-adjusted spread, or OAS, is a useful gauge of the compensation the market is offering for credit risk. It's calculated as the difference between the yield to maturity (adjusted for prepayment options) that a bond with default risk offers and the yield to maturity on a duration-matched Treasury. This effectively controls for interest-rate risk. Exhibit 4 shows the current and historical average OAS for BBB rated and high-yield corporate bonds, based on the ICE BofAML U.S. Corporate BBB and ICE BofAML U.S. High Yield Master II indexes.
OAS doesn't match the expected credit risk/reward premium because it doesn't reflect the return drag that defaults can create. However, it's a pretty good proxy of that premium for investment-grade bonds, as defaults here are rare. Between 1983 and 2016, the annual credit loss (based on default and recovery rates) on BAA rated bonds, the lowest-rated investment-grade bonds, was only 0.11% according to Moody's. The corresponding figure for high-yield bonds was 2.66%.[1]
While not a perfect measure of the expected credit risk return premium, OAS is a decent predictor of the payoff to credit risk, as Exhibit 5 shows. This metric could explain 68% of the return difference between the ICE BofAML U.S. Corporate BBB and ICE BofAML U.S. Treasury indexes over the next three years, and 48% of the return difference between the ICE BofAML U.S. High Yield Master II Index and the Treasury index.
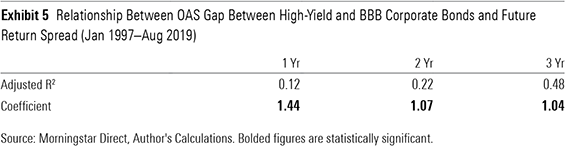
For every 1-basis-point increase in OAS, the BBB index tended to earn a 2.48-basis-points higher annualized return relative to the Treasury index. The corresponding figure for the high-yield index was 1.64. The impact of OAS on future returns appears to decline with the holding period. However, in every case a 1-basis-point increase in OAS had a bigger impact on the future return spread over the Treasury index. That's because OAS tended to mean-revert, which magnified the effect of the initial spread. Larger OAS tended to be followed by smaller OAS at the end of each of the three holding periods, and vice versa. When spreads tighten, lower-quality bonds tend to outperform Treasuries.
OAS is also predictive of high-yield corporate bonds' returns relative to BBB bonds. However, its predictive power is weaker here. Exhibit 5 shows the relationship between the OAS gap between the high-yield and BBB corporate bond indexes and their future return gap. Wider spreads between the two indexes corresponded to better returns on the high-yield index.
While credit spreads are currently a little lower than average, it probably isn't sufficient to warrant significant changes to the amount of credit risk in a portfolio. Increasing credit risk to boost income is often a bad idea because it can hurt a portfolio's ability to weather downturns in the stock market, as the payoff to credit risk is positively correlated with the stock market and the health of the economy.
Sticking to the investment-grade market is an easy way to keep credit risk in check. Investors looking for a modest yield pickup over the Bloomberg Barclays U.S. Aggregate Bond Index might consider Silver-rated iShares Broad USD Investment Grade Corporate Bond ETF USIG. It doesn't carry quite as much credit risk as the BBB index, though BBB rated bonds represent around half of its portfolio.
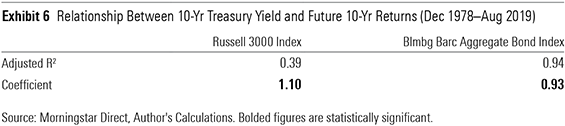
No Refuge Interest rates also have a significant impact on the value and expected returns of stocks. From the end of 1978 through August 2019, every 1-basis-point increase in 10-year Treasury yields was associated with a 1.1-basis-point increase in the realized return of the Russell 3000 Index over the next 10 years, as Exhibit 6 shows. This relationship wasn't as tight as it was for the Aggregate Index, as there's more uncertainty about stocks' future cash flows, but it demonstrates that stock investors can't escape interest rates' gravity. Low rates inflate valuations and depress future returns. That's true for both stock and bond investors.
[1] Ou, S., Irfan, S., Liu, Y., & Kanthan, K. 2017. “Annual Default Study: Corporate Default and Recovery Rates, 1920-2016.” Moody's Investor Service.
Disclosure: Morningstar, Inc. licenses indexes to financial institutions as the tracking indexes for investable products, such as exchange-traded funds, sponsored by the financial institution. The license fee for such use is paid by the sponsoring financial institution based mainly on the total assets of the investable product. Please click here for a list of investable products that track or have tracked a Morningstar index. Neither Morningstar, Inc. nor its investment management division markets, sells, or makes any representations regarding the advisability of investing in any investable product that tracks a Morningstar index.
/cloudfront-us-east-1.images.arcpublishing.com/morningstar/24UPFK5OBNANLM2B55TIWIK2S4.png)
/cloudfront-us-east-1.images.arcpublishing.com/morningstar/T2LGZCEHBZBJJPPKHO7Y4EEKSM.png)
/d10o6nnig0wrdw.cloudfront.net/04-18-2024/t_34ccafe52c7c46979f1073e515ef92d4_name_file_960x540_1600_v4_.jpg)
:quality(80)/s3.amazonaws.com/arc-authors/morningstar/56fe790f-bc99-4dfe-ac84-e187d7f817af.jpg)