
Active Share Can Be Useful, But It’s Not a Silver Bullet
It measures differences, but differences aren’t the same as skill.
/s3.amazonaws.com/arc-authors/morningstar/550ce300-3ec1-4055-a24a-ba3a0b7abbdf.png)
New York Attorney General Eric Schneiderman recently announced that 13 fund companies had voluntarily agreed to disclose a measure called "active share" to retail investors. In a press release heralding the agreement, Schneiderman stated, "These new disclosures will give Main Street investors access to critical information before making investment decisions for themselves and their families."
That invites an obvious question: Is active share really critical to investment decisions? The short answer is that while it can be useful, it's probably not a must-have, as further explained below.
Background Introduced by professors Martijn Cremers and Antti Petajisto in 2006, active share measures the extent to which a stock fund's holdings overlap with a specified benchmark index's. If a fund's holdings perfectly replicate the benchmark's, then its active share is zero. Conversely, if it invests exclusively in nonindex names, then its active share is 100, and so forth.
Active share has arguably caught on for a few reasons:
- It's not too hard to grasp yet can convey useful information about a stock portfolio's makeup.
- It's believed by some to be predictive; these defenders argue that high active share funds are likelier to outperform than low active share funds. (This claim is disputed by other researchers, however).
- It can be used to assess whether an active fund is charging a fair fee.
Defining "Fair" The third reason seems to form the crux of the Attorney General's argument, which an example helps to illustrate: Suppose two active equity funds levy the same expense ratio. Based on price tag alone, neither fund is clearly the better deal. But let's suppose the first fund has an active share of 55 and the second an active share of 95. By the Attorney General's reasoning, the first fund is clearly a worse deal than the second fund. Why? It charges the same fee but delivers only about half the promised "active" management.
The Attorney General hammers home this point repeatedly in its accompanying report, "Mutual Fund Fees and Active Share." That report culminates in this chart, which plots the fees of U.S. stock funds against their active share for the period January 2012-December 2015.
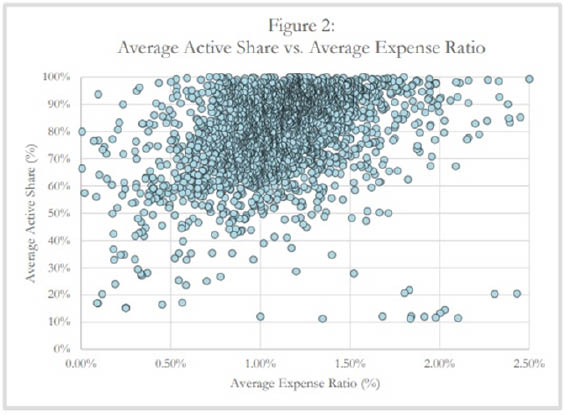
- Source: Investor Protection Bureau, State of New York Attorney General
If active U.S. stock funds charged fair fees based on their level of active share, then the dot-plot would arc up and to the right. But instead we see funds with wildly different active shares clustering at each major expense ratio increment. Based on this, the Attorney General concludes that "investors cannot necessarily assume that a high fee or expense ratio means that a fund will have a high Active Share."
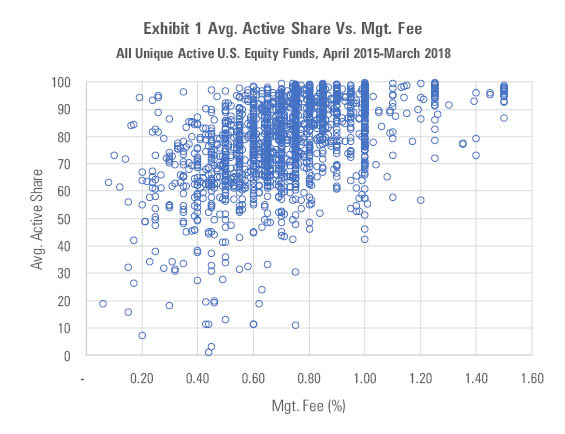
Gray Matter This looks damning, and, indeed, the Attorney General is onto something: Our own research suggests there are many mispriced active stock funds out there. But there's some nuance lacking, too. The chart compares funds' active shares to their all-in expense ratios, but those expense ratios include nonmanagement fees like distribution, marketing, and back-office expenses. To go apples-to-apples and isolate the relationship between how much a fund charges for active management and how "actively" it invests, one would want to compare active share with its management fee only. We've done so in the chart below.
- Source: Morningstar
While there's more upward slope to this chart than the Attorney General's, it's still noisy. However, there's still more nuance to consider: Namely, to assess a fund's "value," we need to consider its management fee in proportion to its active share.
To illustrate, imagine there are two similar funds, one of which charges a 0.35% management fee, the other 0.55%, with active shares of 60 and 98, respectively. By dividing each fund's management fee by its active share, we can derive a sense of how much each fund charges per unit of "active" management, or an "active fee." By this measure, the first fund is a worse deal (0.58% active fee) than the second fund (0.56%). In the chart below, we've sorted all active U.S. equity funds into quintiles based on their active fees.
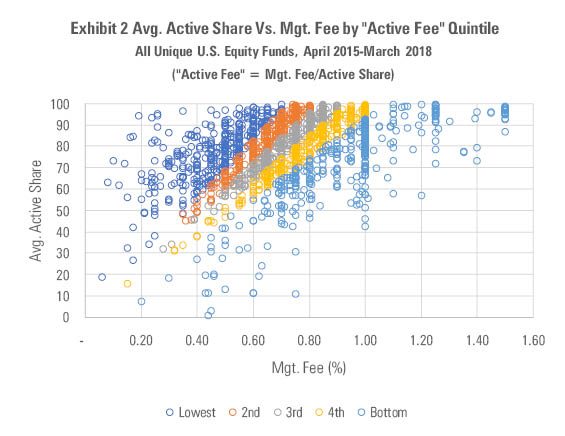
- Source: Morningstar
Based on the above, we'd probably be inclined to dismiss any of the funds in the lower quintiles--which levy high active fees--and limit our consideration to the cheaper funds in the upper left corner. That is, we'd expect the lower active fee funds to be likelier to outperform (generate positive excess returns vs. their benchmark) given that they're cheap for the degree of active management they deliver. But when we examine these funds' excess returns over the three years ended March 31, 2018, we don't find that the outperformers cluster in the upper left corner as the previous exhibit would suggest. There's no evident pattern at all, with outperformers and underperformers rubbing elbows at virtually every combination of management fee and active share.
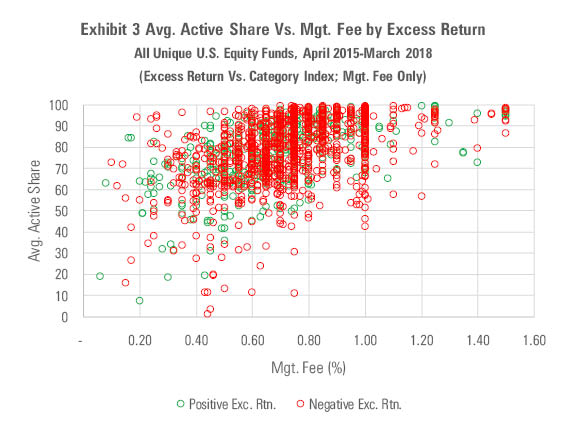
- Source: Morningstar
This next chart illustrates the same concept, but plots active share against excess returns. If there was a positive relationship between the two, we'd expect an upward-sloping distribution, but instead it's fan-tailed, suggesting that active share doesn't have an especially strong bearing on the likelihood of outperformance.
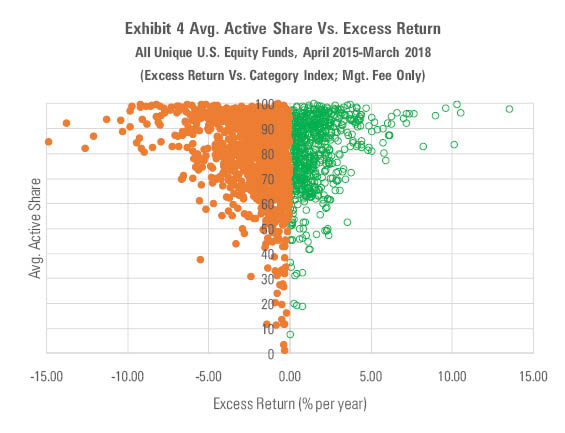
- Source: Morningstar
Takeaways Active share can help investors suss out differences between a fund and its benchmark or to compare between multiple funds that track the same index. That is, active share does what it says it's going to do--aggregate the differences between a fund and its benchmark--and that can facilitate fund selection and even portfolio construction, making it a potentially worthwhile descriptive measure.
But it doesn't appear to be strongly predictive of future returns. That lack of predictiveness can stem from a number of factors, not least being the reality that successful active management hinges on being different and right, not just being different (active share quantifies differences alone). What's more, as other researchers have pointed out, active share can be very sensitive to the benchmark chosen, as shown in the charts linked here, which plot the relationship between active share and management fees across the nine major styles of the Morningstar Style Box.
As shown in the charts, small- and mid-cap funds exhibit higher active shares than large-cap funds, potentially reflecting the expansiveness of smaller-company indexes rather than higher levels of active management among the funds that track those indexes.
To be sure, the New York Attorney General's agreement seems well-intentioned as an effort to make more data available to investors. But it also seems to overlook the fact that active share's merit as a measure of value-for-fees depends on the relationship between active fee and future performance. Based on our research, that relationship doesn't appear to be strong, which makes one question how critical active share really ought to be considered to begin with.
/d10o6nnig0wrdw.cloudfront.net/04-25-2024/t_d30270f760794625a1e74b94c0d352af_name_file_960x540_1600_v4_.jpg)
/cloudfront-us-east-1.images.arcpublishing.com/morningstar/DOXM5RLEKJHX5B6OIEWSUMX6X4.png)
/cloudfront-us-east-1.images.arcpublishing.com/morningstar/ZKOY2ZAHLJVJJMCLXHIVFME56M.jpg)
:quality(80)/s3.amazonaws.com/arc-authors/morningstar/550ce300-3ec1-4055-a24a-ba3a0b7abbdf.png)