
The Number of Strategic-Beta ETPs Continues to Mushroom
New funds are coming to market at a record pace, complexity is on the rise, and fees are under pressure.
/s3.amazonaws.com/arc-authors/morningstar/a90ba90e-1da2-48a4-98bf-a476620dbff0.jpg)
The following is an excerpt from our annual "Global Guide to Strategic-Beta Exchange-Traded Products." You can find the full report here.
Two years ago, we introduced our naming convention and taxonomy for the fast-growing universe of strategic-beta exchange-traded products, or ETPs. The goal of our initial guide was to help investors to better define, measure, and analyze this diverse group of passively managed investment products that make active bets against their broad, market-cap-weighted predecessors. In this year's guide, we provide an update on the state of the global strategic-beta ETP landscape.
One year on, the space has continued to grow faster than the broader ETP market and the asset-management industry as a whole. Growth has been driven by new cash flows, new launches, and the entrance of new players--some of which are traditional, dyed-in-the-wool active managers. We expect these trends will continue and may ultimately accelerate as newer ETPs tracking new and unproven benchmarks season and more new entrants make their way into the market. This process of growth and maturation will ultimately lead to a culling of the herd, which has already begun in some geographies, albeit to a limited extent. An increasingly crowded and competitive landscape will also put pressure on fees. We have already seen instances of aggressive fee reductions for strategic-beta ETPs. We anticipate that cost competition in this space will become more prominent in the years to come.
The U.S. Strategic-Beta ETP Landscape
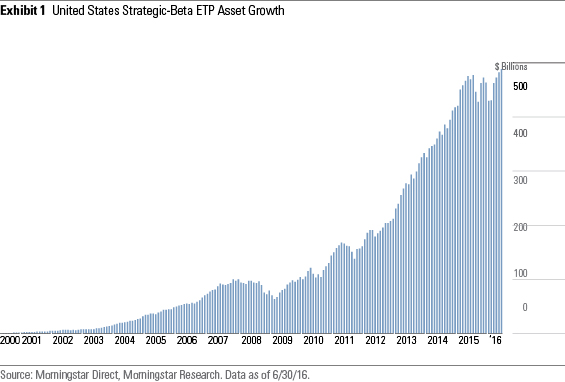
The United States is home to what is far and away the largest and most diverse stable of strategic-beta ETPs. It is host to 54% of the total number of strategic-beta ETPs, which together account for 89% of global ETP assets. This should come as little surprise given the overall size and maturity of the domestic asset-management and financial-services industries. The first strategic-beta ETPs came to the U.S. market in May 2000.
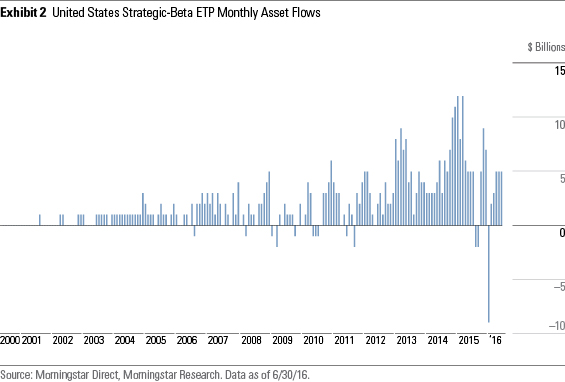
Grow With the Flow Growth in strategic-beta ETPs has been driven primarily by new adopters across the investor spectrum, ranging from individuals to state pension funds. Approximately 79% of the aggregate growth in strategic-beta ETP assets dating back to May 2000 has come from net new inflows, while the remaining 21% reflects asset appreciation. In many ways, the U.S. market was well-"primed" for strategic beta. The Morningstar Style Box had popularized the concept of style investing among U.S. investors by the time the first strategic-beta ETPs were launched in 2000. At that time, ETFs had been around for about seven years, though they were still novel to many investors and used predominantly as trading vehicles. Also, within the advisor space, there were pockets of familiarity with the concepts of factors and risk premiums, owed in part to a rapidly growing and loyal army of Dimensional Fund Advisors [1] converts who were well-versed in size, value, and momentum.
Growth in assets under management in strategic-beta ETPs has outpaced that experienced by the broader ETP industry. As such, strategic-beta ETPs' share of the overall ETP marketplace has climbed to approximately 21% as of the end of June 2016 from nil in 2000--though these ETPs' share of the overall market slipped modestly in 2016.
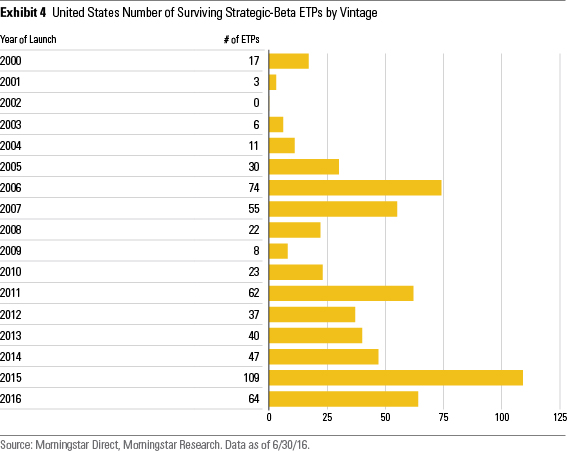
Roll Out the Betas As mentioned previously, the first generation of strategic-beta ETPs delivered fairly straightforward style tilts. Subsequently, there was a flurry of launch activity from 2005 to 2007, as strategic-beta-focused ETF providers rolled out full families of more-complex strategies. These included PowerShares' roster of Dynamic and RAFI funds, WisdomTree's suite of dividend-screened/weighted funds, and First Trust's AlphaDex lineup. New launch activity hit a lull from 2008 to 2010 thanks to the global financial crisis but picked up once again in 2011 as providers moved to cover new bases (low/minimum volatility/variance strategies, for example). More recently, new launches have accelerated. At 109, the number of strategic-beta ETPs listed in the U.S. in calendar-year 2015 smashed the prior record high of 74 set in 2006. Through the first six months of 2016, a total of 64 new strategic-beta ETPs were brought to market--a pace that implies the record set in 2015 might not last much longer. New launches are being driven by a combination of new entrants (Goldman Sachs, John Hancock, Legg Mason, Franklin Templeton, and others) and the product development equivalent of a trend-following strategy (as evidenced by the proliferation of low-volatility and multifactor strategies).
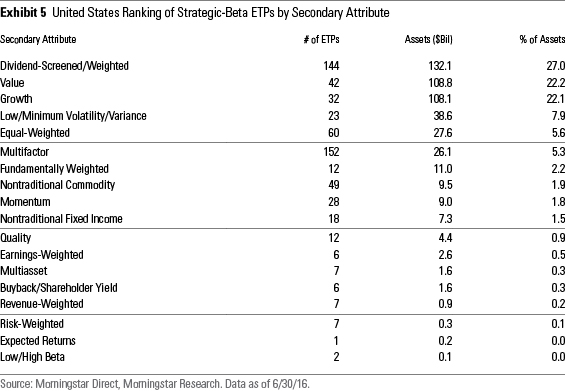
Simple Tastes While complexity has been on the rise, investors' preferences remain fairly plain-vanilla. Classifying the current roster of U.S. strategic-beta ETPs according to their secondary attributes shows that ETPs offering exposure to fairly straightforward strategies (value, growth, dividend-screened/weighted) account for 71% of strategic-beta ETP assets. Dividend screened/weighted strategies have proved particularly popular in the context of a yield-starved investment environment and investors who are placing a greater emphasis on investment income as they move from the consolidation stage of their investment lifecycle to the decumulation stage.
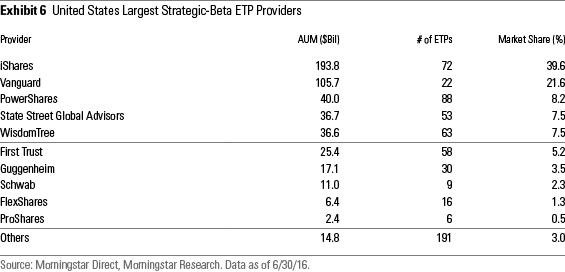
By Provider IShares and Vanguard account for just 15.4% of the total number of strategic-beta ETPs but have amassed 61.1% of the assets in this universe. Their suites of strategic-beta ETPs align closely with the rankings of the most popular secondary attributes. Specifically, their dividend-screened/weighted, value, and growth funds are among the largest in this universe. Occupying the third and fifth spots among the top five are two ETF providers that have made strategic beta their calling card: PowerShares and WisdomTree. Meanwhile, State Street Global Advisors unseated First Trust from the top five. This owed chiefly to outflows at First Trust. The firm's strategic-beta lineup experienced a net $2.2 billion worth of outflows in the 12-month span ended June 2016, while State Street's strategic-beta funds gathered approximately $850 million in new capital.
By Fund
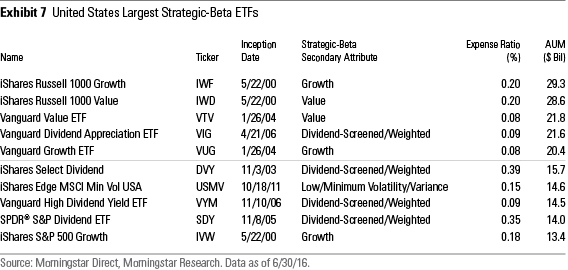
The top 10 strategic-beta ETPs by assets account for about 39.5% of assets in this corner of the ETP market. Again, cut-and-dried value, growth, and dividend-screened/weighted approaches dominate their ranks. There is, however, a notable exception at the top of the league tables:
Keeping an Eye on Expenses
The fees levied by strategic-beta ETPs are, on average, competitive with those charged by the ETP field at large, as well as the universe of ETPs ex-strategic beta. Of course, fees should be considered on a case-by-case basis. For example,
In sum, 71 of the 608 strategic-beta ETPs that existed as of June 30, 2016, saw their annual report net expense ratio decrease from 2014 to their 2015 fiscal year. The median decline in fees among this group was 0.03%. Meanwhile, 63 strategic-beta ETPs saw their fees inch higher, by a median level of 0.01%. The toll taken by the remaining 474 products remained unchanged.
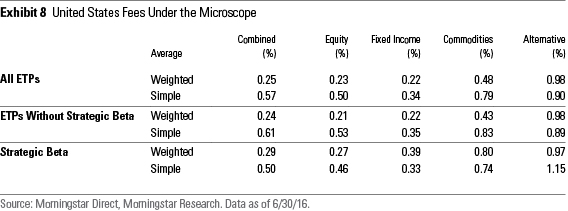
We expect that fees for strategic-beta ETPs will trend lower with time. We've already seen instances of proactive fee cuts among the PowerShares FTSE RAFI suite, as well as in the iShares Core lineup. Goldman Sachs ActiveBeta U.S. Large Cap Equity ETF GSLC, a multifactor fund that was launched in September 2015, charges a fee of just 0.09%. This is perhaps the most meaningful data point to date indicating that a trend toward lower fees is forming in the U.S. strategic-beta ETP market.
[1] As Dimensional Fund Advisors' funds do not track indexes by mandate, we exclude them from our definition of strategic beta. That said, the factors the firm sets out to exploit, the systematic manner in which it sets out to exploit them, and the fact that most of its funds charge low fees relative to peers make them close cousins.

Disclosure: Morningstar, Inc. licenses indexes to financial institutions as the tracking indexes for investable products, such as exchange-traded funds, sponsored by the financial institution. The license fee for such use is paid by the sponsoring financial institution based mainly on the total assets of the investable product. Please click here for a list of investable products that track or have tracked a Morningstar index. Neither Morningstar, Inc. nor its investment management division markets, sells, or makes any representations regarding the advisability of investing in any investable product that tracks a Morningstar index.
/cloudfront-us-east-1.images.arcpublishing.com/morningstar/24UPFK5OBNANLM2B55TIWIK2S4.png)
/cloudfront-us-east-1.images.arcpublishing.com/morningstar/T2LGZCEHBZBJJPPKHO7Y4EEKSM.png)
/d10o6nnig0wrdw.cloudfront.net/04-18-2024/t_34ccafe52c7c46979f1073e515ef92d4_name_file_960x540_1600_v4_.jpg)
:quality(80)/s3.amazonaws.com/arc-authors/morningstar/a90ba90e-1da2-48a4-98bf-a476620dbff0.jpg)