
Defensive ETFs: Too Good to Be True?
Defensive strategies, like those followed by low-volatility ETFs, can produce better risk-adjusted returns while smoothing out the highs and lows of the market.
/s3.amazonaws.com/arc-authors/morningstar/56fe790f-bc99-4dfe-ac84-e187d7f817af.jpg)
Low-volatility strategies offer defensive exposure to the stock market, attempting to give investors a smoother ride with better performance during market downturns. In exchange, they tend to lag during strong rallies. That's an attractive trade-off for risk-averse investors. There are other ways to reduce risk, such as allocating a larger portion of a portfolio to cash or bonds and less to stocks. But low-volatility stocks will likely offer a better risk/reward trade-off than the broad stock market or a stock/bond portfolio of comparable volatility.
Intuitively, there should be a positive relationship between risk (the type that can't be diversified away) and return. Why else would investors bear the extra risk? And in fact this relationship generally holds up across asset classes: Lower-risk assets, such as investment-grade bonds, tend to offer lower returns than higher-risk assets like stocks. But among stocks, the relationship between risk (defined by market sensitivity--beta--or volatility) and return isn't as strong as theory predicts it should be.(1) In other words, low-risk stocks have historically offered better risk-adjusted performance than their riskier counterparts. (See the references below for further reading.)
Much of this attractive performance can be attributed to defensive strategies' historical bias toward stocks with low valuations and high profitability, two characteristics that have been associated with higher returns. But because these strategies do not explicitly target stocks with these characteristics, their exposure to them, and thus their return profile, may change over time. This is one of the strongest criticisms of low-volatility investing. Following this line of reasoning, Dimensional Fund Advisors and Professor Robert Novy-Marx argue that it is better to allocate a portion of a portfolio to bonds to reduce volatility and explicitly target stocks with low valuations (the focus of DFA's argument) and high profitability to boost returns.
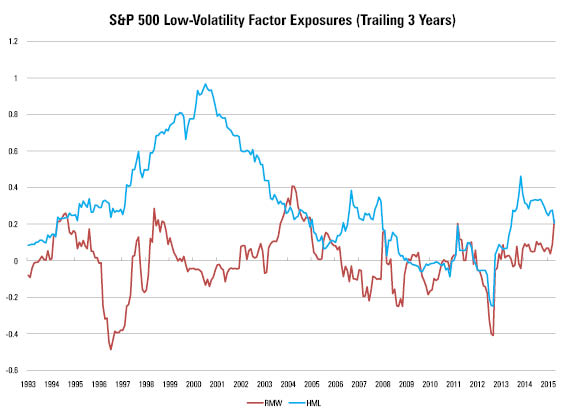
To illustrate the impact of these style tilts on performance, consider the S&P 500 Low Volatility Index. This index targets the least-volatile 100 members of the S&P 500 and weights its holdings by the inverse of their volatilities so that the least-volatile stock receives the largest weighting in the portfolio. From its inception at the end of November 1990 through February 2016, the index's value and profitability tilts contributed about 71 and 95 basis points, respectively, to its annual return.
The index's exposure to these factors has changed over time, as the chart below illustrates. It shows the index's exposure to value and highly profitable stocks in a rolling three-year regression that includes these factors together with size, momentum, and the market risk premium. This lends some credence to the criticism that the index may not offer a consistent performance profile.
Source: Morningstar
Yet, during the full period, the index had a residual annualized return (or alpha) of 1.27 percentage points that the model could not explain. This result was not statistically significant, meaning that the extra return could have been attributable to chance. But it's still economically meaningful and difficult to replicate.
There is probably more to the low-volatility story than a simple bias toward value or highly profitable stocks. Andrea Frazzini and Lasse Pedersen, two principals from AQR, published a paper called "Betting Against Beta," in which they constructed a market-neutral factor that went long low-beta stocks and short high-beta stocks. This factor had a statistically significant positive return (alpha) after controlling for its value, size, profitability, and market risk exposures.
Frazzini and Pedersen persuasively argue that borrowing constraints help explain defensive stocks' attractive risk-adjusted performance. These stocks tend to lag during bull markets and may offer slightly lower expected returns than the market over the long run. Therefore, they may not be appealing to investors who are trying to beat a benchmark (like most active managers), especially because many are unwilling or unable to borrow to boost these stocks' returns (a prudent course for most). That may push the prices of low-volatility stocks down, allowing them to offer more-attractive returns relative to their risk. Less-constrained investors, such as private equity funds, should prefer the more favorable risk/reward trade-off that less-volatile investments offer and apply leverage to boost returns. That is, in fact, the pattern Frazzini and Pedersen find.
Because many investors face borrowing constraints, there is a good chance that low-volatility stocks will continue to offer better risk-adjusted returns than the market. But investors shouldn't expect market-beating returns (even if low-volatility stocks have provided that in the recent past). These strategies will likely underperform in strong market rallies, outperform during market downturns, and offer marketlike returns--or slightly less--over the long term.
PowerShares S&P 500 Low Volatility Versus iShares MSCI USA Minimum Volatility
Investors can take advantage of the low-volatility effect through
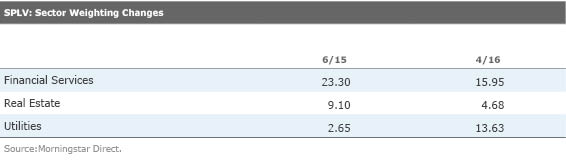
SPLV tracks the S&P 500 Low Volatility Index. Each quarter this index targets the least-volatile 100 members of the S&P 500 over the past year and weights them by the inverse of their volatilities, as previously described. The transparency is laudable, but the fund does not consider correlations among stocks or constrain its sector weightings or turnover.
This can lead to large--and perhaps unintended--sector bets and large shifts in the portfolio over time, which could make it difficult to use this fund as a core holding. For example, the fund's weightings in the financial services, real estate, and utilities sectors changed considerably between the end of June 2015 and April 2016, as the table below shows.
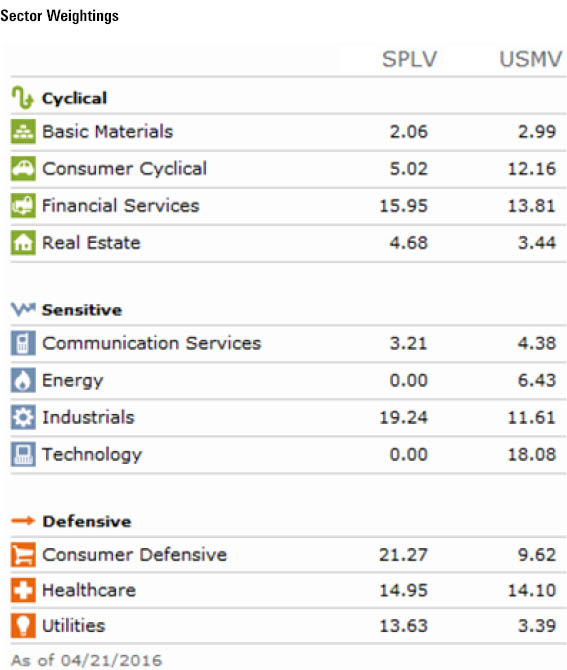
In order to address these issues, USMV limits its sector tilts to within 5 percentage points of the market-cap-weighted MSCI USA Index and caps one-way turnover at 20% at each semiannual rebalance. This fund tracks the MSCI USA Minimum Volatility Index, which attempts to construct the least-volatile portfolio possible with stocks from the MSCI USA Index. To do this, it uses an optimizer that takes into account each stock's volatility, factor exposures, and the correlations among them. This optimizer selects the appropriate stocks and weightings for the portfolio under a set of constraints, which include the sector and turnover limits previously described. It also limits individual stock weightings to 1.5% of the portfolio and explicitly limits the portfolio's value tilt. This gives the fund smaller exposure to the value factor than SPLV.
The constraints on USMV's portfolio improve diversification and may allow this fund to serve as core holding. As expected, its sector tilts are less pronounced than SPLV's, though they share similar biases. Both funds have greater exposure to utilities, consumer defensive, and real estate stocks than the S&P 500 and less exposure to the technology, consumer cyclical, and energy sectors. But where SPLV currently excludes energy and technology stocks entirely, USMV simply underweights them. The table below compares the sector weightings of the two funds.
Source: Morningstar
While USMV offers better diversification and often lower turnover than SPLV, its construction methodology is less transparent and less style-pure. From its back-filled inception in November 1990 through March 2016, the S&P 500 Low Volatility Index exhibited a lower (CAPM) market beta than the MSCI USA Minimum Volatility Index, with comparable volatility (less than 80% of the corresponding figure for the S&P 500). It also had greater exposure to Frazzini and Pedersen's Betting Against Beta factor, suggesting that it has better reflected the performance of the low-volatility/beta effect documented in the literature.
Additionally, the S&P 500 Low Volatility Index outpaced its MSCI counterpart by 58 basis points annually since its inception. But most of that outperformance was concentrated between March 2000 and October 2004, owing to the S&P index's more pronounced value tilt.
So, one fund isn't clearly better than the other. The decision between these two funds comes down to whether investors are looking for a core portfolio holding with relatively stable portfolio characteristics, which favors USMV, or a stronger bet on the low-volatility effect, favoring SPLV. I decided to purchase USMV for my personal portfolio because I like the constraints to preserve diversification. In the small-cap segment, I have purchased PowerShares S&P Low Volatility ETF XSLV (0.25% expense ratio), which uses a similar approach to SPLV. (There currently isn't a small-cap USMV equivalent.)
Note
1) Frazzini and Pedersen found this same effect in other asset classes.
References 1) Jensen, M., Black, F., & Scholes, M. 1972. "The Capital Asset Pricing Model: Some Empirical Tests." http://papers.ssrn.com/sol3/papers.cfm?abstract_id=908569
2) Crill, W. 2014. "Low Volatility Strategies." Dimensional Fund Advisors White Paper.
3) Novy-Marx, R. 2014. "Understanding Defensive Equity." NBER Working Paper No. 20591. http://www.nber.org/papers/w20591
4) Frazzini, A., & Pedersen, L.H. 2014. "Betting Against Beta." Swiss Finance Institute Research Paper No. 12–17. http://papers.ssrn.com/sol3/papers.cfm?abstract_id=2049939

Disclosure: Morningstar, Inc.'s Investment Management division licenses indexes to financial institutions as the tracking indexes for investable products, such as exchange-traded funds, sponsored by the financial institution. The license fee for such use is paid by the sponsoring financial institution based mainly on the total assets of the investable product. Please click here for a list of investable products that track or have tracked a Morningstar index. Neither Morningstar, Inc. nor its investment management division markets, sells, or makes any representations regarding the advisability of investing in any investable product that tracks a Morningstar index.
/cloudfront-us-east-1.images.arcpublishing.com/morningstar/24UPFK5OBNANLM2B55TIWIK2S4.png)
/cloudfront-us-east-1.images.arcpublishing.com/morningstar/T2LGZCEHBZBJJPPKHO7Y4EEKSM.png)
/d10o6nnig0wrdw.cloudfront.net/04-18-2024/t_34ccafe52c7c46979f1073e515ef92d4_name_file_960x540_1600_v4_.jpg)
:quality(80)/s3.amazonaws.com/arc-authors/morningstar/56fe790f-bc99-4dfe-ac84-e187d7f817af.jpg)