
Winning Funds Often Flame Out
A new Morningstar study finds that investors should look beyond past performance when selecting actively managed funds.
/s3.amazonaws.com/arc-authors/morningstar/56fe790f-bc99-4dfe-ac84-e187d7f817af.jpg)
It's no secret that investors often interpret past performance as evidence of manager skill and put their money to work accordingly. But risk-taking that paid off in the past may not continue to do so in the future. Luck--good or bad--may also influence past performance, but it's fleeting. Because performance-chasing is so prevalent, Morningstar conducted a study to assess whether there is any merit to selecting actively managed mutual funds based on past performance.
This study differs from others by measuring fund performance relative to peers within several Morningstar Categories over several lookback and holding periods. It also uses more-recent data than many of the papers published on this topic and digs into the drivers behind these return differences. The study found:
- There is some evidence that relative fund performance persists in the short term. Among equity funds, this appears to be attributable to differences in exposure to momentum stocks, rather than differences in manager skill.
- Over the long term, there is no meaningful relationship between past and future fund performance.
- In most cases, the odds of picking a future long-term winner from the best-performing quintile in each category aren't materially different than selecting from the bottom quintile.
- Survivorship rates are higher among previous winners than they are among previous losers. This difference increases with the length of the prior performance window and subsequent holding period.
Overall, the results strongly indicate that long-term investors should not select funds based on past performance alone. Rather, they should combine performance analysis with an assessment of other quantitative and qualitative factors, such as the fund's fees, the quality of its investment process and management team, and the stewardship practices of the asset-management firm. This more holistic approach should improve investors' odds of success.
Research Design We assign all actively managed mutual funds in 14 Morningstar Categories to performance quintiles based on their total returns relative to their category peers over the past one-, two-, three-, four-, five-, and 10-year periods. Each of these sorting periods represents a separate analysis. We track the average returns of the funds in each quintile over the same period after the sorting date. For example, for the three-year performance sorting period, funds are ranked according to their total returns over the past three years through the sorting date (for example, December 1996). This is the lookback period. Funds representing the best-performing 20% of each category over that period are assigned to the top quintile (Q1), the next-best-performing 20% go into the second quintile (Q2), and so on. The study then tracks the performance of each quintile over the subsequent three years.
We roll the sorting windows forward each year and take the average of the overlapping cohorts to reduce sensitivity to different start and end dates. The diagram below illustrates how this works for the three-year sorting period.
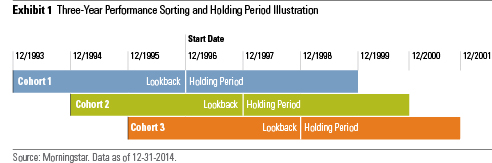
The sample period for most of the categories included in the study ran from the end of 1996 through December 2014, where December 1996 was the first sorting date. We used data from Morningstar Direct, including both surviving and nonsurviving actively managed funds. The performance ranking, and subsequent tracking, is based on the original category assignments. So if a large-value fund migrates into the mid-value category after the sorting date, its performance data will continue to be included in the large-value category. This approach effectively tracks how an investor's original opportunity set fared. The study measures each fund's return as the average return of all its share classes.
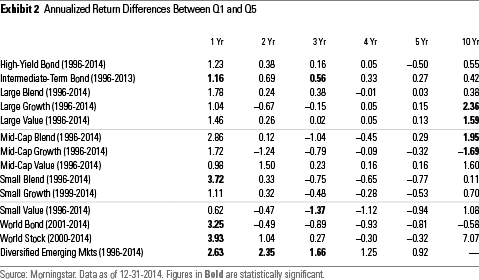
Results The best-performing funds (Q1) over the previous year continued to outpace the previous worst-performing (Q5) over the next year in every category included in the study. However, these differences were only statistically significant in five of the 14 categories. In the other nine categories, there is greater than a 5% probability that the apparent performance persistence was attributable to chance.
The performance gap between the previous winners and losers was generally smaller in the two-year sorting and holding periods. Here the previous winners only continued to outperform in 10 of the 14 categories, and the results were only statistically significant in one. The results were even weaker in the three-, four-, and five-year sorting periods. In these runs, the previous top performers only continued to outperform the previous laggards in six to seven of the 14 categories--not much different than a coin toss. Among the groups where performance persisted, only two turned in results that were statistically significant in three-year sorting periods, and none were significant in the four- and five-year periods.
Performance appeared to be more persistent in the 10-year sorting period, though not as strong as in the one-year period. Here the return spread was positive in 11 of the 13 categories and statistically significant in two.(1) However, in the mid-growth category, the previous top performers lagged the previous losers by a statistically significant margin. The table below shows the raw return spreads between the top and bottom quintiles for each category.
In order to determine what drove the differences in returns between the top and bottom quintiles, we regressed these return spreads against a few well-known return drivers. On the equity side, these included the market risk premium (return on a broad market index minus the return on one-month Treasuries), in addition to size, value, and momentum factors. Differences in returns that can't be attributed to one of those four factors are reported as alpha, which can be interpreted as a proxy for skill.
This analysis revealed that differences in momentum, rather than differences in skill, appear to explain return persistence in the short term. Over the one-year sorting and holding windows, funds in the top quintile exhibited stronger exposure to the momentum factor than those in the bottom quintile in every category, and all of these differences were statistically significant. Yet the alphas were not statistically significant in any category, indicating that differences in skill could not explain one-year performance persistence.
Over longer windows, the difference in momentum exposures between the top and bottom quintiles declined, which may explain why the performance gaps narrowed. The explanatory power of the regressions also declined. Outside the one-year window, there generally wasn't a big difference in market betas or market-cap orientations between the top and bottom quintiles in most categories.
More often than not, previous outperformers had a stronger growth tilt than previous losers during the holding periods. This is not surprising because previous top performers likely own stocks that have appreciated more than their counterparts and have more richly valued portfolios as a result.
Differences in credit and interest-rate risk exposures could partially explain the return spreads between the top and bottom quintiles in the three fixed-income categories. However, differences in skill may have contributed to the one-year performance persistence in the intermediate-term bond category.
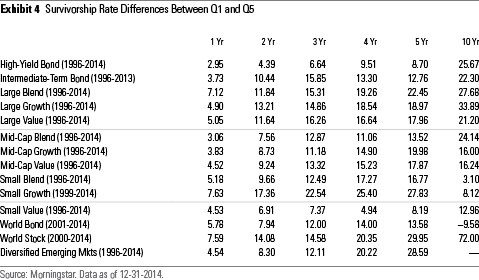
Success and Survivorship Rates To better gauge the likelihood of selecting winning funds from each quintile, we track the percentage of funds from each quintile that survive and land in the top half of their surviving category peers from the original sorting group. (This is labeled "success rate" below.) The tables below show the differences in the average success and survivorship rates between the top and bottom quintiles across all rolling periods in each sorting window (one, two, three, four, five, and 10 years).
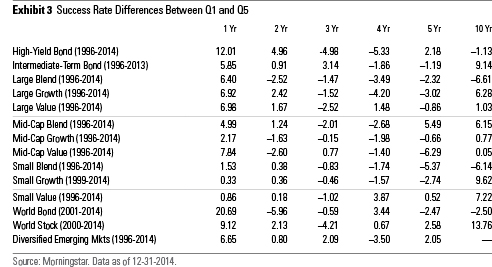
Consistent with the previous results, the top quintiles (Q1) tended to have higher success rates than the bottom quintiles in most categories over the one-year lookback and holding horizon. This success-rate gap was largest in the world-bond and high-yield bond categories and smallest in the small-growth and small-value categories.
Over longer horizons, the success-rate gaps between the top and bottom quintiles generally were smaller, particularly in the two-, three-, four- and five-year sorting periods. The success rate gap between the top and bottom quintile was negative in many categories over these longer windows. But top-quintile funds opened up a wider success rate advantage in several categories over the 10-year sorting period, partially because of larger differences in survivorship rates over that horizon.
It is also notable that the success rates are fairly low in most cases for the lookback and holding periods longer than a year. This suggests that it is difficult to pick funds that will outperform over the long term based on their prior records alone. For example, of the funds that landed in the top quintile of the large-blend category in the 10-year lookback periods, on average only 36% went on to land in the top half of their surviving peers in the subsequent 10 years.
Yet, the top prior performance quintiles had higher survivorship rates than the bottom quintiles across the board in each sorting period. (The sole exception appeared in the 10-year sorting period for the world-bond category.) This isn't surprising because it's easier to market funds with good records than laggards, which asset managers are more likely to merge or liquidate. Differences in the survivorship rates between the top and bottom quintiles tended to increase with the length of the lookback and holding periods.
A More Holistic Approach It is clear that investors need a more holistic framework to select mutual funds. In 2011, Morningstar launched a forward-looking qualitative rating system that evaluates mutual funds in five "Pillars": Process, People, Parent, Price, and Performance. Top-rated funds have a well-defined investment process that managers consistently apply and a competitive edge that should allow them to execute the strategy better than others. These funds have an experienced management team with long tenure on the strategy and skin in the game through significant investments in fund shares. They are offered by an asset-management firm (parent) that's a responsible steward of capital, and have competitive fees and a record of success that is consistent with expectations for the strategy.
Together, these characteristics will likely point to better long-term investments. Over the past decade through July 2015, more than 70% of funds in each asset class that had a Morningstar Analyst Rating of Gold or were designated as a Fund Analyst Pick (a predecessor ratings system) have outperformed their category average. This suggests that a comprehensive approach to fund analysis can improve investors' odds of success.
The full article can be found in the Research Library on Morningstar's corporate website.
(1) The diversified emerging-markets category was dropped from the 10-year sorting analysis because too few funds qualified for inclusion in the early years of the sample.
/d10o6nnig0wrdw.cloudfront.net/04-25-2024/t_d30270f760794625a1e74b94c0d352af_name_file_960x540_1600_v4_.jpg)
/cloudfront-us-east-1.images.arcpublishing.com/morningstar/DOXM5RLEKJHX5B6OIEWSUMX6X4.png)
/cloudfront-us-east-1.images.arcpublishing.com/morningstar/ZKOY2ZAHLJVJJMCLXHIVFME56M.jpg)
:quality(80)/s3.amazonaws.com/arc-authors/morningstar/56fe790f-bc99-4dfe-ac84-e187d7f817af.jpg)