
Mid-Cap Stocks: In the Sweet Spot
Strong past performance alone doesn't justify a dedicated mid-cap fund.

Mid-cap blend equity funds took in more investor flows relative to assets than any other of the nine categories in the Morningstar Equity Style Box during the past three years. This could be the result of performance-chasing. Historically, mid-caps have been a great bet. With higher returns than large caps but less risk than small caps, mid-caps have generated better risk-adjusted returns. But with elevated valuations, now may not be the best time to overweight mid-caps.
Since 1926, U.S. stocks have earned a return in excess of the risk-free rate of 6.3% with a standard deviation of 18.7%. The ratio of excess return to risk, known as the Sharpe ratio, was 0.33. The Sharpe ratio can be represented as the slope of a line in a graph with risk along the horizontal axis and excess return along the vertical axis. Grouping stocks into 10 deciles by market capitalization, with the smallest stocks in decile 1 and mega-cap stocks in decile 10, mid-cap stocks would make up deciles 6, 7, and 8. The graph below illustrates the near monotonic relationship between size and risk and return. While the Sharpe ratio for the mid-cap stocks in deciles 6, 7, and 8 was higher than it was for the other deciles, there is no guarantee that will hold in the future. However, the linear relationship between size, return, and risk will likely persist.

Sources: Kenneth French Data Library and author's calculations.
Fundamentals Mid-cap stocks appear more expensive on a number of measures. The price/forward earnings ratio for stocks in the Russell Midcap Index was 19.7 at the end of March 2015, higher than it has been in all but 18 out of the 444 months since 1978. That price/earnings ratio represents a 12% premium to the 17.6 price/forward earnings ratio for stocks in the large cap Russell 1000 Index. Historically, the two indexes have had about the same price/forward earnings ratio. Mid-cap stocks also have a lower dividend yield than large caps, in part because fewer mid-cap stocks pay a dividend and they have lower payout ratios, but also because of their elevated valuations. Morningstar analysts cover stocks representing 67% of the assets in the Russell Midcap Index. They derive a fair value estimate based on discounted cash flow analysis for each stock that they cover. They see the stocks in the Russell Midcap trading at a price'/fair value of 1.04, which is slightly richer than the 1.01 price/fair value multiple for the large-cap stocks in the Russell 1000 Index.
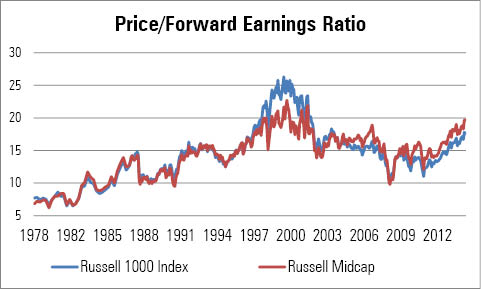
Source: Russell Investments.
Mid-cap stocks are riskier than large caps. They currently have higher debt/capital (43% for stocks in the Russell Midcap Index versus 39% for stocks in the Russell 1000 Index). In addition, they tend to be less profitable than the stocks in the Russell 1000, with a lower return on invested capital (11% versus 14%) and have a smaller percentage of assets invested in wide-moat stocks (18% versus 47%). As a result, they tend to be more volatile and more sensitive to the business cycle. However, they are forecast to grow earnings at a slightly faster rate than large-cap stocks. Consensus forecasts call for 11% growth in earnings during the next three to five years compared with 10% for large caps. According to S&P, stocks in the S&P MidCap 400 are expected to grow earnings by 16% from 2015 to 2016, compared with 14% for stocks in the S&P 500.
Investment Options
Investors often turn to index funds for exposure to mid-cap stocks. In fact, 75% of the assets in that Morningstar Category are invested in index funds. This is a higher percentage than any of the other U.S. equity categories. During the past five years, the largest fund in the category,
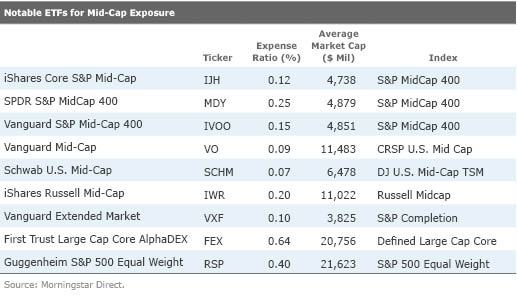
For those who wish to use size segment funds either as part of a strategic asset allocation or as a tactical investment, there are a number of mid-cap exchange-traded funds to choose from. Each of the ETFs listed below offers similar exposure and competitive costs, so the choice of which fund is best largely comes down to factors such as brokerage costs and how the fund will fit in an investor's existing portfolio.
Both
A number of strategic-beta ETFs in the large-blend category employ a tilt toward smaller-cap stocks, which results in exposure more similar to the mid-blend category than the large-blend category. Any return advantage these funds offer relative to a traditional mid-cap index fund may be eroded by their higher expense ratios.
As its name suggests,
Disclosure: Morningstar, Inc.'s Investment Management division licenses indexes to financial institutions as the tracking indexes for investable products, such as exchange-traded funds, sponsored by the financial institution. The license fee for such use is paid by the sponsoring financial institution based mainly on the total assets of the investable product. Please click here for a list of investable products that track or have tracked a Morningstar index. Neither Morningstar, Inc. nor its investment management division markets, sells, or makes any representations regarding the advisability of investing in any investable product that tracks a Morningstar index.
/cloudfront-us-east-1.images.arcpublishing.com/morningstar/EC7LK4HAG4BRKAYRRDWZ2NF3TY.jpg)
/cloudfront-us-east-1.images.arcpublishing.com/morningstar/T2LGZCEHBZBJJPPKHO7Y4EEKSM.png)