
Setting Expectations for Stock Returns
The past may not be a good guide for the future, but a forward-looking framework can help investors set realistic return expectations.
/s3.amazonaws.com/arc-authors/morningstar/56fe790f-bc99-4dfe-ac84-e187d7f817af.jpg)
It is vital for investors to set reasonable expectations for future returns. This not only facilitates better planning but can also help investors gauge whether an asset offers sufficient compensation for its risk and better compare different investments.
To illustrate the concept of expected returns, consider a casino with an American roulette wheel. There are 38 spaces on the wheel and 18 are red. If a gambler places a $1 bet on red and wins, he receives $1. Otherwise, the casino gets the dollar. The casino's expected return on this bet is: ((18/38)*-1) + ((20/38)*1) = 5.26%. That doesn't mean that the casino will necessarily generate a return of 5.26% each round, only that we would expect this return, on average, if the game were played thousands of times. (The odds favor the house.)
The market for risky assets, like stocks, is similar. Like the casino, investors can, and often do, lose money. But they require compensation for this risk in the form of positive expected returns, or more precisely, a higher return than they could earn on risk-free assets, like Treasury bills. This puts the odds in investors' favor. That said, it is more difficult to form return expectations for financial assets than it is for a game of roulette because we don't know the precise probabilities and potential payoffs ahead of time.
Rearview-Mirror Forecasting Because we don't know what the future holds, some investors base their expectations for future stock market returns on the past. The rationale is that the amount of compensation the market offered to investors in the past is representative of what it will offer in the future. This compensation is known as the equity risk premium, which is the difference between the return of an equity index and a risk-free asset, like short-term Treasury bonds, over a long period. From January 1927 through February 2015, the U.S. stock market outpaced Treasuries by 6.2% annualized. For purposes of forming a baseline expectation for future stock market returns, investors add this historical premium to the current risk-free rate, which is currently close to zero.
But this backward-looking approach can be misleading because it ignores valuations, which can cause expected returns to change over the market cycle. Dividend yields on large U.S. stocks, which have historically accounted for about 40% of their return, are lower now than they have been in the past. U.S. stocks are also trading at higher multiples of earnings than their historical average, which may further portend lower future returns. It is better to estimate expected returns based on their constituent parts using forward-looking inputs. I'll outline such a framework next and highlight a resource for those who wish to leverage these insights without doing the work themselves.
A Forward-Looking Approach We can break stock returns into three components: dividend yield, growth in per-share earnings, and changes in the valuation multiple that the market applies to those earnings. This relationship is summarized as: Return = Dividend Yield + Per-Share Earnings Growth +∆ Valuation. Of these three, dividend yield is the only variable that is directly observable. Because this is a forecasting exercise, it is reasonable to use the yield based on dividends expected to be paid out during the next year. Morningstar presents this data for funds on the portfolio page of its analyst reports, under "Style Details."
Long-term earnings growth is difficult to forecast for an individual stock. However, the task is more manageable for a broadly diversified portfolio. Real per-share earnings growth is driven by cash that managers reinvest in their business or use to repurchase shares. In a perfectly competitive and frictionless market, this growth rate would be equal to the difference between the earnings yield (assuming it is closely related to free cash flow) and the dividend yield. This rate would offer investors the same return on the reinvested cash that they would have earned if they had received it as a dividend.
Of course, the real world isn't frictionless or perfectly competitive, so this relationship is not clean. Managers often invest in suboptimal projects that do not offer a competitive rate of return, effectively destroying wealth through poor capital-allocation decisions. To account for this effect, it is prudent to apply a haircut to the difference between the earnings and dividend yields to forecast growth. For example, in forming its own growth forecasts, Research Affiliates cuts this difference in half (1). It argues that this adjustment better reflects the historical relationship between retained earnings and future growth.
If the current earnings yield is not sustainable, the relationship between retained earnings and growth may not hold. To address this issue, we could use the ratio of price/average inflation-adjusted earnings and dividends paid out over the past five to 10 years to better reflect a sustainable growth rate over a full market cycle. This data is a little harder to come by than price/forward earnings and dividend yields (both available in Morningstar fund analyst reports, on the portfolio page under "Style Details"), but the necessary inputs are available in Morningstar Direct.
As a sanity check, real economic growth is a realistic upper bound on aggregate earnings growth in the long term. If corporate profits grew faster than that, they would eventually crowd out other economic activity. In fact, the earnings of publicly traded companies will likely grow more slowly than the economy because they do not participate in the growth that new and private enterprises drive. While share buybacks could support higher per-share growth, share dilution has historically been the norm, according to research from Research Affiliates. From 1969 to 2014, U.S. real GDP grew by about 2.8% per year. During that time, real earnings accruing to the MSCI USA Index grew by 2.1% annualized, based on my calculations.
Changes in valuations often have a big impact on short-term market returns, and they can be difficult to predict. But in the long run, valuations tend to mean-revert, and changes in valuations don't usually have a significant impact on long-term returns. This is what some--most notably John Bogle--refer to as the speculative return. From December 1969 through March 2015, valuation expansion contributed 0.6% to the annualized returns of the MSCI USA Index. Valuations should not expand indefinitely because investors would not pay an infinite sum for a given level of earnings. Therefore, this is not a reliable source of returns over the very long term. Similarly, valuations should not shrink indefinitely, or earnings yields would become too high relative to the risk of those cash flows. It would be reasonable to assume that the impact from changes in valuations on long-term returns is close to zero. However, because valuations tend to mean-revert, it may also be fair to make a small downward (upward) adjustment to expected returns when valuations are high (low) relative to their historical average.
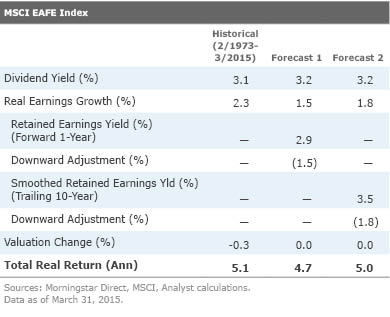
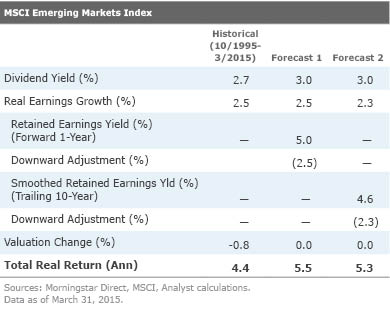
Putting It All Together The tables below show the components of the historical real return for the MSCI USA, MSCI EAFE (foreign developed markets), and MSCI Emerging Markets Indexes, along with my simple long-term real return (net of inflation) forecasts for each index based on the approach outlined above. These forecasts are only useful over long horizons (10 years or more). They indicate that the returns on U.S. stocks will likely be lower going forward than they have been in the past. This is partially because dividend yields among U.S. stocks are lower now than they have been in the past. Expanding valuations helped slightly boost returns during the past few decades, but this expansion is unlikely to continue. If anything, it is more likely that valuations on U.S. stocks would come down a bit over the long term as interest rates rise. At the end of March, the MSCI USA Index was trading at 20 times trailing earnings, above its average since the end of 1969 (16.8). To keep it simple, I assumed that long-term changes in valuations will be close to zero for all three indexes.
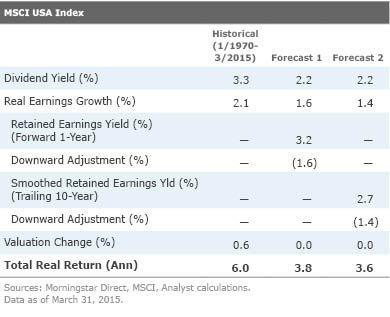
High valuations have also reduced retained earnings yields, meaning that there is a lower amount of earnings reinvested relative to the value of equity than in the past. This suggests that earnings may grow at a slower rate going forward. The tables show the earnings growth implied by both the retained earnings yield based on forward earnings and dividends and smoothed inflation-adjusted earnings and dividends during the past 10 years. Both approaches generally yield similar results. I also applied a 50% downward adjustment to retained earnings, mimicking Research Affiliates' approach. It may be reasonable to apply a smaller haircut.
The return forecasts for foreign developed- and emerging-markets stocks look more favorable, suggesting that a long-term return-maximizing investor should currently favor foreign stocks over U.S. stocks. Dividend yields in these regions are comparable to their historical averages. Contracting valuations have slightly detracted from foreign stocks' past returns, but there is a good chance that they won't continue to shrink in the long term. That's especially true of the MSCI Emerging Markets Index, which was trading at 13.7 times trailing earnings at the end of March, below its average of 15.3 since September 1995. The forecast for developed-markets stocks predicts lower real earnings growth in the future than in the past, similar to U.S. stocks. Emerging-markets stocks are more likely to grow their earnings at a similar rate in the future as they have in the past, based on this framework.
A Shortcut Research Affiliates generates this type of forecast for many different asset classes, and they are available on the firm's website. This is a good resource for investors who prefer to outsource the heavy lifting. Research Affiliates applies a similar framework, but it explicitly forecasts currency movements and takes the drag from index rebalancing into account to form its growth forecasts. It estimates earnings growth using smoothed inflation-adjusted earnings and dividends over the past 10 years (cutting the difference in half). Rather than ignoring valuation changes, Research Affiliates assumes that the cyclically adjusted price/earnings (CAPE) ratio based on the inflation-adjusted earnings during the past 10 years converges to the blended historical average for the country, region, and world during the next 20 years.
There are some other minor differences between Research Affiliates' approach and the assumptions I used in the examples above. But despite these differences, the conclusions are directionally similar. Specifically, Research Affiliates' model also predicts that U.S. stock returns will be lower going forward and that foreign stocks offer higher expected returns than U.S. stocks.
Summary
- Returns on stocks can be broken down into three components: dividend yield, growth in real earnings, and changes in valuations.
- U.S. stocks will likely offer lower long-term real returns going forward than they have in the past.
- Foreign stocks offer higher expected returns than U.S. stocks.
- Realized returns will likely differ from expectations, but a framework for creating return expectations can facilitate better planning and help investors evaluate whether an asset offers sufficient compensation for its risk.
Reference 1) Research Affiliates. "Equity Methodology Overview."
Disclosure: Morningstar, Inc.'s Investment Management division licenses indexes to financial institutions as the tracking indexes for investable products, such as exchange-traded funds, sponsored by the financial institution. The license fee for such use is paid by the sponsoring financial institution based mainly on the total assets of the investable product. Please click here for a list of investable products that track or have tracked a Morningstar index. Neither Morningstar, Inc. nor its investment management division markets, sells, or makes any representations regarding the advisability of investing in any investable product that tracks a Morningstar index.
/cloudfront-us-east-1.images.arcpublishing.com/morningstar/24UPFK5OBNANLM2B55TIWIK2S4.png)
/cloudfront-us-east-1.images.arcpublishing.com/morningstar/T2LGZCEHBZBJJPPKHO7Y4EEKSM.png)
/d10o6nnig0wrdw.cloudfront.net/04-18-2024/t_34ccafe52c7c46979f1073e515ef92d4_name_file_960x540_1600_v4_.jpg)
:quality(80)/s3.amazonaws.com/arc-authors/morningstar/56fe790f-bc99-4dfe-ac84-e187d7f817af.jpg)