
Investors Show Willingness to Buy Untested Funds
Looking at 10 years of fund flows through the lens of volatility.
Looking at 10 years of fund flows through the lens of volatility.

Investor sentiment may be swinging toward risk aversion. The Volatility Index, or VIX, is up more than 8% in July, although it's still down 8.5% for the year. There's certainly enough to make investors nervous, between high asset prices and geopolitical instability. This risk aversion is starting to show in open-end fund flows too, especially within the more-aggressive categories. (We left out exchange-traded funds for this analysis because they sometimes are used more as trading vehicles than open-end funds.)
High-yield bond funds had nearly $500 million in June outflows--the category's first net outflows in 10 months. Once-popular bank-loan funds are seeing an even greater exodus with about $6 billion in second-quarter outflows. The shift shows in U.S. small-cap equity funds too. Small-blend funds had nearly $800 million in June outflows while small-growth funds had an even greater $1.3 billion in outflows with about $4.2 billion migrating in the second quarter overall.
It can sometimes be tough to spot the broad trends in sentiment, though, when looking at month-to-month flows across categories. This can be alleviated somewhat by looking across asset classes rather than categories, but there can be significant dispersion within an asset class. The taxable-bond asset class, for example, includes categories that span the risk spectrum, from ultra-safe short-term government-bond funds to riskier high-yield and bank-loan funds. The same holds for the alternatives asset class, which includes everything from fairly staid market-neutral funds to highly volatile leveraged equity funds.
Looking Through the Lens of Volatility
An alternative way to aggregate funds is by volatility, as measured by three-year standard deviation. This approach has the advantage of combining funds across categories and asset classes. Of course, standard deviation is just one measure of volatility, and it doesn't necessarily give a clear picture of prospective risk. For instance, even though bank-loan funds carry quite a bit of credit risk, the average offering from that category has a three-year standard deviation of just 3.7% versus 6.4% for the typical high-yield fund. But whether flows are trending toward funds with higher or lower historical standard deviations does say something about investor sentiment.
Based on a backward-looking snapshot, it's striking how strong trends in investor sentiment can be. (Please see the table below. The Top Quartile has the lowest three-year standard deviation and the Bottom Quartile has the highest.) In the three and a half years through 2007 (that is, before the credit crisis really got going), flows into the most-volatile quartile dwarfed the flows into the least-volatile quartile. The most-volatile funds collected an estimated $335 billion versus just $161 billion for the least-volatile group.
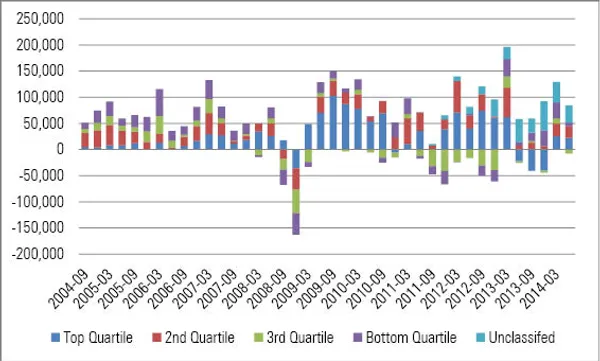
- source: Morningstar Direct
Not surprisingly, this relationship reversed during the credit crisis and the years that followed. From 2008 to 2010, the least-volatile funds benefited from investors' flight to safety and collected $546 billion in new money. Meanwhile, the most-volatile funds received a net $21 billion. If anything, it's somewhat unexpected that the most-volatile funds received net inflows at all.
Perhaps surprisingly, risk aversion was most acute in the last three quarters of 2011 and all of 2012. Granted, 2011 included the last correction of any consequence which came amid fears of an economic slowdown and a credit contraction, but it was nothing like the 2007-09 credit crisis. Even so, the two most-volatile categories lost nearly $280 billion in combined outflows. The two least-volatile quartiles were the beneficiaries, as they absorbed about $500 billion in inflows.
But investor sentiment shifted abruptly into "risk-on" mode beginning in 2013. Since the start of 2013, flows into the least-volatile group of funds have basically been flat. During that same six-quarter stretch, investors poured nearly $125 billion into the most-volatile category of funds. Much of this reflects investors' embracing equity funds and declining interest in bond offerings. They moved roughly $336 billion into equity funds during that 18-month period while bond funds--both taxable and municipal--took in about $38 billion.
The Unclassified Wildcard
This shift toward more-volatile funds and away from the least-volatile is somewhat reminiscent of the 2004-07 period.
What's interesting about this recent stretch is that a sizable chunk of inflows has gone to funds without a three-year track record. If those happen to be higher-risk funds too, then people really have embraced risk once more. It's pretty astonishing that these fledgling funds have collected more inflows over the past 12 months through June ($154 billion) than the other four quartiles (that is, funds with at least a three-year record) combined ($117 billion). Considering how smooth the ride has been since 2011's third quarter, most of these new funds haven't been tested in by market upheavals in any way. Talk about being comfortable with uncertainty.
Although traditional large-value funds have received the greatest of these inflows over the past 12 months ($12.5 billion), nontraditional bond ($12.4 billion), and multialternative ($9.7 billion) are in the top-five most-popular categories. JHancock Global Absolute Return (JHAAX) leads the latter group with nearly $1.9 billion in inflows over the past 12 months. Such absolute return funds have grown tremendously in popularity. Although the Hancock strategy has been in use since at least 2008, many others have never been tested by a full-blown bear market. For at least some of these funds, investors seem to be betting on hope over experience. The next bear market--whenever it comes--should be revealing.