
Sustainable Investing Indexes Struggled in Q2 2023
ESG benchmarks were raised by tech stocks again, but fell short against the broader equity market.


Even with the tailwind of a rally in big-name technology stocks, it was a tough quarter for sustainable investing indexes, which lagged the broader market’s rally. However, over the last five years, many sustainable investing indexes have still outperformed the overall stock market.
Shares of technology companies—including Nvidia NVDA and Microsoft MSFT—were among those that led the quarter in gains and have also led the market higher this year. These stocks score high on environmental, social, and governance criteria, allowing funds that emphasize sustainable investing to benefit from their strong performances. Yet while these made gains in the second quarter, ESG benchmarks still fell short in comparison with (or only narrowly surpassed) the broader equity market.
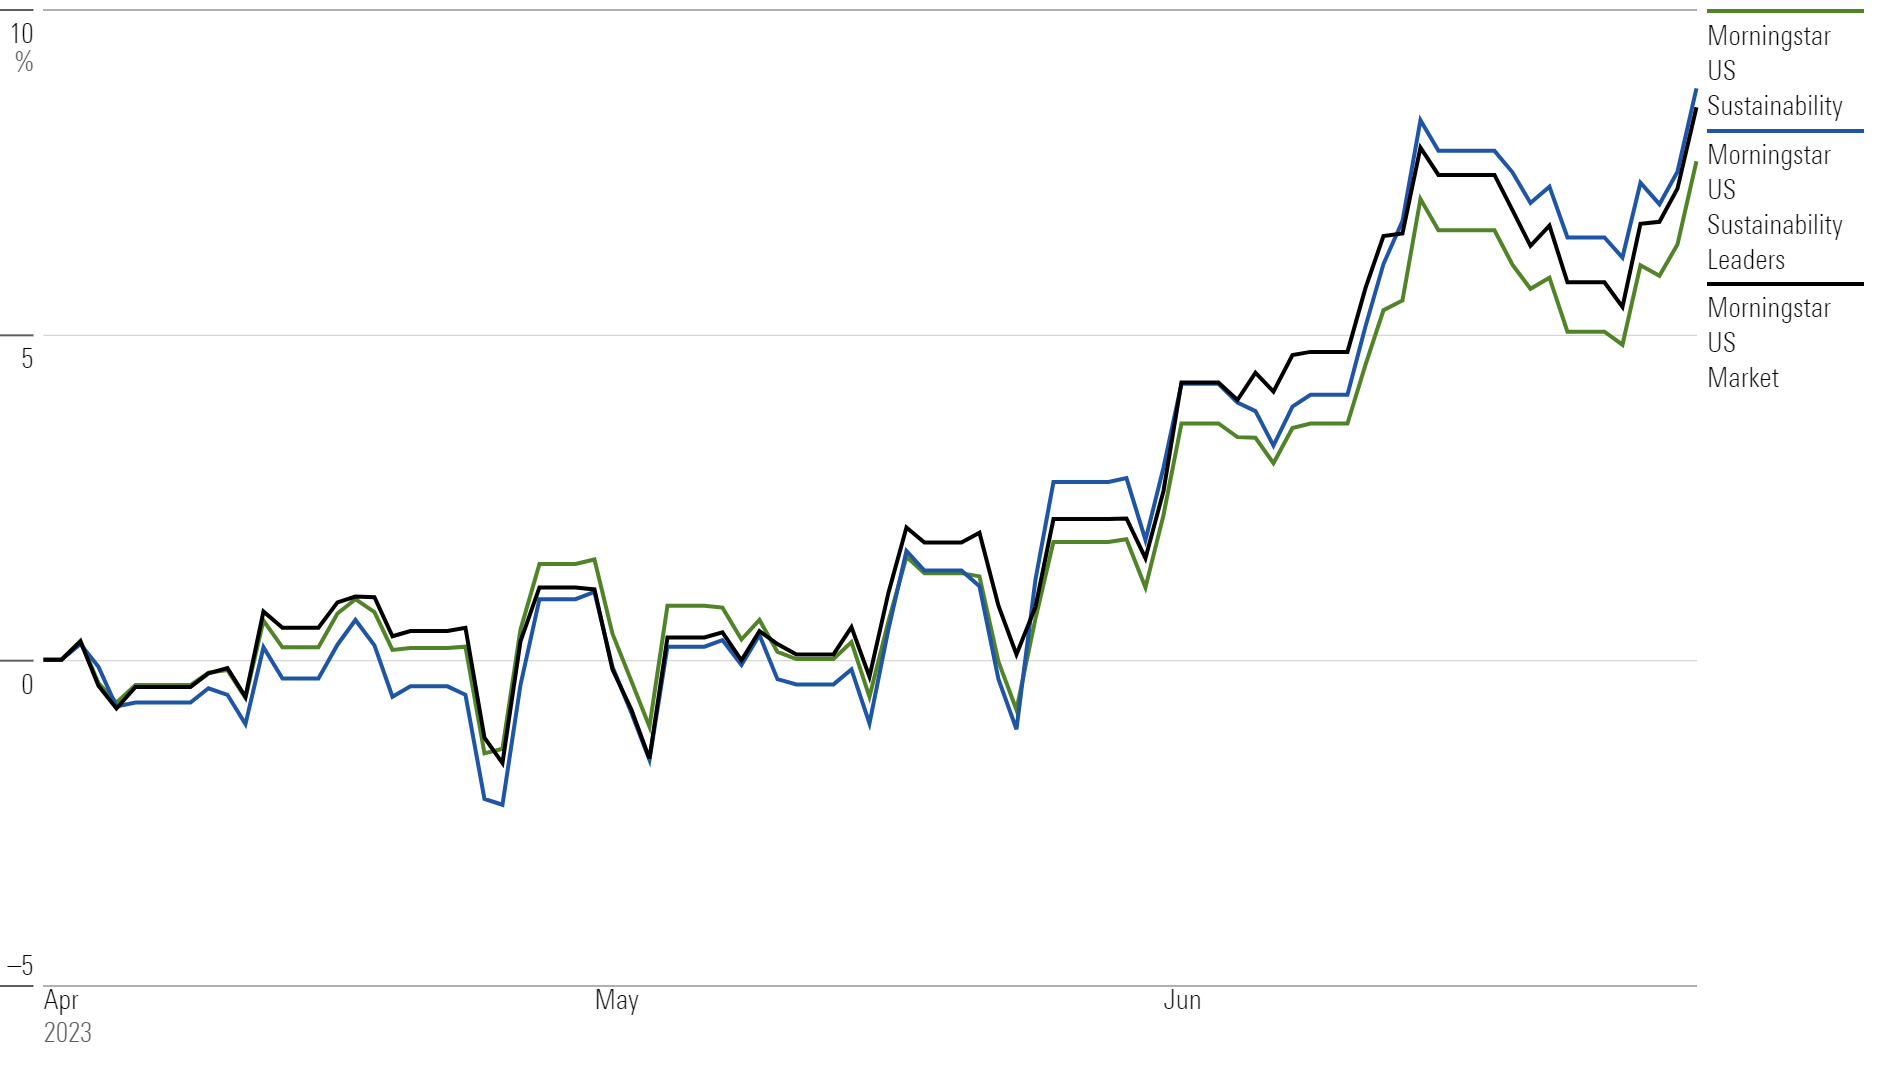
The Morningstar US Sustainability Index tracks large-cap and mid-cap stocks in the U.S. equity market while screening out companies with high ESG risk. The index gained 7.6% during the quarter. This is close to a full percentage point behind the 8.5% gain of the Morningstar US Market Index, which tracks the broader equity market.
The sustainability benchmark’s lagging performance is attributed to less favorable exposure to stocks within the consumer cyclical, communication services, and healthcare sectors, according to Alex Bryan, director of product management for equity indexes at Morningstar. In particular, there’s the complete absence of some of the second quarter’s biggest winners from sustainable strategies: Amazon.com AMZN, Tesla TSLA, and Eli Lilly LLY.
The stocks that made the cut of the Morningstar US Sustainability Index “are weighted by float market capitalization, so the omissions drive much of the market-relative performance—and anything that makes the cut will be overweighted relative to the market due to those omissions,” Bryan says.
Still, stocks for top-scoring companies in sustainability claimed a modest victory against the broader market by a small margin. The Morningstar US Sustainability Leaders Index, which tracks the 50 U.S. large-cap stocks with the highest sustainability scores, rose 8.8% in the second quarter.
Q2 2023 Performance
Sustainable Investment Performance in Q2 2023
Globally and across markets, five of the 21 Morningstar standard sustainable indexes—region-specific indexes with overlays that filter out companies with high ESG risk ratings—outperformed their broader market benchmarks during the second quarter. Over the past five years, 14 of the 21 indexes beat their benchmarks.
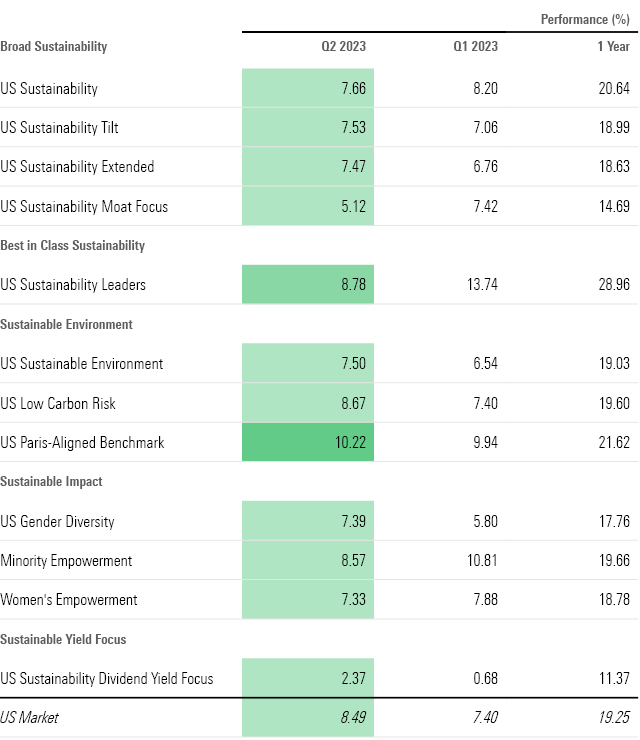
For U.S.-based sustainable-investing indexes, four out of 23 outperformed or fell in line with the broader market during the second quarter.
The best-performing sustainable index was the Morningstar US Target Market Exposure Paris-Aligned Benchmark Select Index (which tracks companies with clearly defined paths to reduce emissions in accordance with the Paris Agreement), which was up 10.2% in the second quarter. The Morningstar US Sustainability Leaders Index’s 8.8% gain made it the second-best performer in the quarter, and among the other indexes, it added the most within a one-year period.
For a second consecutive quarter, the worst-performing sustainable equity index was the Morningstar US Sustainability Dividend Yield Focus Index, which tracks companies that mitigate ESG risk while possessing attractive dividend yields and strong financial quality. Still, the index doubled its 0.7% gain from the first quarter and is up nine percentage points from the same period in 2022.
Sustainable Equity Indexes Returns
Tech Stocks Continue to Lead ESG Charge
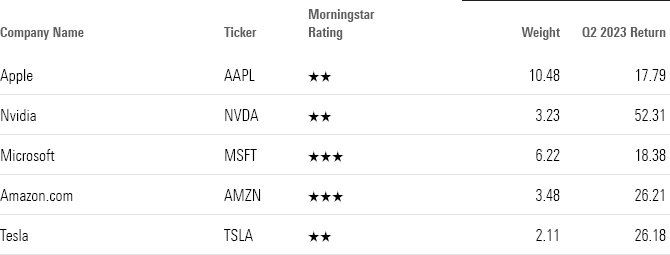
During the second quarter, most of the stocks that led the Morningstar US Target Market Exposure Paris-Aligned Benchmark Select Index came from companies in the technology and consumer cyclical sectors, both of which also led the broader U.S. market through the quarter. On the industry level, companies that produce semiconductors and consumer electronics were the largest contributors.
Morningstar Paris-Aligned Benchmark Key Advancers
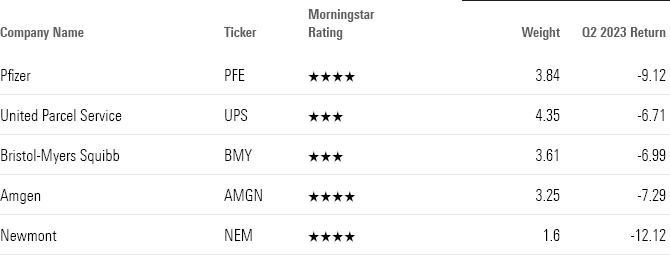
Continuing a trend from the first quarter, healthcare stocks in the drug manufacturing industry held back the performance of the Morningstar US Sustainability Dividend Yield Focus Index. They were joined by basic materials stocks in the integrated freight and logistics industry.
Morningstar Sustainability Dividend Yield Index Key Decliners
Longer-Term Sustainable Investment Performance
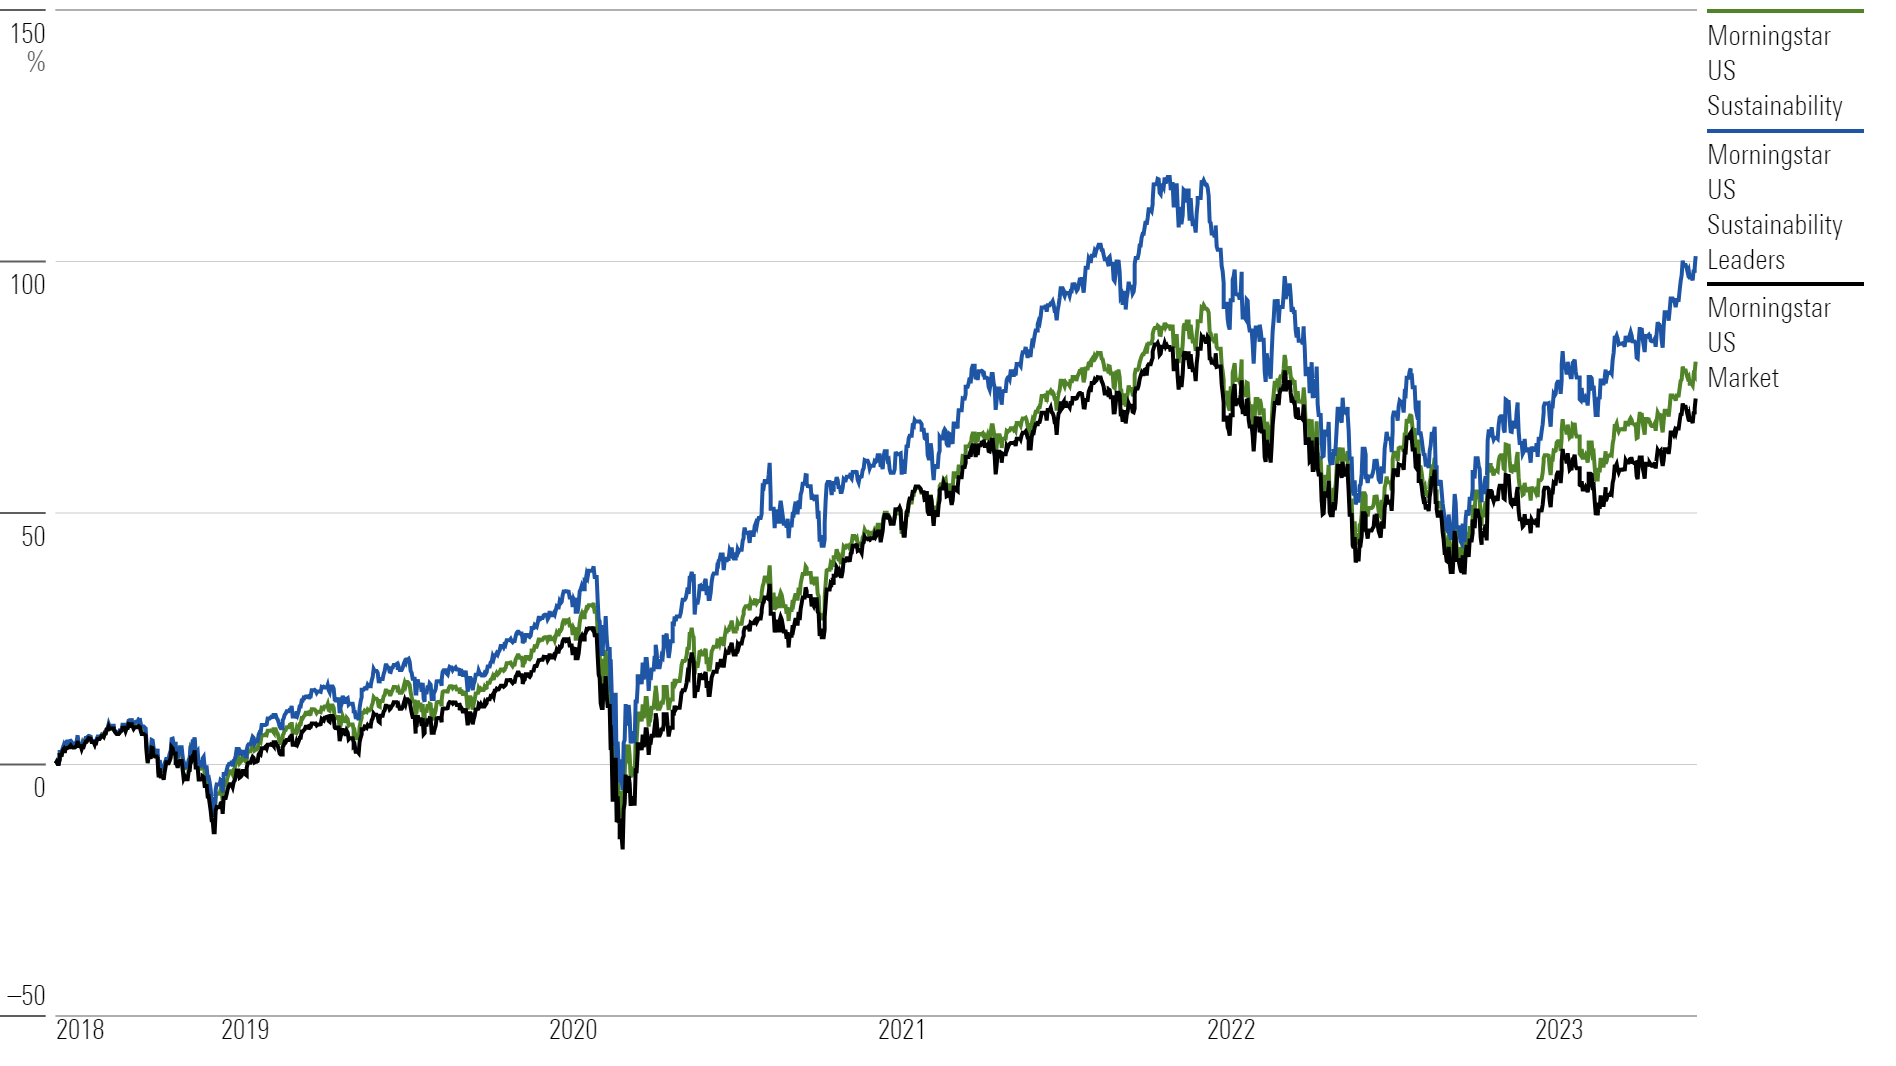
During the trailing five-year period, the Morningstar US Sustainability Leaders Index gained 100.9%, while the standard Morningstar US Sustainability Index returned 79.9%. The performances of both indexes surpassed the broader equity market, which rose 72.6% as measured by the Morningstar US Market Index.
5-Year Performance
The author or authors do not own shares in any securities mentioned in this article. Find out about Morningstar’s editorial policies.
/cloudfront-us-east-1.images.arcpublishing.com/morningstar/MGEDEFIRZJFHTAFNLDHG46SDXI.png)
/cloudfront-us-east-1.images.arcpublishing.com/morningstar/3WSI3CQP7FA6PNS52T4WTZ27VU.jpg)
/cloudfront-us-east-1.images.arcpublishing.com/morningstar/VSMLFOHJRVBK5L2JAJXUPP274Q.png)