Data from Morningstar’s Global Risk Model provides a new way to measure the risk exposure of a portfolio.
By Tom Whitelaw, Morningstar Research Services LLC

Risk
By Tom Whitelaw, Morningstar Research Services LLC
Read Time: 3 Minutes
There are several ways financial advisors can assess a portfolio’s risk. It’s essential to understand both a portfolio’s risk exposure and how it impacts the sources of return within that portfolio to help clients answer questions like: “Is my portfolio overexposed to risk from oil fluctuations?” Or, “Is my portfolio too concentrated in small-cap stocks right now?”
The Morningstar Global Risk Model provides a powerful new tool by allowing Morningstar Direct℠ users to make comparisons across portfolios and benchmarks on a standardized, objective basis. Users can create custom market scenarios, perform what-if analyses on market movements, and gauge their portfolio exposures to as many as 36 distinct factors.
Here, we highlight how the tool can help evaluate funds’ exposure to certain risk factors.
The Global Risk Model uses the Valuation factor to evaluate how cheap or expensive an overall portfolio is compared with Morningstar’s Quantitative Fair Value Estimate (which is based on the dollar amount we believe a company is worth today).
For example, the chart below maps out a few aspects of the Valuation factor exposure for Hotchkis & Wiley Large Cap Value (HWLAX):
The horizontal black lines on each bar indicate what the Valuation exposure factor of the relevant Russell 1000 Value benchmark has looked like over the past five years. (Note how the Russell 1000 Value Index itself moved back into overvalued territory in 2018.)
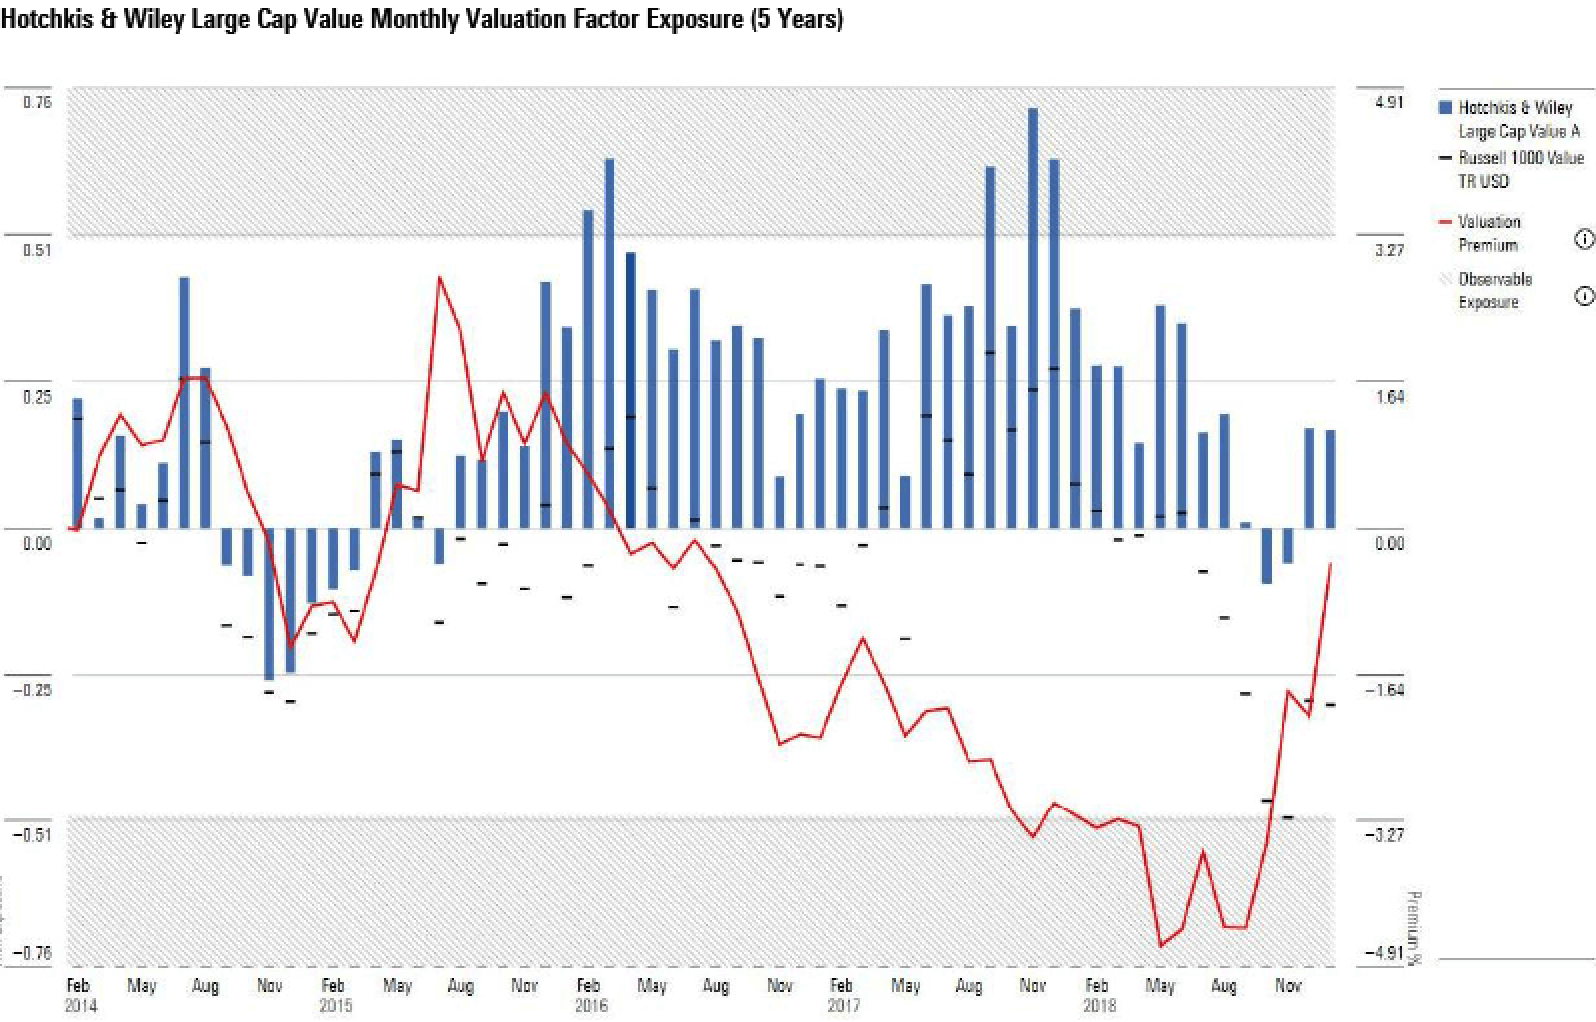
Source: Morningstar Direct℠. Data as of Dec. 31, 2018.
Another important factor when considering a portfolio’s risk exposure is its competitive advantages over similar companies. The Global Risk Model measures this with the Morningstar® Economic Moat™ Rating, which assesses the strength and sustainability of a firm’s competitive advantages.
The chart below shows how two funds in the same U.S. Large-Cap-Blend Morningstar Category can take shape differently based on this metric.
The chart also includes DFA International Small Cap Value (DISVX), which demonstrates how a fund with very few moat stocks would look.
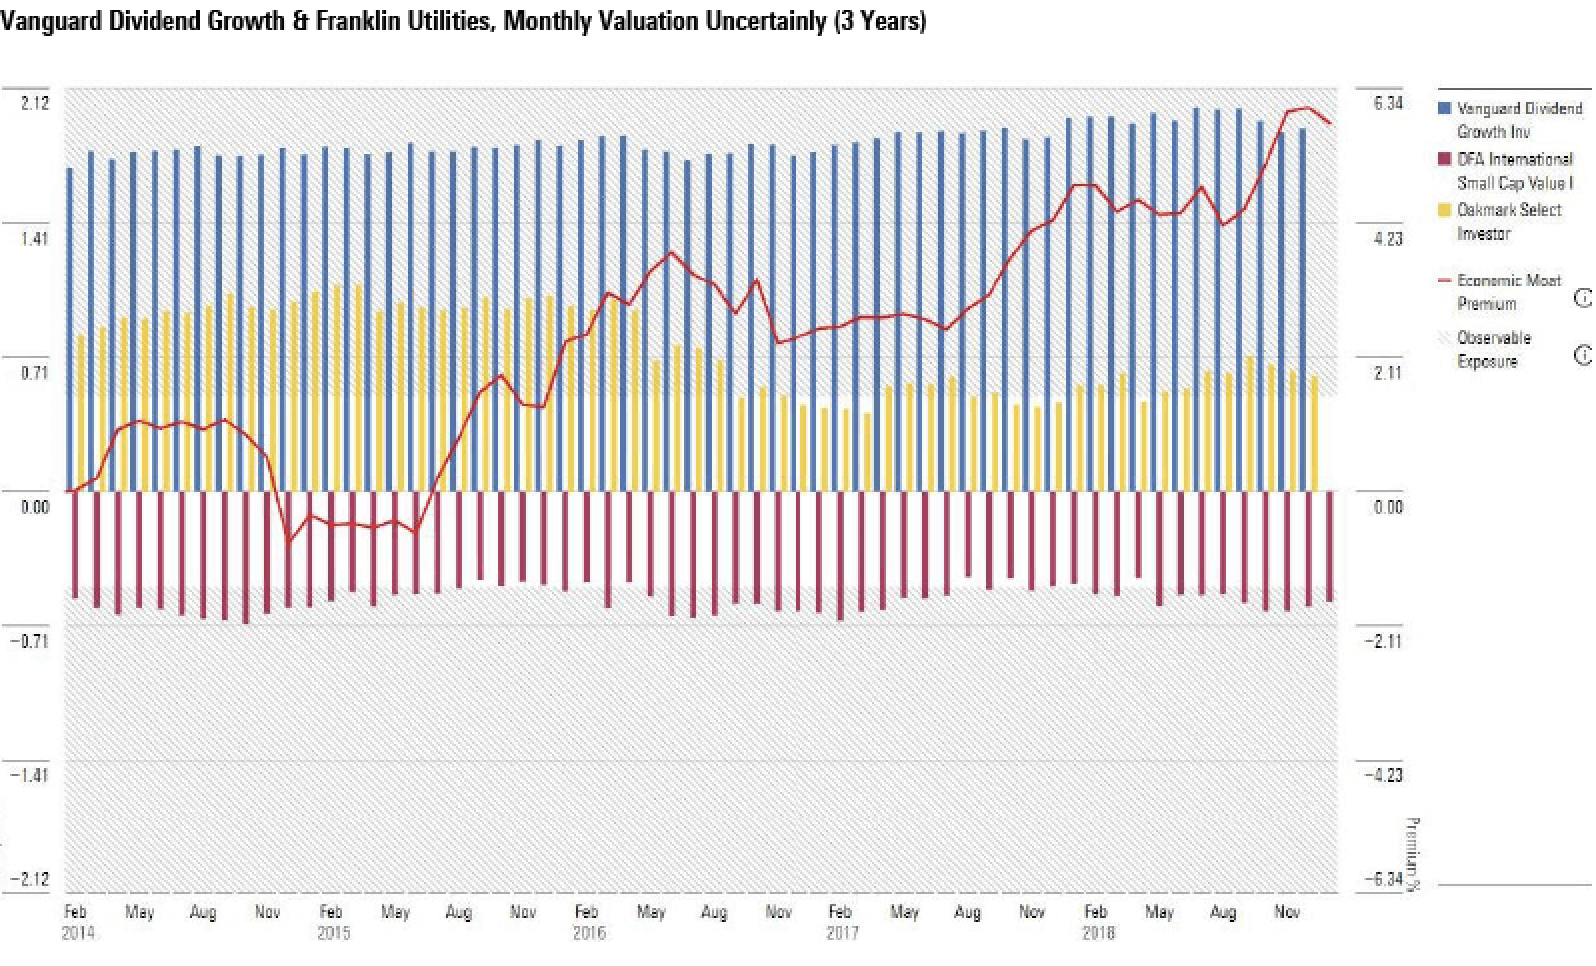
Source: Morningstar Direct℠. Data as of Dec. 31, 2018.
The Size factor measures the market capitalization of stocks in a fund’s portfolio to identify where they fall in the market-cap ladder. Take Oppenheimer Global Opportunities (OPGIX), for example, which has historically had significant exposure to the small-cap factor relative to its U.S. Fund World Small/Mid Stock Category.
As shown on the chart below, this started to change in 2017 when it moved into larger stocks following a period of strong performance that led to rapid asset growth (assets under management ballooned from around $5 billion in early 2017 to almost $10 billion at the end of June 2018).
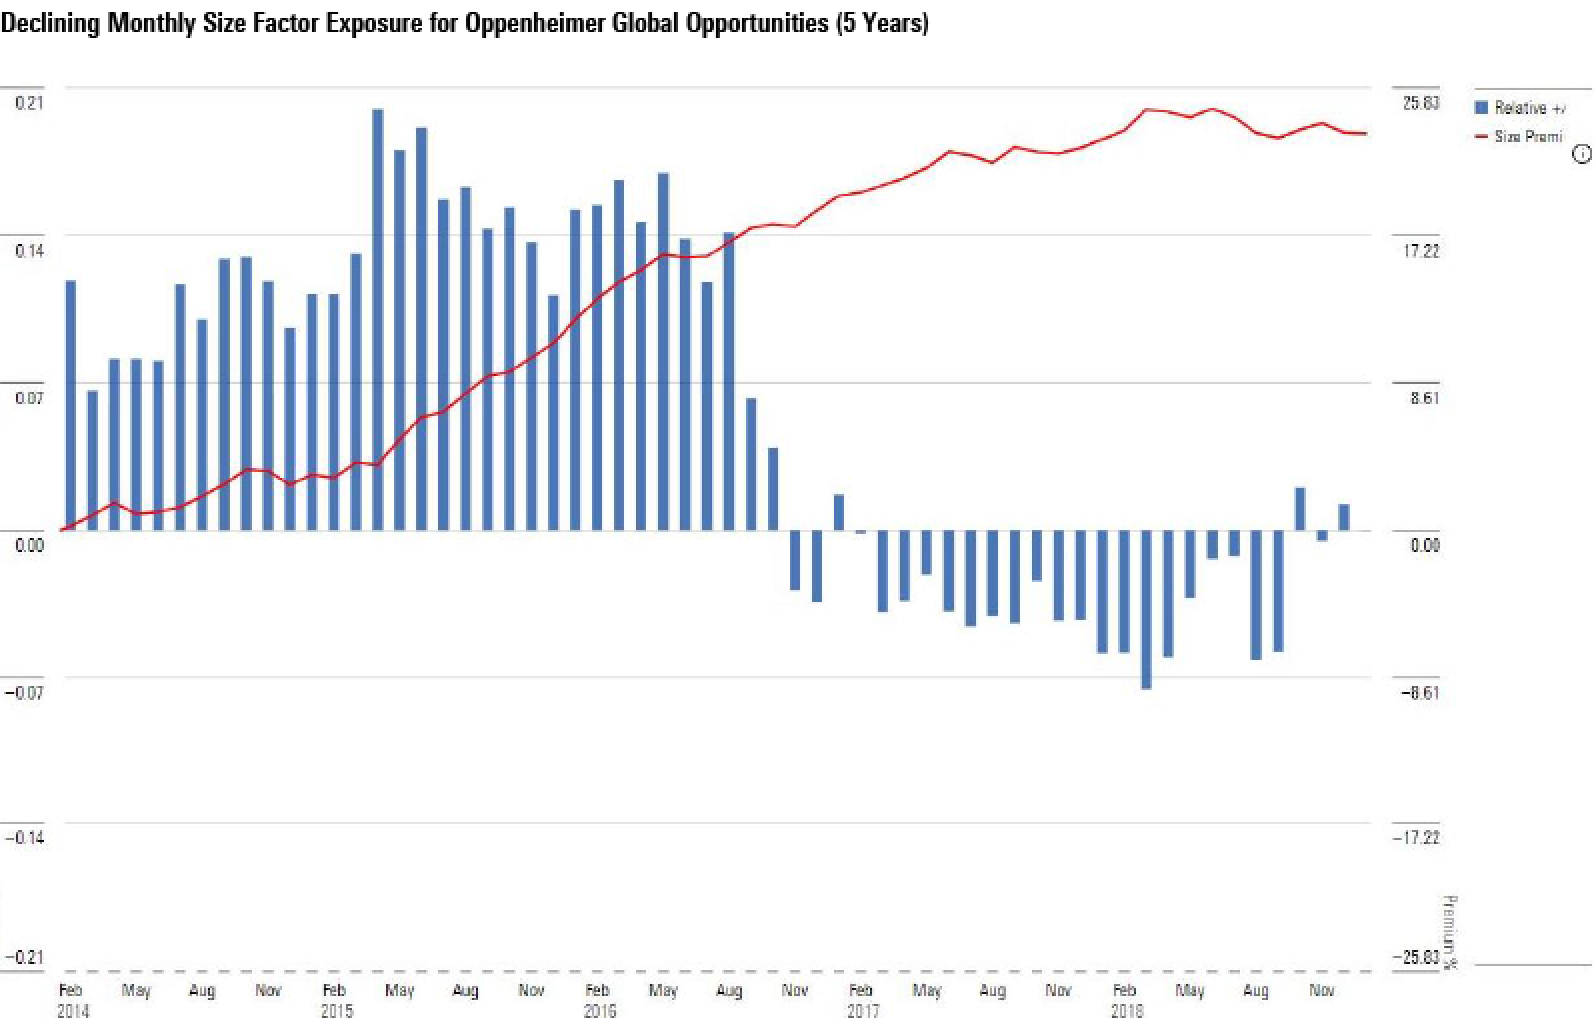
Source: Morningstar Direct℠ for Wealth Management. Data as of Dec. 31, 2018.
Researching funds requires an understanding of management’s resources, experience, financial incentives, strategy, and long-term track record, in addition to costs and the strengths of the investment organization—therefore, it serves as a key way that financial advisors can help increase their value to clients.
By understanding this data and its implications, financial advisors can help educate clients about their risk exposure and help empower them to make strategic decisions about their portfolios.
Morningstar Global Risk Model is a tool available in Morningstar Direct℠. If you’re a user, you have access. If not, sign up for a free trial.