
Funds
Key Takeaways
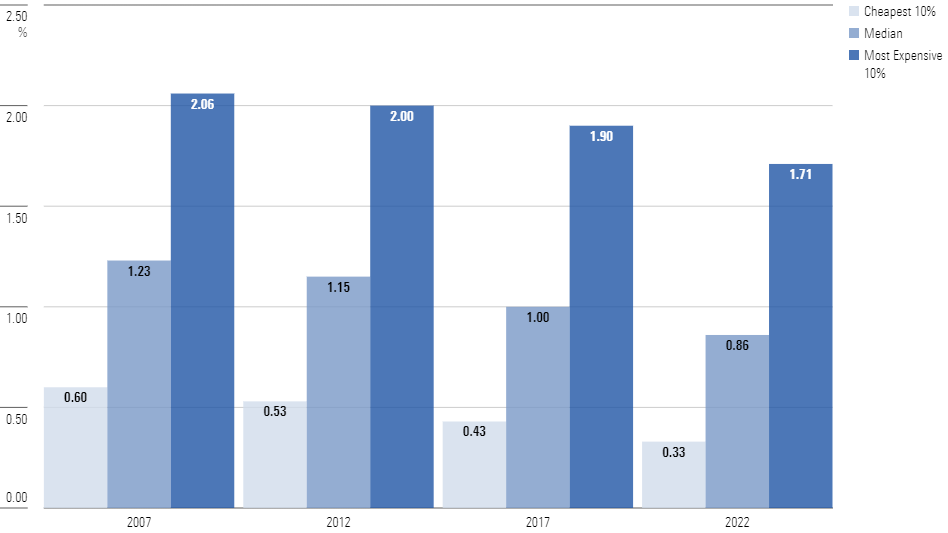
- In 2022, the asset-weighted average expense ratio of all U.S. open-end mutual funds and ETFs was 0.37% compared with 0.91% in 2002.
- The line that separates the cheapest 10% of funds from the rest has fallen 45% over the past 15 years, while the line between the most expensive 10% and the rest has come down 17%.
- The evolution of the economics of the advice business is shaping flows and fees. Morningstar's service-fee arrangement attribute can help investors recognize how they’re paying for advice.
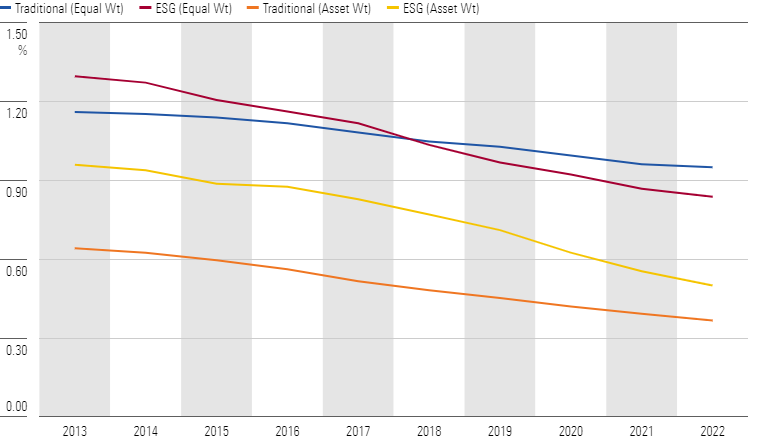
- Investors in sustainable funds are paying a “greenium” relative to investors in conventional funds.
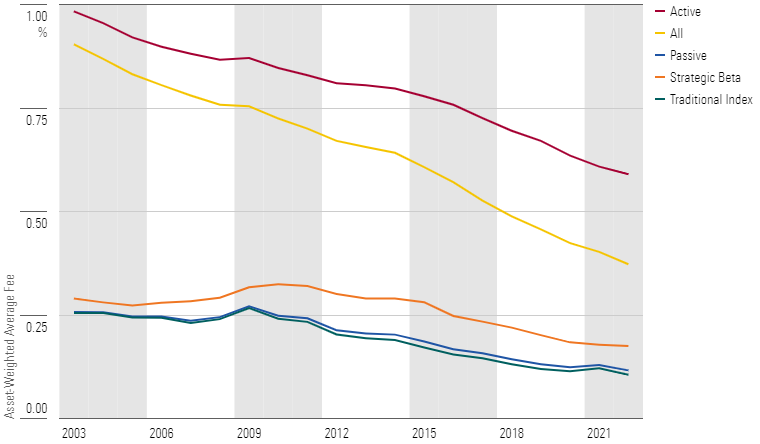
- Strategic-beta funds are an alternative to higher-cost actively managed funds. In 2022, the asset-weighted average fee for strategic-beta funds was 0.18%, higher than the figure for traditional index funds (0.12%) but significantly lower than for active funds (0.59%).
Read Time: 4 Minutes
Mutual fund and exchange-traded fund (ETF) fees are continuing to decline. In fact, investors have saved billions over the past two decades—and paid lower fund expenses in 2022 than ever before.
From evolution in the economics of advice to the increased awareness of minimizing investment costs, there are several factors that have driven fees lower. By having more insight on this ongoing decline, asset managers and financial advisors can help financially empower clients. Our Morningstar researchers take a closer look at the trend of falling mutual fund fees.
To read the full research report, download a copy here.
Report

2022 U.S. Fund Fee Study
Investors have saved billions in fund fees over the past two decades. Explore this ongoing trend and what it can mean for asset managers and financial advisors.
A Breakdown of Falling Fund Fees
Lower fund fees may be a big positive for investors. That’s because fees compound over time and diminish returns. Additionally, our study shows that 2022 was the second-largest year-over-year decline we’ve recorded dating back to 1992.
To dive deeper into declining fund fees, Morningstar researchers used both the asset-weighted average expense ratio and equal-weighted average expense ratio—which indicates what funds charge irrespective of where assets are held—as our measure. The asset-weighted average better measures the average costs borne by fund investors than an equal-weighted average because it approximates the average investors paid for the funds they invested in rather than what funds charged on average.
Here’s what asset managers and financial advisors need to know.
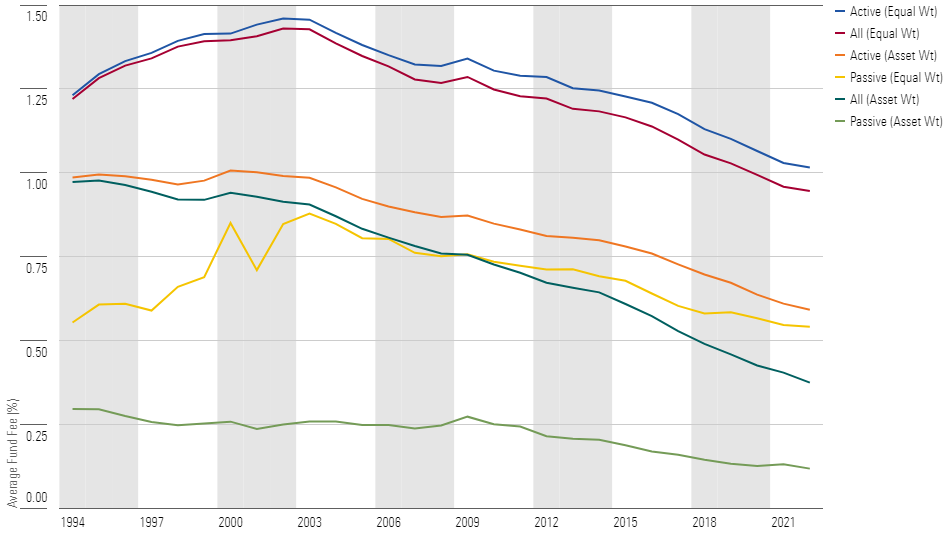
Investors favor low-cost funds
According to our research, fees are a reliable predictor of future returns. Unsurprisingly, low-cost funds generally have greater odds of surviving and outperforming their more-expensive peers.
In 2022, the gap in flows for cheap and expensive funds grew into a chasm. Of the $394 billion that flowed into the cheapest 20% of all funds and share classes, all of it went into the cheapest of the cheap: $519 billion flowed into the least costly 5% of all funds. And that’s not all: Cheap funds have gotten significantly cheaper—over the past 15 years, the line that separates the cheapest 10% of all funds from the rest has fallen 45%.
“Greeniums” play an important role
Investors in sustainable funds are paying a “greenium” relative to investors in conventional funds. However, sustainable funds’ fees have been falling on both an equal- and asset-weighted basis.
Over the past decade, the average fee charged by sustainable funds has declined 35%, while the average fee paid by investors in these funds has dropped 48%. This has been driven in large part by the introduction of low-fee sustainable index mutual funds and ETFs to the menu, many of which have gained favor with investors.
Strategic-beta funds can offer a cheaper alternative
Strategic-beta funds attempt to marry the best attributes of active and passive approaches to portfolio construction. The indexes that underpin these funds attempt to deliver strategies in a format that’s more transparent and less costly relative to most traditional actively managed funds.
The premium investors pay for strategic-beta funds has narrowed in recent years as fee competition has spilled over from the realm of traditional index funds into strategic-beta ones and investors have continued to allocate the bulk of their assets to the least costly options.
Stay One Step Ahead
Staying informed about fund fee trends is critical to making the best decisions for your clients. Morningstar Notebooks, a new analytics capability of Morningstar Direct, helps you identify and respond quickly to different trends. The U.S. Fund Fee Trends notebook allows users to filter the fund universe and isolate trends specific to their needs. And the data can be surfaced using many of the same visualizations used in the research report.
This interactive, web-based platform gives you access to pre-built notebooks that simplify complex analytics—saving you time so you can focus on delivering high-value strategies.