
First-Quarter Returns Positive Despite Banking Crisis and Fears of Recession
Positive results for many equity and fixed-income indexes have ignited hope that doom-and-gloom forecasts may have been overly pessimistic.


Markets were rattled by a banking crisis in March 2023, as two regional banks failed in the United States and global banking giant Credit Suisse collapsed and was taken over by rival UBS UBS in Switzerland. Despite these considerable setbacks, the S&P 500 returned 7.5%, and the GDPNow estimate from the Federal Reserve Bank of Atlanta placed U.S. gross domestic product growth at 2.5% in the first quarter. International markets have proved similarly resilient.
The Federal Reserve was forced to add financial stability, in addition to inflation, to its current list of concerns. Nonetheless, it persisted on the tightening path, raising rates by 0.25% in March. Fixed-income investments generally performed well and ended the first quarter in positive-return territory. The banking crisis sent investors into a panic and drove them into lower-risk assets. As a result, money market funds received $439 billion, their second-largest quarterly inflow since the first quarter of 2020, when the coronavirus pandemic began, while deposits fled traditional bank accounts.
Fair equity returns, stable GDP growth, robust employment, and strong consumer spending are the few silver linings to an otherwise uncertain landscape. There may be some more stumbling blocks in 2023, and a slowdown or even a recession cannot be ruled out completely. For now, however, despite all the volatility in the first quarter, the U.S. economy has held up.
Every quarter, Morningstar’s quantitative research team reviews the most recent U.S. market trends and evaluates the performance of individual asset classes. We then share our findings in the Morningstar Markets Observer, a publication that draws on careful research and market insights. (Morningstar Direct and Office clients can download the report here.)
Here are some of the findings from our latest quarterly market review.
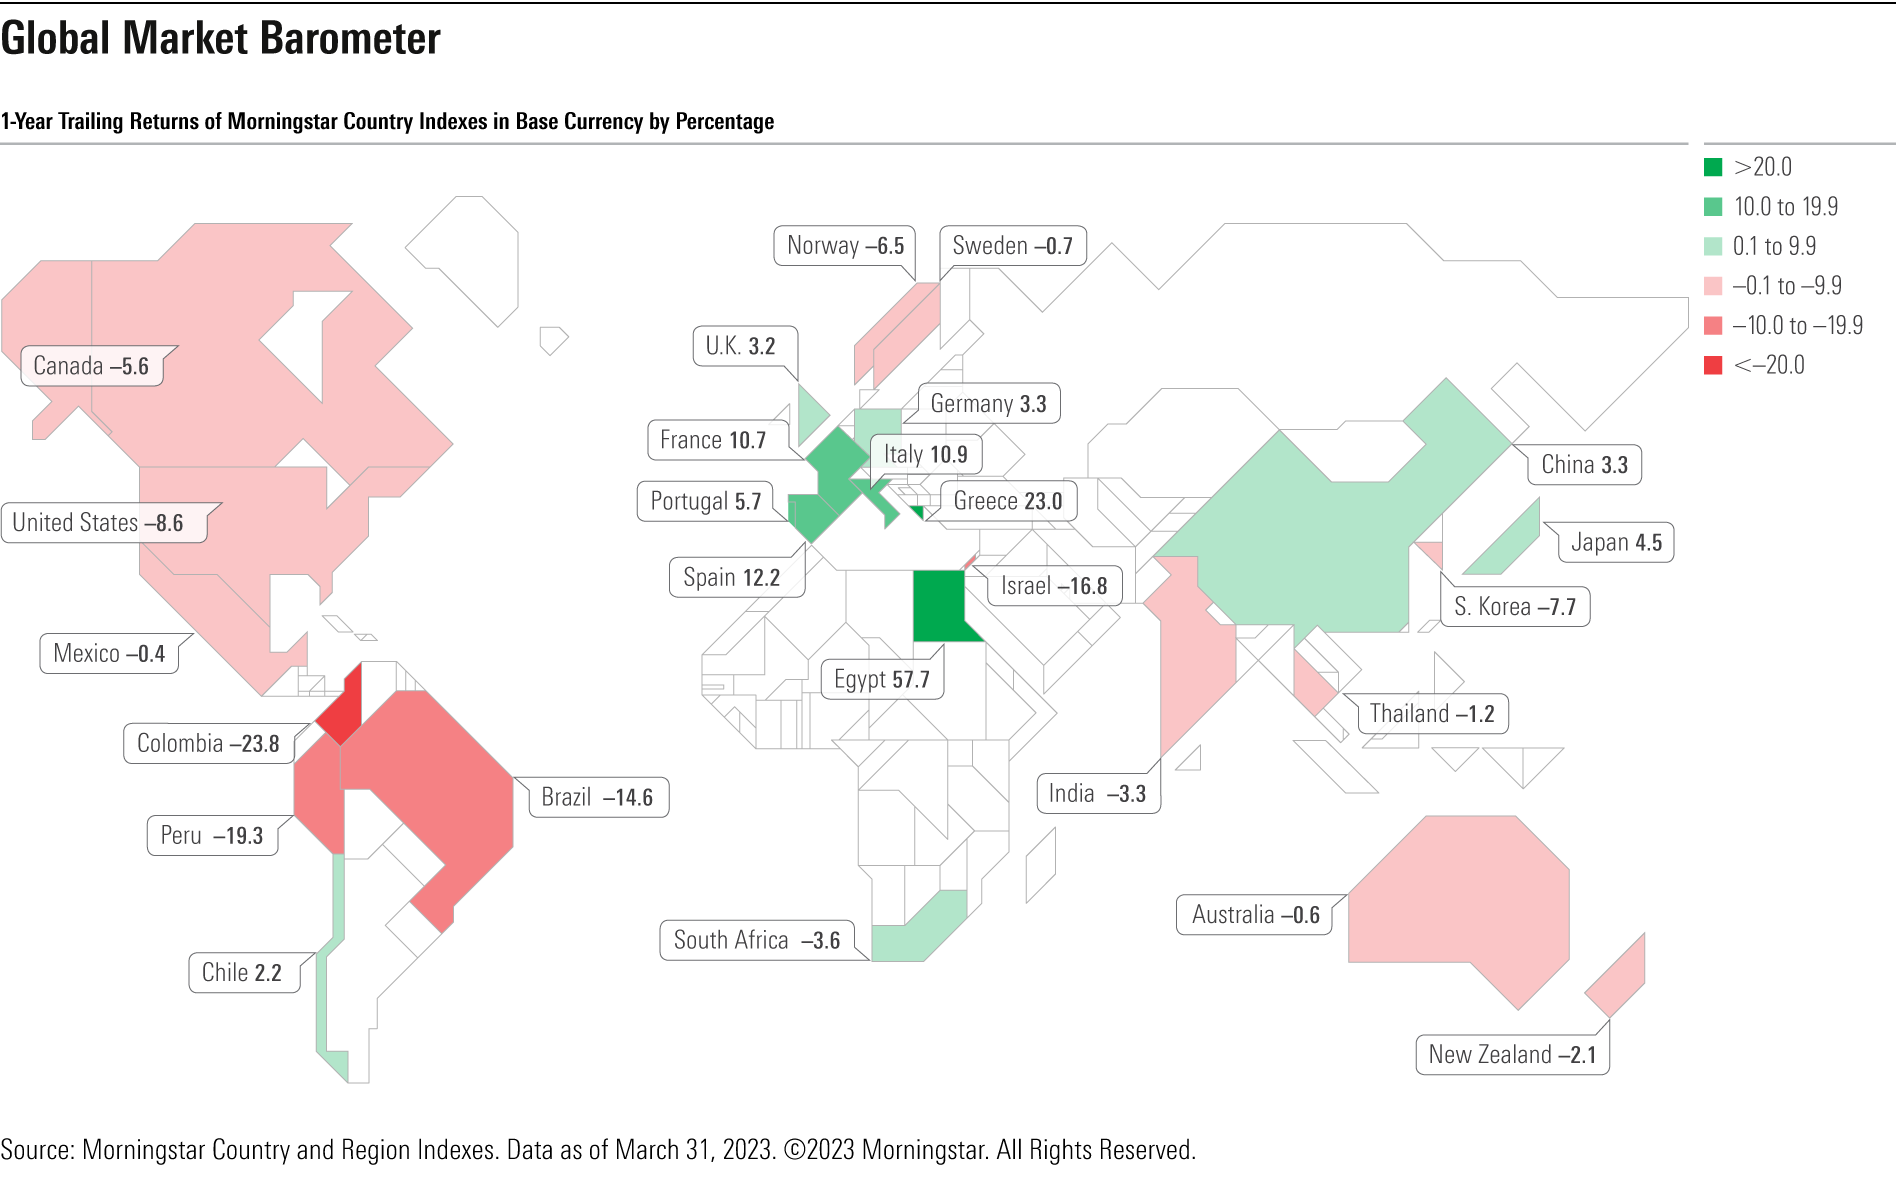
Global Market Barometer
For most equity markets around the world, the story of the trailing one year was two quarters of decline followed by two quarters of recovery. Inflation remained elevated across the globe, though it continued to decelerate in most markets.
As shown on the chart below, the recovery seen in Europe may have been the most remarkable: a year after Russia’s invasion of Ukraine threw the region into turmoil, equities were up in most of its countries. Egypt, for its part, can attribute its 57.7% return to extreme currency depreciation.
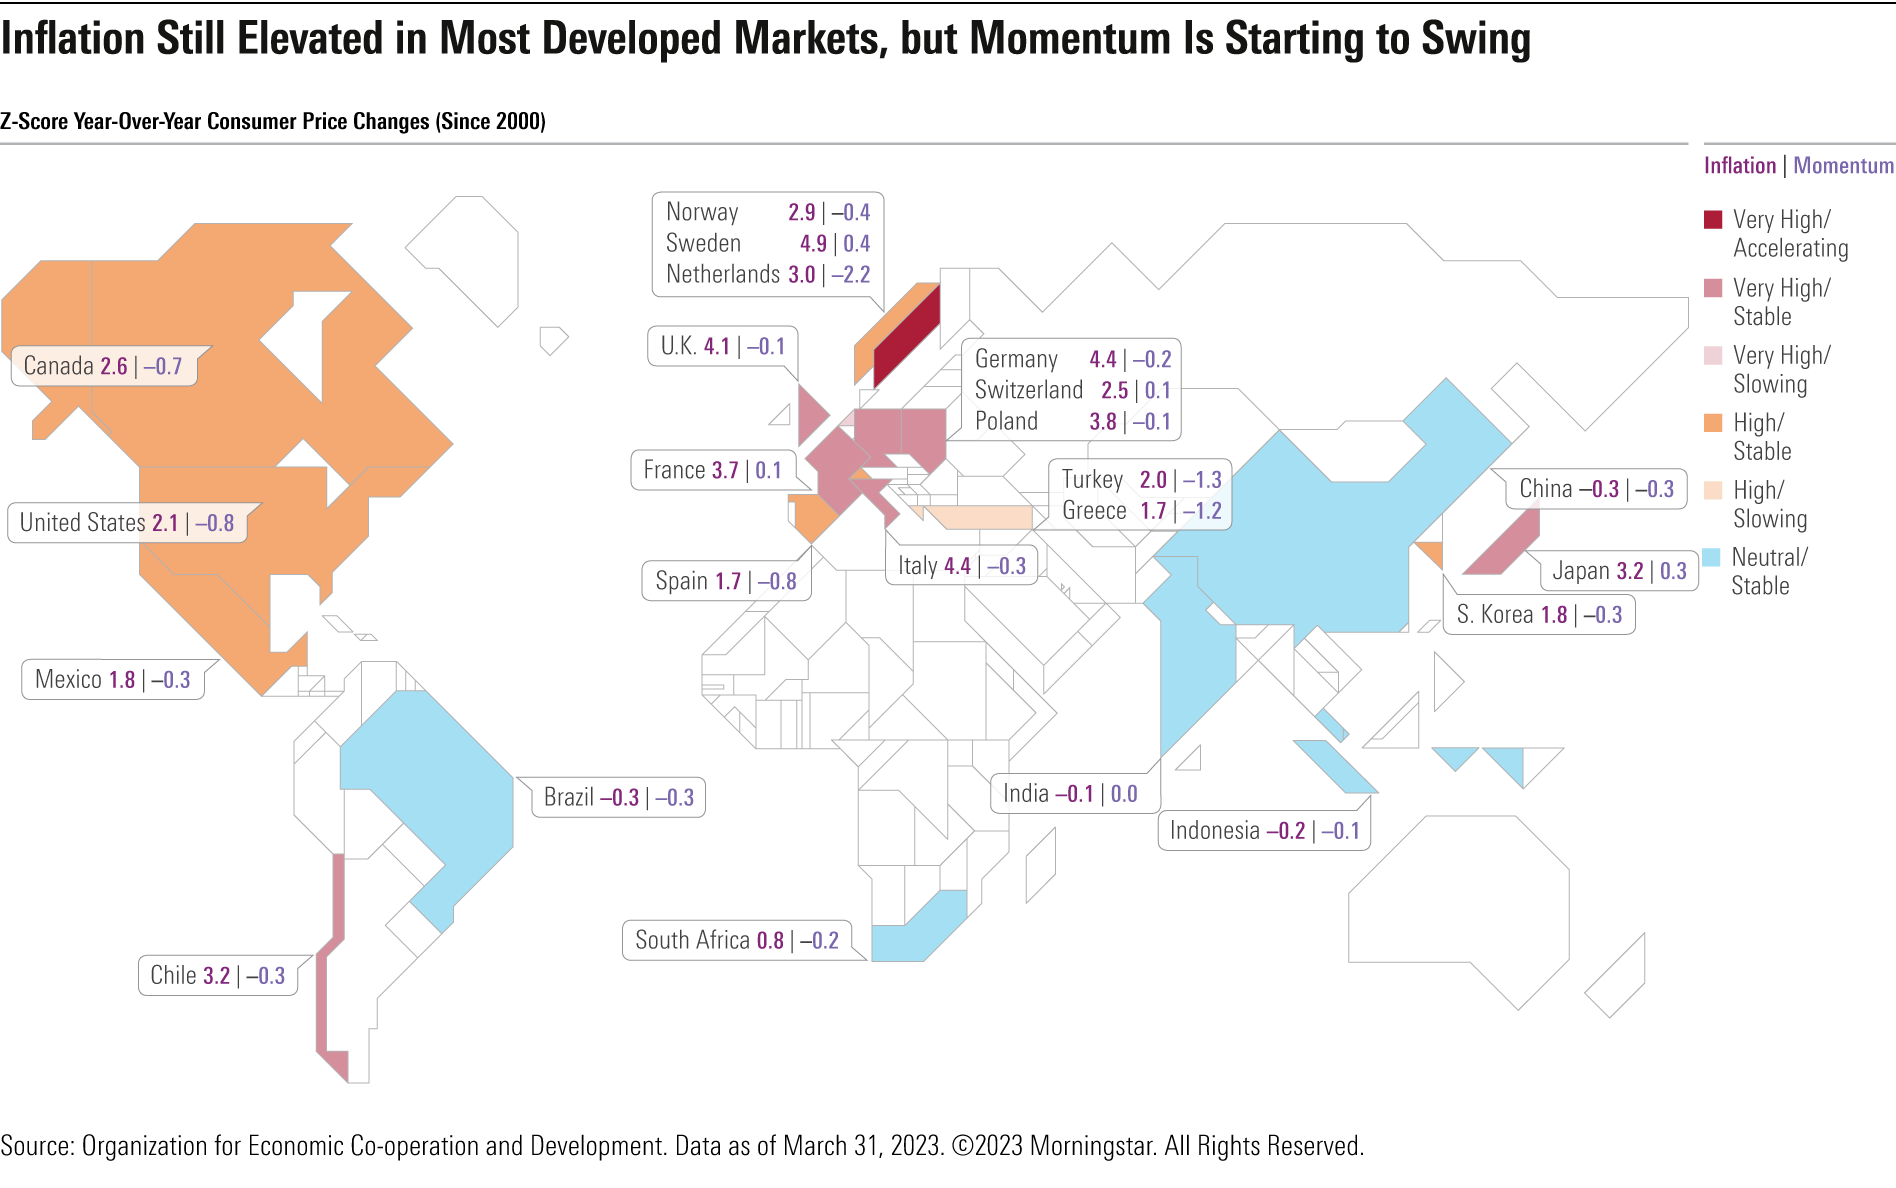
Inflation Still Elevated in Most Developed Markets, but Momentum Is Starting to Swing
In the chart below, the first (red) number shows consumer price inflation in standard deviations above or below the mean since 2000. The second (purple) number is the three-month change in the first number, a measure of inflation momentum.
By these metrics, Europe is facing the most severe inflation pressure—in some cases 4-5 standard deviations above normal, and with positive momentum to boot. Japan’s situation is similar, while North America looks relatively more benign as momentum slowed in the fourth quarter.
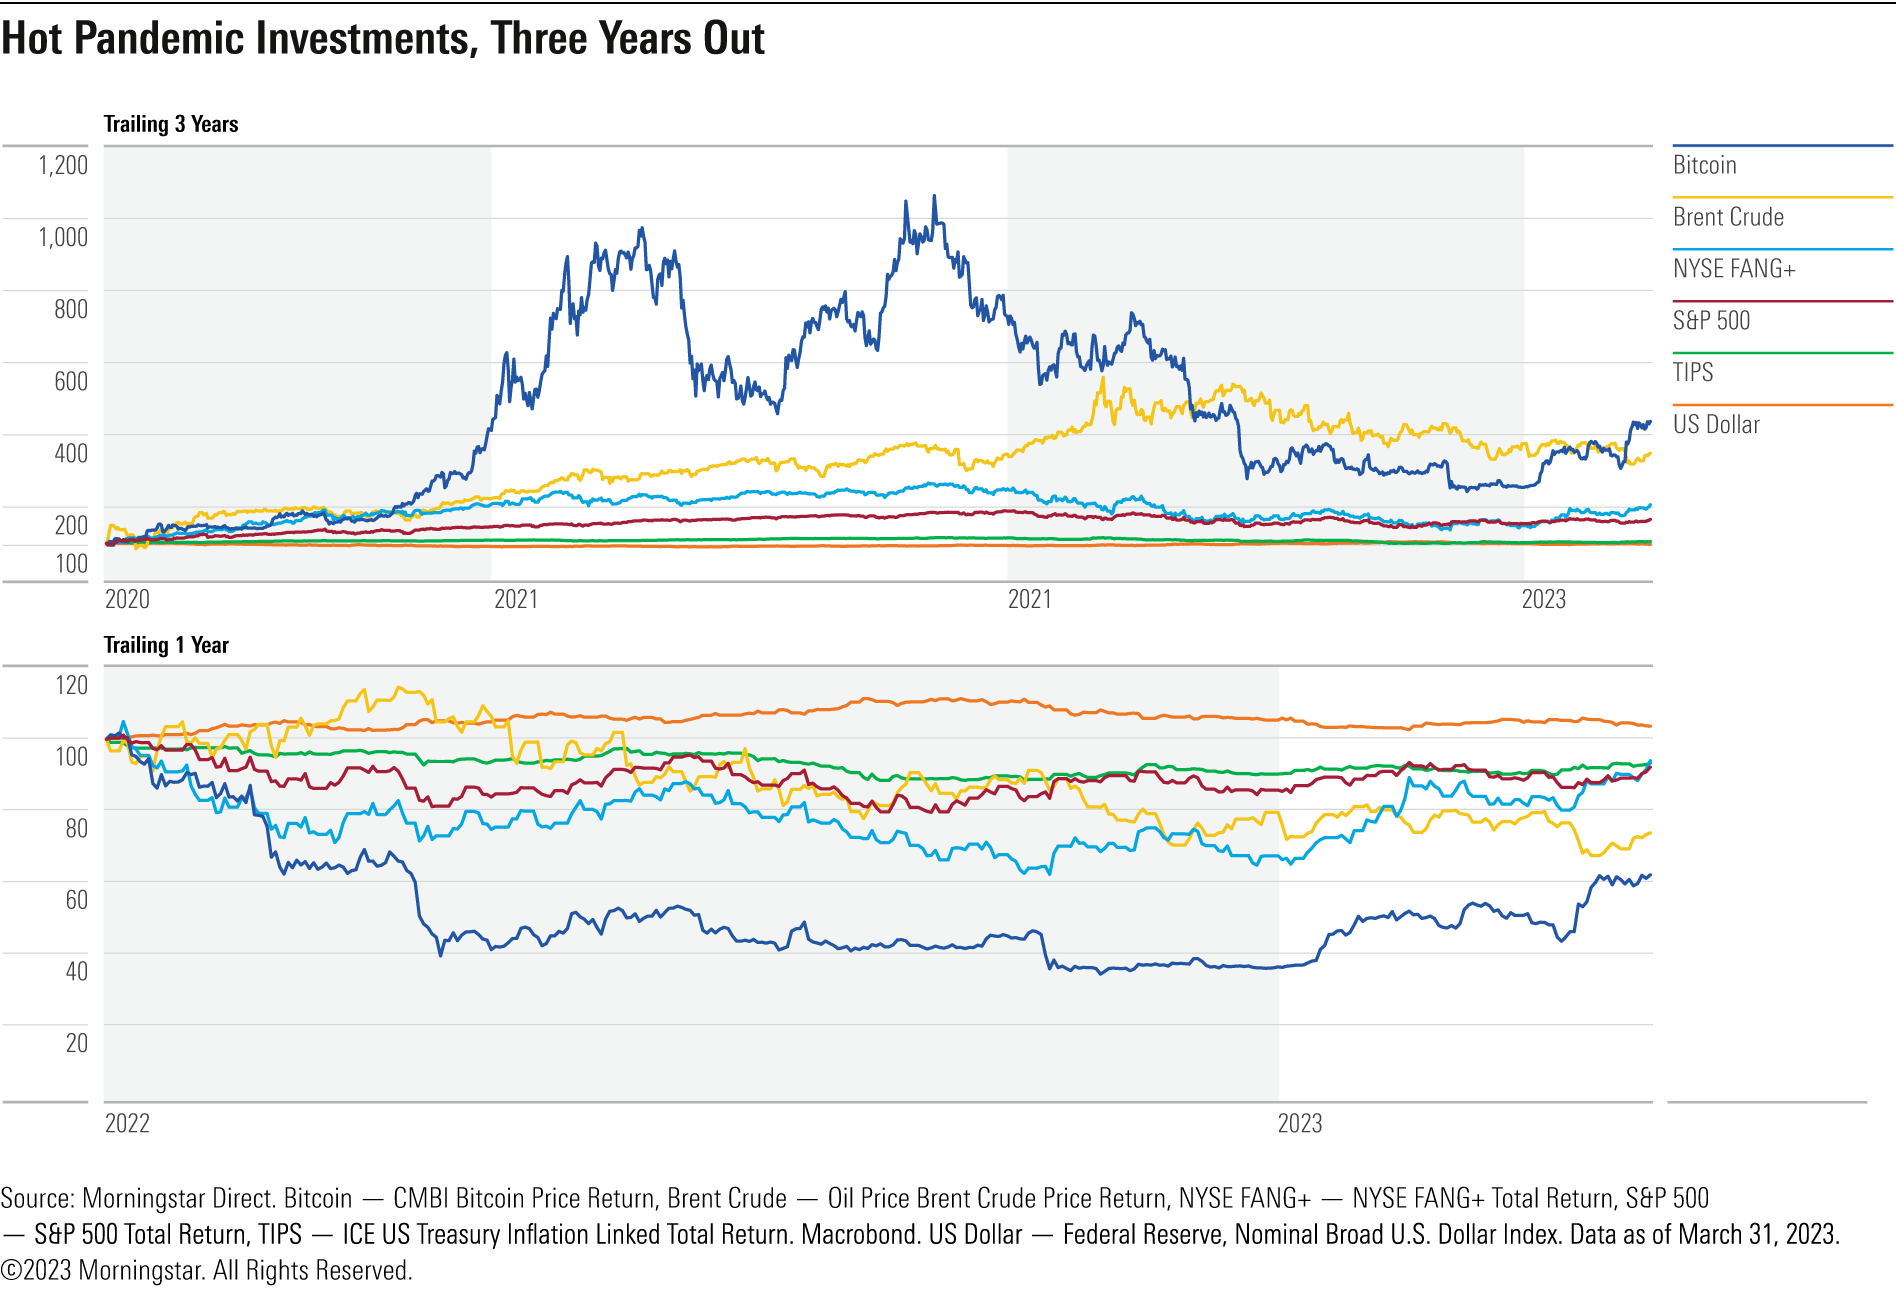
Hot Pandemic Investments, 3 Years Out
Many investments have had their moment in the sun since the pandemic broke out three years ago. From bitcoin to oil to meme stocks, each quarter seemingly revealed yet another investment du jour.
The chart below shows the volatility of such investments since the market’s bottom in late March 2020 and in the trailing one year. This shows that investors who made these investments earlier have fared far better than those who did so only a year ago. It should be noted that meme stocks like GameStop GME and AMC Entertainment AMC were too volatile to fit on one page.
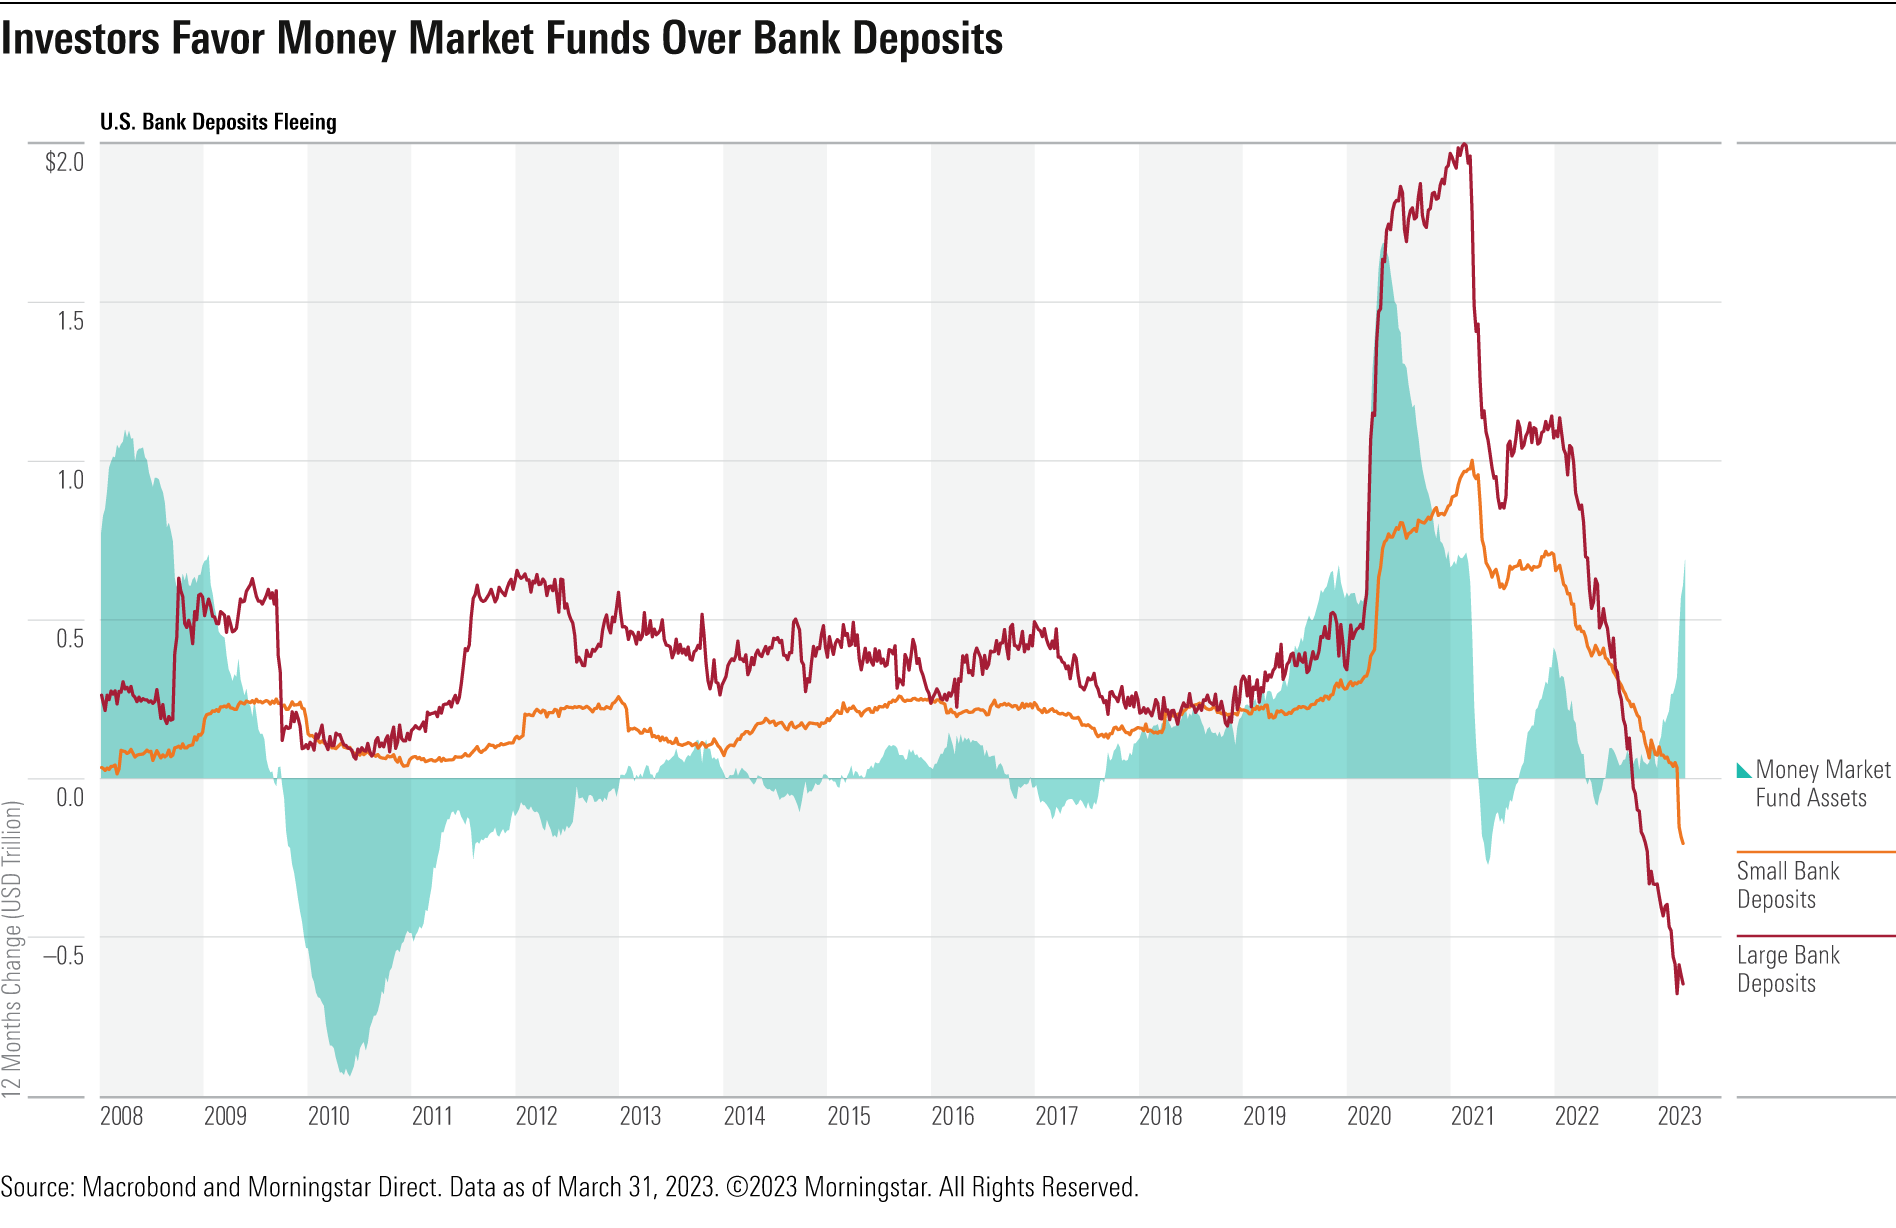
Investors Favor Money Market Funds Over Bank Deposits
Investors moved their assets into higher-yielding money market accounts in 2023, as consumers pulled their money from their bank accounts for the first time since the global financial crisis in search of higher interest rates.
Spikes in deposits have typically been associated with market volatility, such as in 2020 during the coronavirus pandemic. Although the U.S. regional bank failures in the first quarter of 2023 accelerated this trend, deposits were already fleeing in favor of safe, higher-yielding funds.
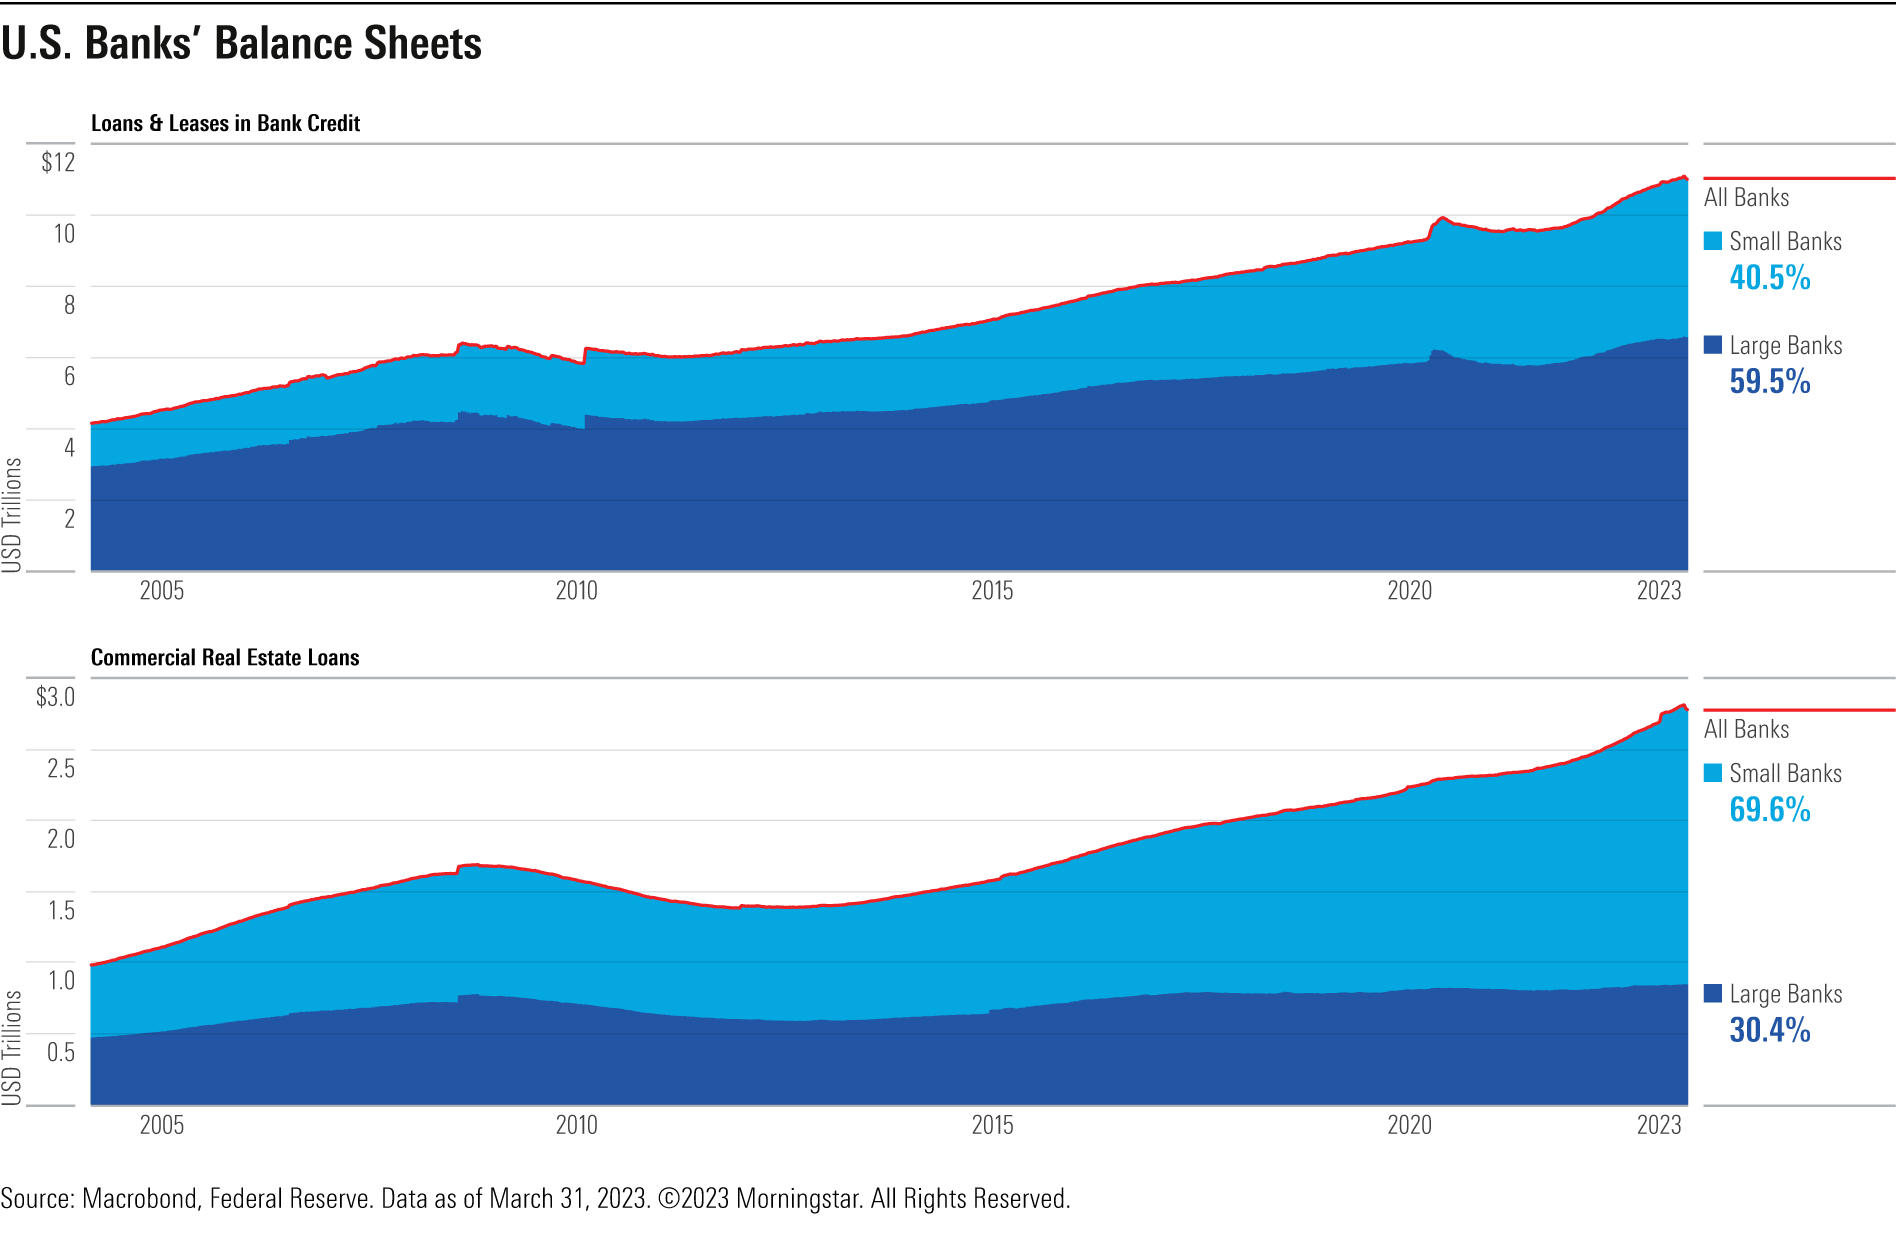
U.S. Banks’ Balance Sheets
Small regional banks have borne the brunt of the U.S. banking crisis sparked by Silicon Valley Bank’s bankruptcy, and their issues may get even worse in the near future.
As shown below, these banks issue an outsize share of the country’s commercial real estate loans, many of which are in trouble given the rising rate environment, increasing prevalence of online shopping, and increasingly prominent hybrid work models.
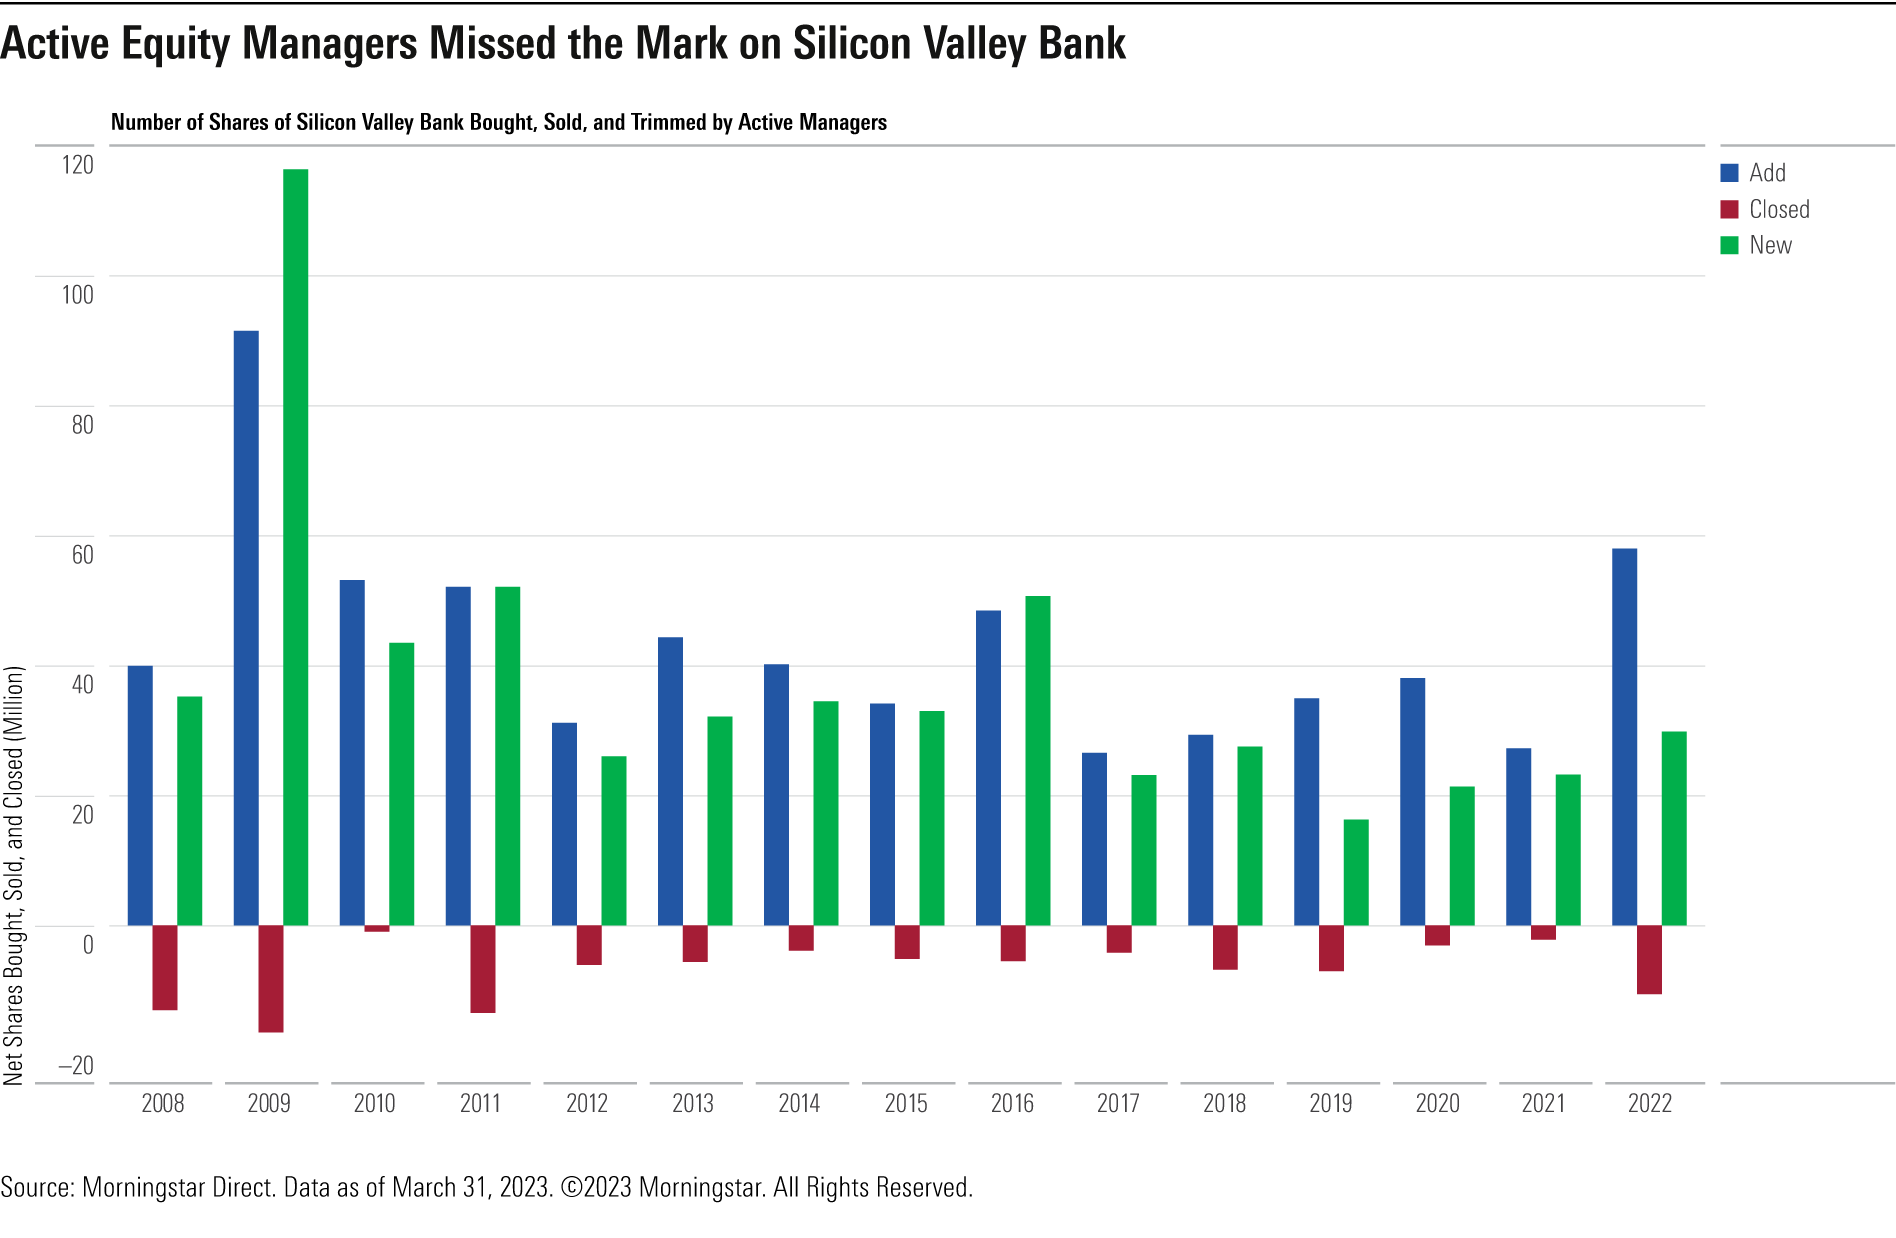
Active Equity Managers Missed the Mark on Silicon Valley Bank
Active equity managers were, on average, heavy buyers of Silicon Valley Bank in 2022, as many investors saw it as uniquely knowledgeable of small startups that had seen over a decade of success.
The chart below shows that before the regional bank’s collapse on March 10, 2023, few managers were net sellers of their positions in it. This meant that a few managers that had held the bank for over a decade saw their gains get completely wiped out. The bankruptcy caught the active management world completely off guard.
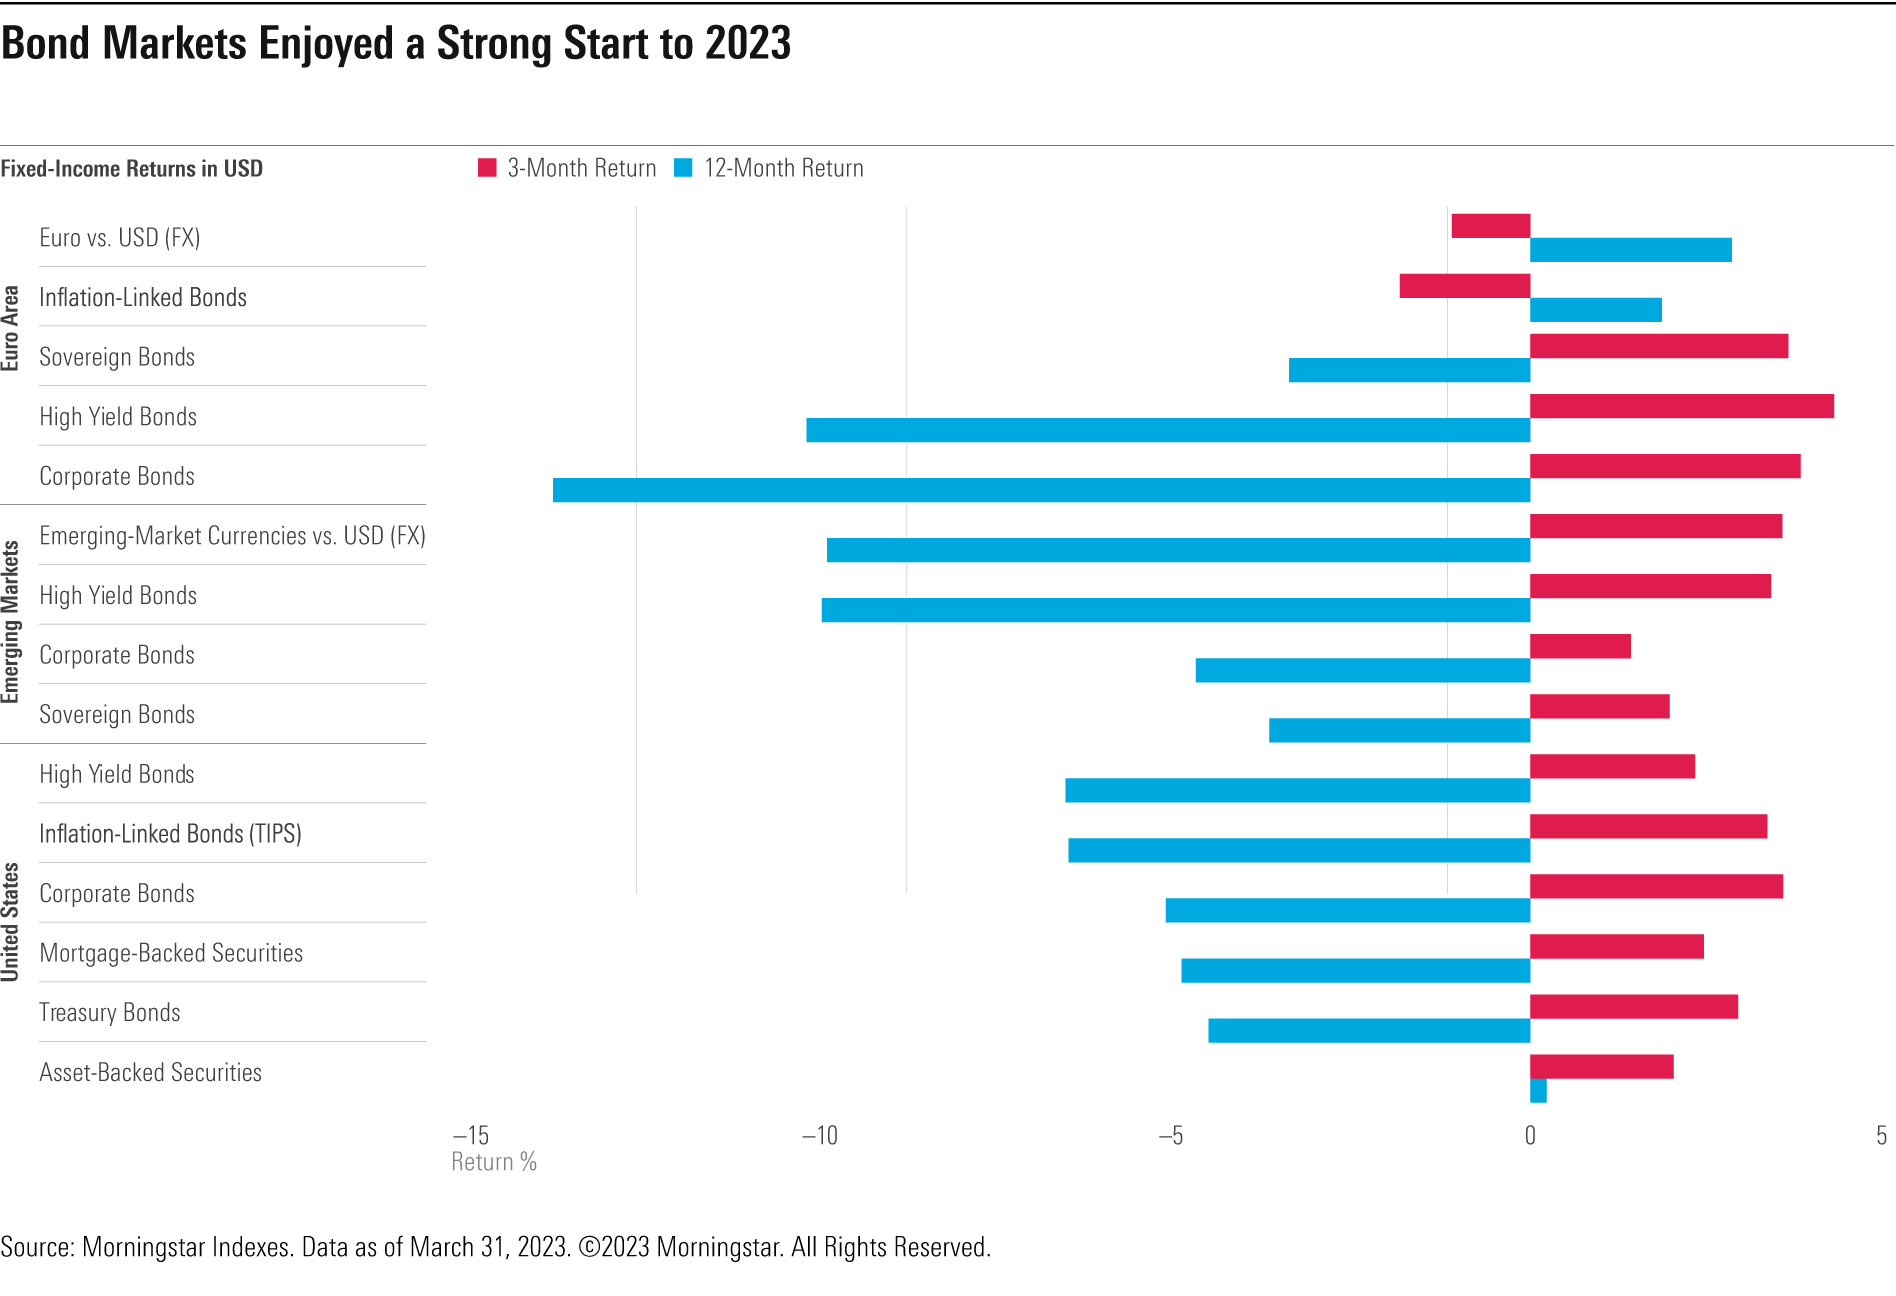
Bond Markets Enjoyed a Strong Start to 2023
Most major Morningstar fixed-income indexes eked out choppy gains at the close of 2023′s first quarter. In what proved to be a volatile quarter for both interest rates and credit markets, fixed-income investors who stayed the course likely fared better as returns were mostly positive across the board.
While inflation fears persisted, riskier assets like high-yield bonds and emerging-markets currencies managed to pare back some of the losses they sustained over the past year.
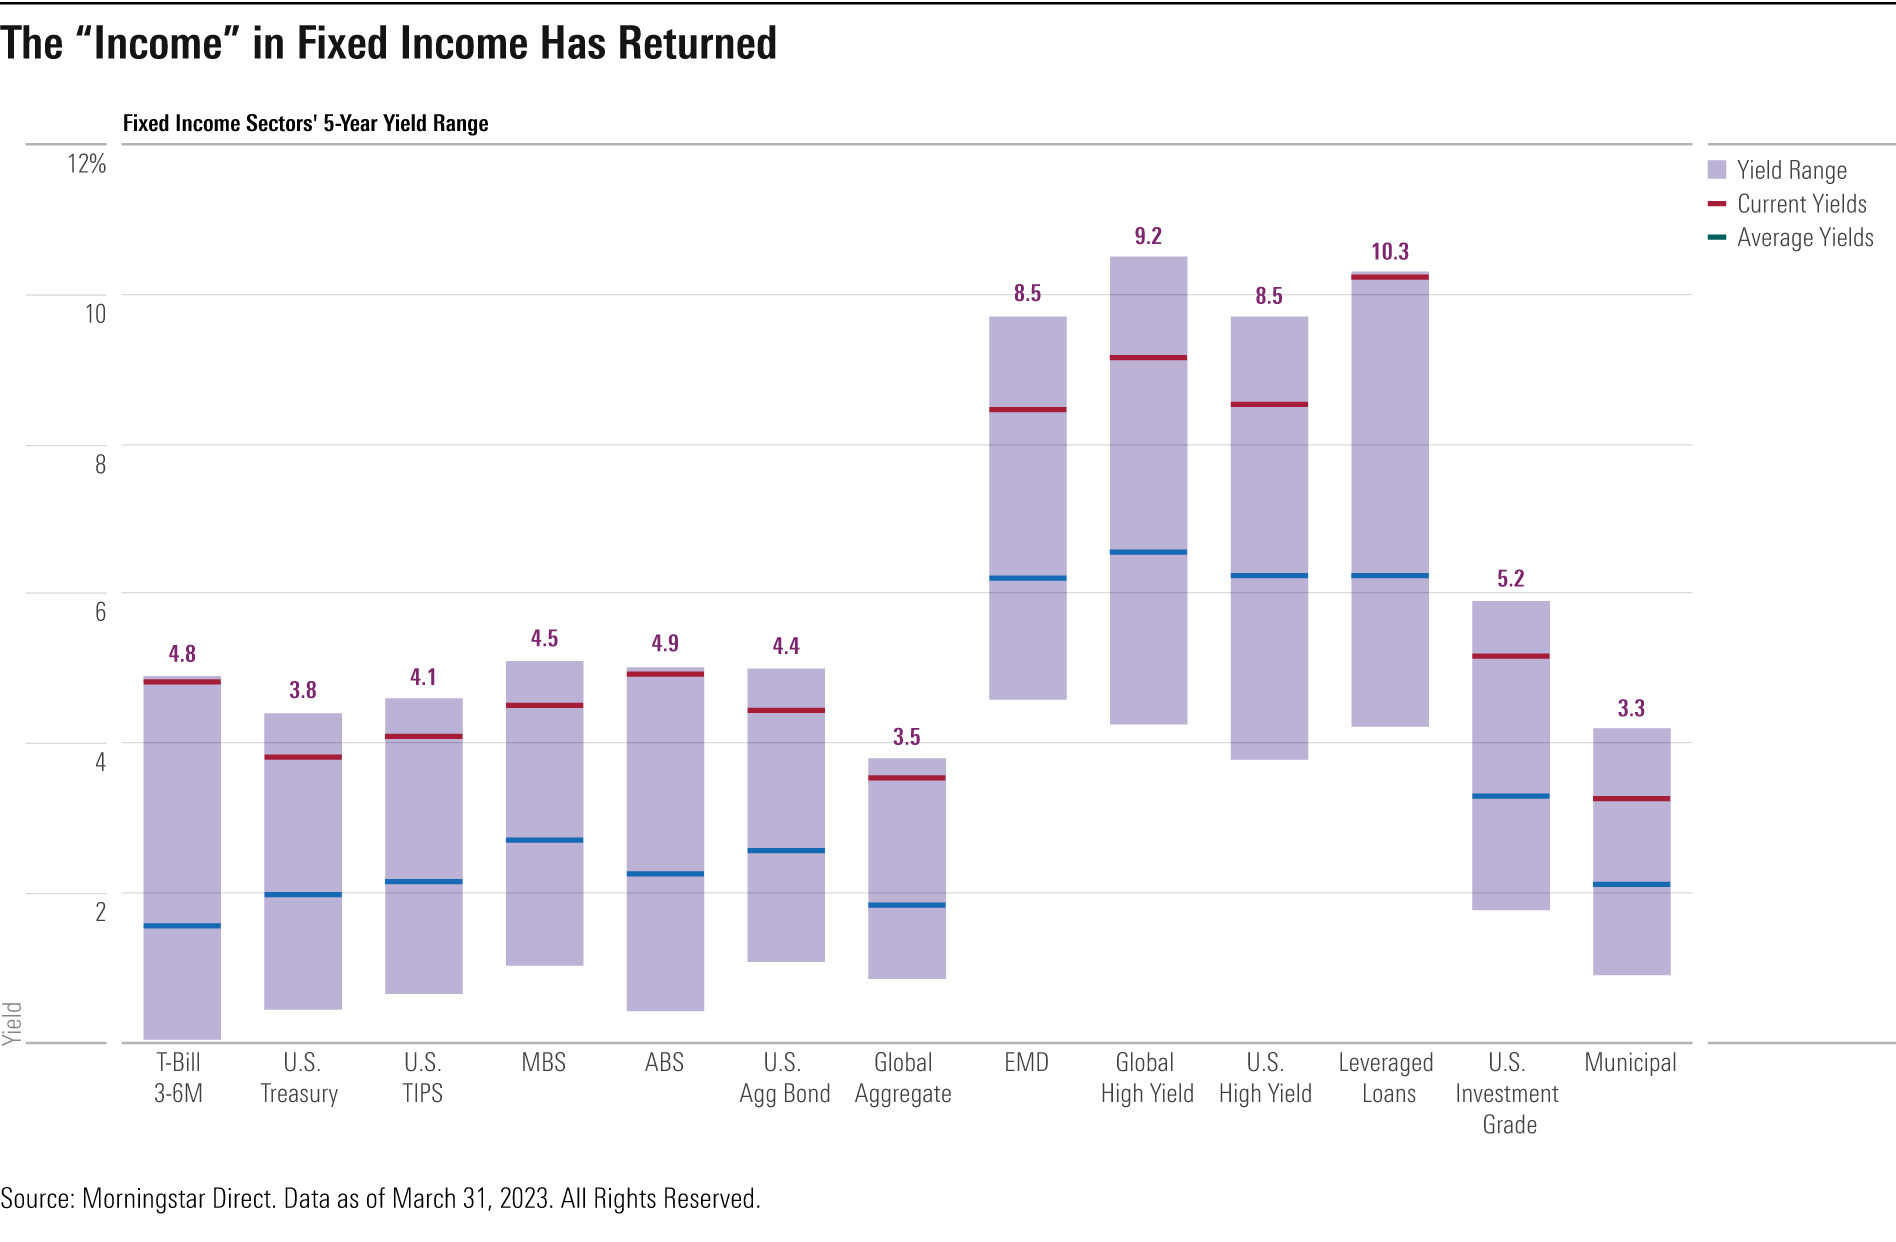
The ‘Income’ in Fixed Income Has Returned
All major fixed-income sectors are currently offering income levels that investors have not enjoyed in years.
As bond prices were crushed during 2022′s interest-rate volatility, yields soared well above their five-year averages. The prospect of continuing Fed tightening and credit fears have kept Treasury bills and leveraged loans at depressed prices, while most other sectors have seen modest rallies amid slightly cooler inflation data.
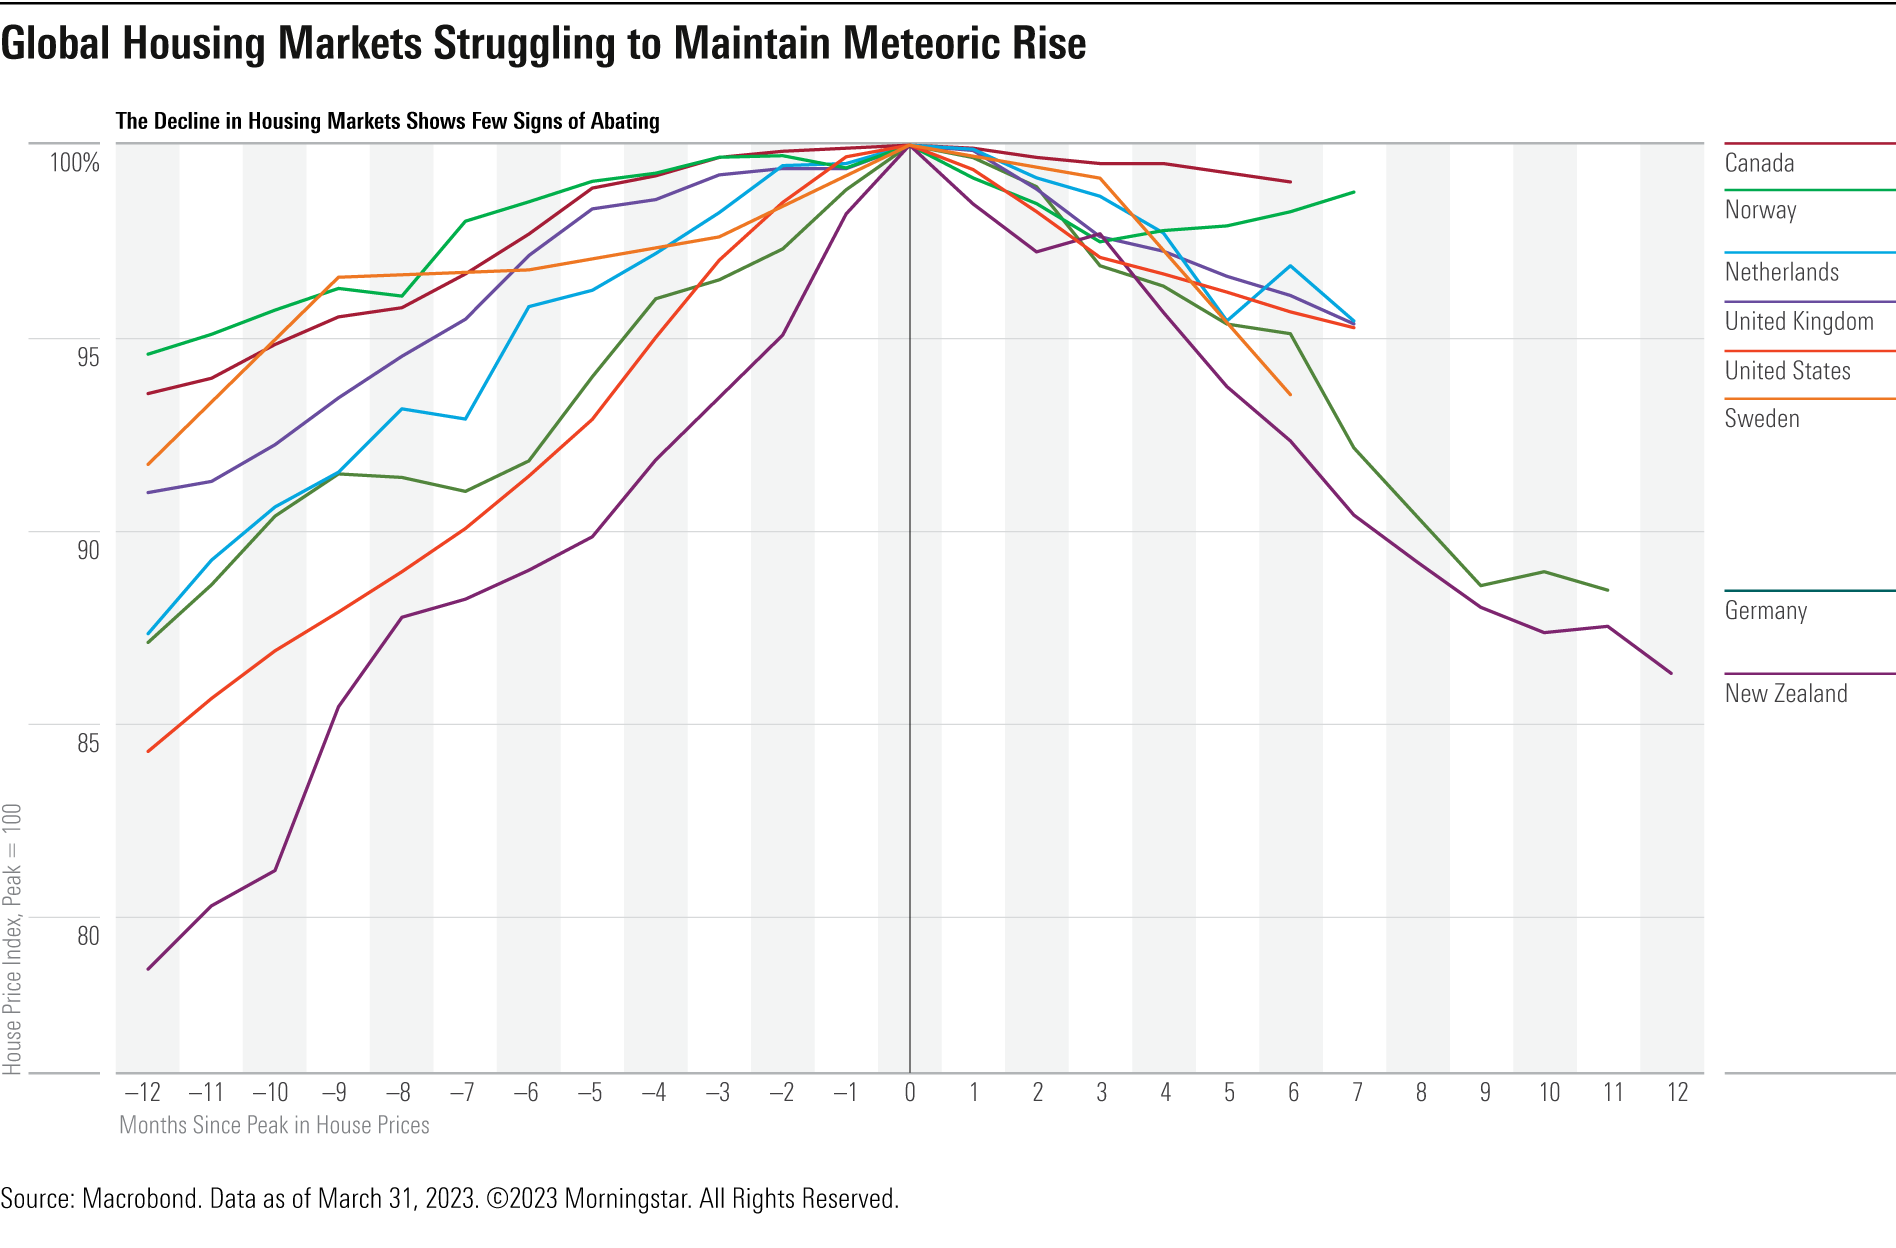
Global Housing Markets Struggling to Maintain Meteoric Rise
Across most developing economies, higher interest rates and the more expensive mortgage payments that follow are starting to take their toll on housing markets.
As shown below, housing starts, transactions, and prices are all contracting in many countries. In the U.S., a further hit could come from the recent bout of banking turmoil, which may cause smaller banks to tighten lending standards.
The author or authors do not own shares in any securities mentioned in this article. Find out about Morningstar’s editorial policies.
/cloudfront-us-east-1.images.arcpublishing.com/morningstar/AGAGH4NDF5FCRKXQANXPYS6TBQ.png)
/cloudfront-us-east-1.images.arcpublishing.com/morningstar/ZYJVMA34ANHZZDT5KOPPUVFLPE.png)
/cloudfront-us-east-1.images.arcpublishing.com/morningstar/QFQHXAHS7NCLFPIIBXZZZWXMXA.jpg)