
Top 10 Holdings of Our Ultimate Stock-Pickers’ Index
Actively managed U.S. large-cap funds continued to lag in 2022.

/s3.amazonaws.com/arc-authors/morningstar/e03383eb-3d0b-4b25-96ab-00a6aa2121de.jpg)
Each year, fund investors would like to see the manager of the actively managed funds they own beat the market, but they’ve been left wanting for well over a decade. The lack of consistent outperformance by large-cap active managers (the main contributors to the Ultimate Stock-Pickers concept) has been well documented by Morningstar’s Active/Passive Barometer. It’s a cutthroat world out there for active managers. For the 20 years ending June 2022, just 2.3% of active funds in the large growth category have managed to survive and outperform their average passive peer.
Actively managed foreign stock funds struggled especially during the year through June 2022, falling to a 23% one-year success rate from 37% in 2021. The U.S. active fund one-year success rate was over 45% midway through the year (43% in 2021), as active mid- and small-cap funds delivered 48% and 55% success rates, respectively, besting large caps’ lingering 40% rate. Long-term success rates were lowest among U.S. large-cap funds compared with foreign-stock, real estate, and bond funds.
In 2022, economic, geopolitical, and logistical headwinds tested the narrative that active funds are generally better able to navigate market volatility and capitalize on uncertainty in down markets than their passive peers. But the data showed that there’s little merit to this notion. Across all 20 categories we examined, just 40% of the nearly 3,500 active funds included in our analysis survived and outperformed their average passive counterpart.
The cheapest funds succeeded about twice as often as the priciest ones (a 32% success rate versus a 19% success rate) over the 10-year period ended June 30, 2022. This not only reflects cost advantages but also differences in survival, as 65% of the cheapest funds survived, whereas 57% of the most expensive did so.
Over the long haul, actively managed U.S. large-cap equity funds have generally succeeded less often than active U.S. mid- and small-cap funds. Over the decade through June 30, 2022, this narrative continued. Over that span, nearly 10.7% of active large-cap funds lived and outperformed their average passive peer versus 24.7% and 31.7% for active mid-cap and small-cap funds, respectively.
It’s worth noting that we devised the Ultimate Stock-Pickers concept as a stock-picking screen, not as a guide for finding fund managers to add to an investment portfolio. Our primary goal has been to identify a sufficiently broad collection of stock-pickers who have shown an ability to beat the markets over multiple periods (with an emphasis on longer-term periods). We then cross-reference these managers’ top holdings, purchases, and sales against our own stock analysts’ recommendations regularly, allowing us to uncover securities that investors might want to investigate further. There will always be limitations to our process. We try to focus on managers that our fund analysts cover and on companies that our stock analysts cover, which reduces the universe of potential ideas that we can ultimately address in any given period. This emphasis is also the main reason why we focus so much attention on large-cap fund managers, as they tend to be covered more broadly on the fund side of our operations, and their stock holdings overlap more heavily with our active stock coverage. That said, by limiting themselves to the largest and most widely followed companies, our top managers may miss out on some big ideas on small companies that have the potential to generate greater outperformance in the long run.
Overall, 2022 proved to be a challenging year for stocks, as investor optimism following the COVID-19 pandemic quickly dissipated. Just as the market was looking to slowly recover as pandemic restrictions were lifted and a return to normality began, the Russian invasion of Ukraine in February 2022 threw another wrench into the global economy and an already backlogged supply chain, elevating energy prices and creating inflationary pressures that have deeply impacted food and energy markets. In tandem with rolling lockdowns in China, elevated input costs have pressured firms’ margins and have eaten into consumers’ pocketbooks. In response, the Fed has already raised the federal-funds rate to a range between 4.25% and 4.50%, from near-zero levels that had been in place since the early days of the pandemic. As the year has passed and inflationary pressures have slightly eased, the appreciation of the U.S. dollar has emerged as a new headwind, challenging firms’ profitability overseas. 2022 continues to maintain a high degree of uncertainty given the continued inflationary pressure and lingering threat of a recession.
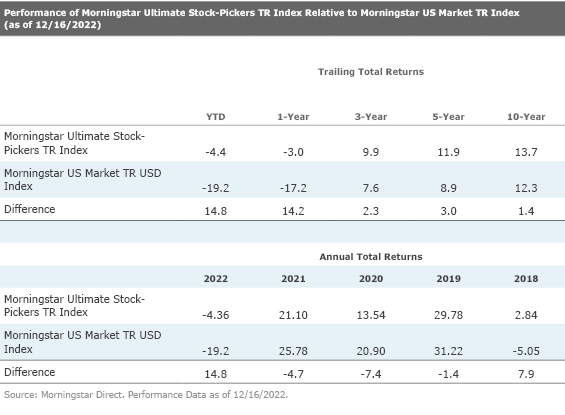
Our own Morningstar Ultimate Stock-Pickers index has not been immune to the trend of underperformance of active management; however, it has outperformed the Morningstar U.S. Market index year to date. In fact, this massive year-to-date outperformance has helped drive 1-, 3-, 5-, and 10-year trailing performance above the index, as well.
Aside from tracking the holdings, purchases, and sales and the ongoing investment performance of our Ultimate Stock-Pickers, we also follow the makeup and results of the Morningstar Ultimate Stock-Pickers TR Index. For those who may not recall, the Ultimate Stock-Pickers index was set up to track the highest-conviction holdings of 26 different managers, a list that includes our 22 top fund managers as well as the investment managers of four insurance companies—Berkshire Hathaway (BRK.A/BRK.B), Markel (MKL), Alleghany (Y), and Fairfax Financial (FRFHF). It is constructed by taking all the stock holdings of our Ultimate Stock-Pickers that are not only covered by Morningstar stock analysts but have either a Low or Medium Uncertainty Rating and ranking them by their Morningstar Conviction Score. The Morningstar Conviction Score is made up of three factors:
- The overall conviction (number and weighting of holdings)
- The relative current optimism (holdings being purchased)
- The relative current pessimism (holdings being sold)
Three sub-portfolios comprise the index—each containing 20 securities—that are reconstituted quarterly on a staggered schedule. As such, one third of the index is reset every month, with the 20 securities with the highest conviction scores making up each sub-portfolio when they are reconstituted. This structure means that the overall index can hold anywhere between 20 and 60 stocks at any given time (because some stocks may remain as the highest-conviction score holders in any given period, meaning there can be overlaps in the holdings, reducing the total number of different stocks held). In reality, the index is usually composed of 35 to 45 securities, holding 38 stocks in all at the end of November. These stocks should represent some of the best investment opportunities that have been identified by our Ultimate Stock-Pickers in any given period. It can also have more concentrated positions than one might find in a typical mutual fund. The size and concentration of the portfolio do change, though, as this is an actively managed index that tries to tap into our top managers’ movements and conviction levels over time.
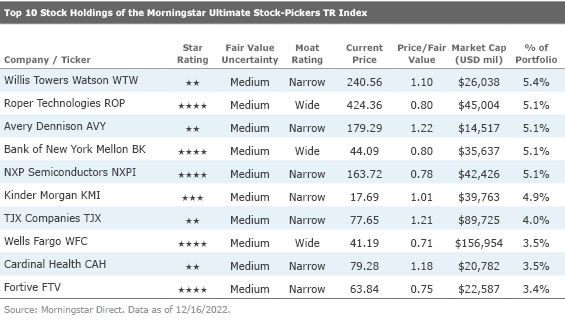
Looking at the top 10 stock holdings of the Morningstar Ultimate Stock-Pickers index, five of the top 10 are currently trading at approximately a 10% or more discount to our analysts’ fair value estimates. One of these companies is narrow-moat-rated Fortive FTV, which currently trades at a 25% discount to Morningstar analyst Krzysztof Smalec’s fair value estimate of $85 per share. As this company is both undervalued and a top stock holding on our index, we believe it merits further discussion.
Fortive is a diversified industrial technology firm with a broad portfolio of mission-critical products and services that include field solutions, product realization, health, and sensing technologies. The company serves a wide range of end markets, including manufacturing, utilities, medical, and electronics. Fortive generated roughly $5.3 billion in revenue and $1.2 billion in adjusted operating income in 2021.
Smalec believes Fortive has dug a narrow moat attributable to customer switching costs and intangible assets. Since its spinoff from Danaher DHR, Fortive has continued its former parent’s strategy of acquiring moaty companies and improving their operations through lean manufacturing principles. Management has focused its acquisitions particularly on boosting the firm’s recurring revenue and digital capabilities. Fortive seeks to address customer pain points by combining its large installed base of tools and equipment with software solutions to offer a comprehensive package, thereby increasing customer stickiness. While capable management and a strong legacy of continuous improvement make Fortive’s moat more than the sum of its parts, Smalec also views the individual businesses in its portfolio as moatworthy on their own.
Across all its businesses, Smalec points out that Fortive has a large installed base that is protected by customer switching costs. As many of the products perform mission-critical functions, a reputation for quality is paramount to win customer loyalty. For example, Industrial Scientific provides gas detection services and Landauer measures radiation exposure, areas where reliability is critical, as human safety and even life could be at stake. Another example is Qualitrol, which offers condition-based monitoring solutions that allow utilities to reduce unnecessary maintenance and lower the risk of unplanned outages. Considering the tremendous cost of failure in such applications (including unscheduled downtime and safety considerations), Smalec believes customers are less likely to aggressively pursue cost savings by switching to a cheaper but less proven alternative.
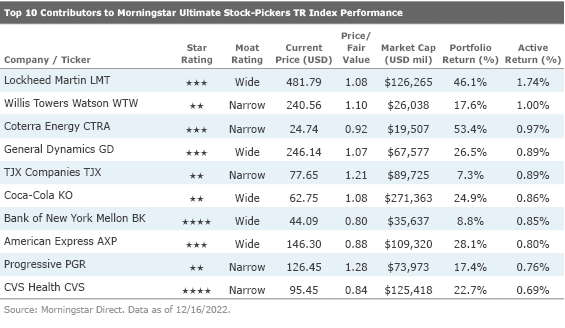
Looking at the Morningstar Ultimate Stock-Pickers index’s year-over-year performance, we note that two of the top 10 names are undervalued according to Morningstar analysis. The list seems to be diverse by industry, with names in financial services, industrials, energy, healthcare, and consumer sectors. Today we’ll look at wide-moat Bank of New York Mellon BK, which is one of the undervalued names on our list. The stock currently trades at a discount to Morningstar analyst Rajiv Bhatia’s $55 fair value estimate.
BNY Mellon is a global investment company involved in managing and servicing financial assets throughout the investment lifecycle. The bank provides financial services for institutions, corporations, and individual investors and delivers investment management and investment services in 35 countries and more than 100 markets. BNY Mellon is the largest global custody bank in the world, with about $41.1 trillion under custody and administration (as of Dec. 31, 2020) and can act as a single point of contact for clients looking to create, trade, hold, manage, service, distribute, or restructure investments. BNY Mellon’s asset-management division manages about $2.2 trillion in assets.
Bhatia believes the custody business tends to be a wide-moat business built on cost advantages and switching costs. BNY Mellon edges out State Street STT as the number-one custodian based on assets under custody or administration. Given the low basis points paid for custody services, Bhatia believes this is a business where scale matters. There are large up-front costs to developing software systems and processes to serve a high amount of assets. As an example, State Street and BNY Mellon each spent over $2 billion on technology in 2019, a level that smaller firms cannot match.
On the investment servicing side, clients of BNY Mellon face switching costs due to process disruption, the interconnectedness of clients’ workflows, and the custodian’s infrastructure as well as onboarding costs. As a result, Bhatia recognizes that BNY Mellon’s clients tend to be sticky.
According to Bhatia, the largest impact to the firm’s revenue from COVID-19 has been from low interest rates, both on net interest income and on fee waivers on money market funds. The firm’s net interest margin was 1.09% in the fourth quarter of 2019 and bottomed at 0.67% in the first quarter of 2021. Money market fee waivers were de minimis right before the pandemic and hit an annualized impact of $1.1 billion in the fourth quarter of 2021. By the third quarter of 2022, fee waivers were minimal and net interest margin had recovered to 1.05%, and Bhatia expects this to continue to rise in the near term as the Fed hikes interest rates.

While lists of top-performing stocks are often composed of stocks that have already run up, our top detractors’ list can sometimes be a good area to pick through the wreckage. Even though these names might not be performing well, it is possible that there could be some value plays in the long run. From our current list, we will highlight Medtronic MDT, which currently trades at about a 30% discount to Morningstar analyst Debbie Wang’s $112 fair value estimate.
As one of the largest medical device companies, Medtronic develops and manufactures therapeutic medical devices for chronic diseases. Its portfolio includes pacemakers, defibrillators, heart valves, stents, insulin pumps, spinal fixation devices, neurovascular products, advanced energy, and surgical tools. The company markets its products to healthcare institutions and physicians in the United States and overseas. Foreign sales account for almost 50% of the company’s total sales.
In Wang’s view, Medtronic’s wide moat is rooted in its dominant presence in highly engineered medical devices to treat chronic diseases, including those beyond its historical stronghold in heart disease. Medtronic’s strongest moat source is intangible assets and to a lesser extent switching costs that are associated with specific products.
Wang observes that Medtronic is often first to market with new products and has invested heavily in internal research and development efforts as well as acquiring emerging technologies. However, in the postreform healthcare world where there are higher hurdles for securing reimbursement for next-generation technology, Medtronic has slightly shifted its strategy to include partnering more closely with its hospital clients by offering a greater breadth of products and services to help hospitals operate more efficiently. By partnering more closely and integrating itself into more hospital operations, Medtronic is well positioned to take advantage of more business opportunities in the value-based reimbursement environment, in Wang’s view. In particular, Medtronic has been pioneering risk-based contracting around some of its cardiac and diabetes products, which Wang thinks is attractive to hospital clients and payers alike.
Wang thinks Medtronic’s diversified medical technology portfolio allows it to better weather occasional glitches in the development or approval process for any particular new device. Investments in neuromodulation, diabetes, and spinal products from the middle to late 1990s paid off in spades through 2010. Although the spine and ICD businesses have been hit with slower market growth since then, Wang notes that the firm has seen double-digit growth in its diabetes, surgical technologies, drug-coated balloons, neurovascular, and atrial fibrillation segments. While some of Medtronic’s product lines have waned as new clinical data has altered treatment guidelines, the firm continues to invest in emerging technologies, including renal denervation and transcatheter mitral valves, that should drive future growth, in Wang’s opinion.
Disclosure: Ari Felhandler, Rue Shetty, and Eric Compton have no ownership interests in any of the securities mentioned above. It should also be noted that Morningstar’s Institutional Equity Research Service offers research and analyst access to institutional asset managers. Through this service, Morningstar may have a business relationship with fund companies discussed in this report. Our business relationships in no way influence the funds or stocks discussed here.
The author or authors do not own shares in any securities mentioned in this article. Find out about Morningstar’s editorial policies.
/cloudfront-us-east-1.images.arcpublishing.com/morningstar/ZJTW7PDXFVDWDP7YNYC4UVOHVU.jpg)
/cloudfront-us-east-1.images.arcpublishing.com/morningstar/OPA4TZMXZJDRLG5DYE2W6YTE7A.jpg)
/d10o6nnig0wrdw.cloudfront.net/05-08-2024/t_f17f0449d3314a27b966dcee5d39a6cb_name_file_960x540_1600_v4_.jpg)
:quality(80)/s3.amazonaws.com/arc-authors/morningstar/e03383eb-3d0b-4b25-96ab-00a6aa2121de.jpg)