
The New CEFs on the Block
But you can only take your money out step by step.

/s3.amazonaws.com/arc-authors/morningstar/af89071a-fa91-434d-a760-d1277f0432b6.jpg)
PIMCO made headlines last month when it launched an interval fund (PIMCO Flexible Credit Income) and registered to raise $1 billion in assets. The last closed-end fund, or CEF, to raise more than $1 billion in assets was Goldman Sachs MLP and Energy Renaissance Fund GER in the fall of 2014. Interval funds have gained popularity in recent months as investors continue to search for income and are increasingly willing to invest in riskier fare to gain a bit more yield. These funds have some distinct advantages over CEFs, though there are plenty of reasons to avoid them. This month, we highlight interval funds and outline some important pros and cons of investing in them.
Some in the financial press have asserted that, with all the challenges facing CEFs, particularly the potential imposition of the fiduciary standard on advisors and brokers, interval funds could be the next big thing. Asset managers seem to think so, too. As of the end of February, there were about 20 interval funds in registration, which would almost double the number of interval funds available. For comparison, just nine new CEFs launched in 2016, raising a paltry $3 billion in total; for the year-to-date 2017, there have been two CEF IPOs, raising just $375 million in assets.
While growing in popularity, interval funds remain a very small part of the overall market. As of February 2017, there were about 30 interval funds in existence, accounting for a total of around $9 billion in assets. By comparison, there are around 530 CEFs with nearly $400 billion in gross assets ($250 billion in net assets) in existence.
What Is an Interval Fund? Interval funds are a type of CEF but with one important distinction: Shares are not traded on an exchange in the secondary market. Instead, shareholders can participate in periodic (quarterly, for example) repurchase offers by the fund (the amount repurchased must be at least 5% but no more than 25% of assets each period). The funds can continuously offer shares to the public based on current net asset value, though not all interval funds strike a daily NAV (most CEFs do). By contrast, shareholders in CEFs buy and sell shares on the secondary market, which creates both a NAV (the value of the fund's underlying holdings) and a share price (the price at which investors transact); this gives rise to discounts and premiums. More on this later.
Interval funds’ unique redemption process requires a bit more detail. Investors are only able to withdraw money during predetermined redemption periods, which usually occur once per quarter but could be as infrequently as semiannually or annually. During this “redemption window” (which usually lasts two or three weeks), investors submit requests to sell shares back to the fund company, but orders are not processed immediately. Rather, once the redemption window closes, the fund has additional time (typically around one week) to sell assets to raise cash to meet the redemptions.
Investors should also note that sell orders will not be processed using the fund’s NAV on the day the order is submitted. Rather, depending on the length of the redemption window and when the order was submitted, sales might not be processed until two, three, or even four weeks after submission, which means investors do not know the NAV at which shares will be repurchased. This give rise to a considerable con for interval funds over CEFs: the inability to sell shares immediately and the risk that the market will turn south between order placement and fulfillment, leaving investors with a lot less cash than expected.
Finally, because interval fund managers do not have to worry about meeting daily investor outflows, they tend to invest in very illiquid securities. While CEFs can and do invest in illiquid securities, some interval funds invest in highly illiquid assets, including hedge funds, catastrophe bonds, real estate securities, and small business loans. Traditional CEFs tend to shy away from hedge funds and those exotic asset classes, even though, in theory, the structure does allow them to purchase similarly illiquid investments. In fact, since traditional CEFs don't have to meet regular redemptions, those products arguably have a greater ability to own illiquid securities.
From a fund firm or management perspective, an interval fund is an appealing investment wrapper. The managers can invest without too much concern about meeting outflows except during specified time periods, which provides them the freedom to invest in more esoteric and illiquid fare. From the fund company's perspective, the ability for investors to purchase shares at any time allows for the prospect of growing assets in the fund and increasing management fees. With CEFs, an asset manager would need to launch another fund in order to significantly increase assets under management for a specific strategy.
Like CEFs, interval funds can also use leverage and are subject to similar regulatory restrictions.
Pros and Cons Interval funds offer investors a different set of pros and cons from traditional CEFs. Below, we highlight some of the most important issues to consider.
Continuously Offered Shares One particular pro for interval funds over CEFs is that investors do not have to contend with discounts and premiums because they can buy shares directly from the fund company at the fund's prevailing NAV. (Note that there are likely brokerage fees or transaction costs associated with purchasing shares; however, this is similar to buying shares of a stock, exchange-traded fund, or CEF.) This will also likely lead to a steadier return profile for an interval fund versus a CEF, as interval funds are not subject to the whims of investor sentiment on a daily basis. For example, the average CEF lost 33% based on share price (with many losing over 50%) in 2008, then gained over 55%, on average, in 2009. Such high volatility can be difficult for investors to stomach.
Because interval funds offer shares on a continuous basis, there is no concern over how a fund is brought to market. Like an open-end fund, shares of an interval fund are available for sale at inception and investors can buy additional shares over time. This is a considerable pro for interval funds as they avoid the unsavory CEF IPO process and the resulting "IPO premium." We've discussed our distaste for CEF IPOs in detail in this column many times. Briefly, we urge all investors to avoid investing in CEF IPOs.
Access to Illiquid and Higher-Yielding Securities As discussed previously, interval funds tend to invest in highly illiquid securities to earn the so-called "liquidity premium." A portfolio chock-full of illiquid securities can earn a substantially higher yield than a typical portfolio of more-liquid assets. This is the primary reason to own interval funds--to gain access to these illiquid markets and earn a high payout.
That said, unlike a traditional CEF, interval funds do have to meet redemptions (even if only periodically), so these illiquid securities may need to be sold at some point. This leads to the question of how quickly and at what price the fund can sell its holdings.
Redemption Window A unique and potential benefit of interval funds is that the periodic redemption window might promote better long-term investor behavior. Because investors can't sell at the first sign of market turbulence, they may be more likely to ride out the ups and downs and achieve a better result over the long term. This is, at least in theory, a benefit over CEFs. Long-term CEF investors must weather the daily fluctuations of share prices as investors buy and sell at will, sometimes creating dramatic swings in investment value.
In practice, however, it is equally likely that this merely condenses outflows into large chunks during the redemption periods. Should this happen, it is possible that investors won’t be able to redeem the full amount they requested. There is often a limit (usually between 5% and 25%) on the amount of overall fund assets that can be withdrawn during redemption periods. As long as the total redemption amount is below the limit, investors can withdraw as much as they want, but if the total redemption amount rises above the limit, shares are redeemed on a pro rata basis. Investors wishing to sell more will have to wait until the next redemption window. Its highly likely that many investors will want to sell shares at the same time for similar reasons (that is, bad performance), which means that, in theory, it could take years to liquidate a position.
Finally, if the fund's shareholders decide to withdraw en masse, while the total amount is limited, it could still be upward to 25% of the fund's assets. This is a large chunk of any fund to sell within a few weeks' time and could harm shareholders who do not sell, either by choice or because they simply aren't allowed to sell.
Fees An important con for interval funds are their high fees. These funds tend to be small and charge high management fees. On top of that, funds often charge front end loads and redemption fees, plus any costs of leverage. Of the interval funds that Morningstar tracks, gross expense ratios (inclusive of leverage) ranged from 1.5% to 5% and management fees ranged from 0.50% to more than 2%.
Transparency A final, but significant negative for interval funds is the lack of transparency. CEFs have their own issues with transparency, though the large fund companies offering CEFs (PIMCO, BlackRock, and Nuveen, for example) have greatly improved transparency over the years. Interval funds do have to meet minimum reporting standards, but most don't go beyond that bare minimum. Take ABS Long/Short Strategies Fund, which invests in hedge funds using long-short strategies across sectors. In the most recent quarterly filing of holdings, the interval fund simply lists the hedge funds and amounts invested in each. While this is typical of mutual funds investing in hedge funds, this does not provide much transparency into the portfolio. That said, the redemption practices of an interval fund would be a substantial benefit over a traditional open-end mutual fund in this case because hedge funds are illiquid, a considerable mismatch for the daily liquidity promised by mutual funds.
Importantly, we found that a fund's status as an interval fund is not always readily apparent on fact sheets or fund company websites. The information is there, but it can be difficult to find. For example, funds are often referred to as "continuously offered CEFs," which, while correct, is not at all illuminating for investors. Voya does a nice job of noting that its fund, Voya Senior Income XSIAX, is an interval fund, and it prominently displays the fund's tender offer schedule.
What's more, we found that some brokerage platforms do not make it abundantly clear that these funds have redemption restrictions when purchasing them.
Comparing Investment Wrappers Data is sparse for interval funds (Morningstar does not provide data for these funds on its website, though we do track the funds in our software products), so it can be difficult to analyze characteristics like expenses and payouts in practice. In an effort to highlight how different investment wrappers may affect a fund's expenses, performance, and payout, we looked at the suite of bank-loan products offered by Invesco (one ETF, one open-end mutual fund, two CEFs, and one interval fund).
Exhibit 1 lists the funds' yields (here, the CEFs' NAV distribution rates are in line with their 12-month yields because they distribute only income), expenses, and trailing three-year return through February 2017. Except for PowerShares Senior Loan BKLN, these funds are managed by the same team, though holdings will differ based on the strategy's wrapper.
Unsurprisingly, the ETF offers the cheapest exposure (0.64% expense ratio) but with a lower yield (4.41%) than both CEFs (6.65% and 5.93%) and the interval fund (4.87%). The interval fund's fees (1.68%) are lower than those of one of the CEFs, though in line with the fees of the other. Compared with the open-end fund, the interval fund's fees were 58 basis points higher. What's more, purchases of the interval fund are subject to a 3.25% front-end load. Trailing three-year returns through February 2017 are highest for the CEFs (gains of 5.6% and 4.4%), though the interval fund did beat both the ETF and the open-end fund over the same period.
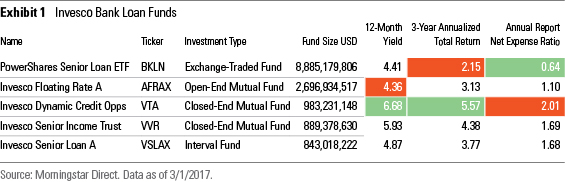
In this specific case, the interval fund carries high fees relative to three of the four alternative investment wrappers (plus a front-end load); its yield is lower than both CEFs, and its trailing three-year returns are worse. It doesn’t look as if investors are being fully compensated for the limited ability to sell shares of this fund.
Bottom Line Given the potential illiquidity of their underlying holdings, high fees, and the complexity associated with the redemption process, interval funds should probably be thought of as niche investments, if they're thought of at all. Investors considering interval funds should pay careful attention to overall fees (including front-end loads, brokerage fees, redemption fees, as well as annual management fees) and fully understand the redemption process and policies. Understanding the fund's investment universe and selection process as well as the experience of the management is of special importance for these funds as it could take years to liquidate an entire holding.
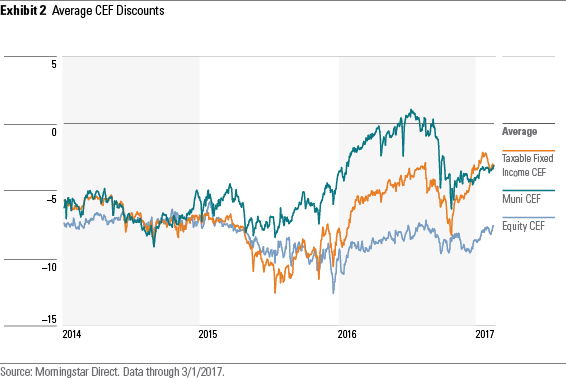
CEF Discount Trends February was short but eventful for CEF investors. A flurry of mixed economic data jostled CEF discounts in the middle of the month, and news from the Hill added to this uncertainty. The spread between taxable-bond and municipal CEF discounts converged within 1 basis point of each other at the end of the month, precipitated by a fall in taxable-bond CEF discounts around mid-February. This dip came shortly after January's Consumer Price Index data was released, showing the index had made its largest gains in almost four years. Not long after, the Fed signaled a March rate hike, and taxable-bond CEFs lost their short-lived premium over municipal bonds. Exhibit 2 shows the average discounts for taxable-bond, municipal-bond, and equity CEFs over the trailing three years.
Valuations We use a z-statistic to measure whether a fund is "cheap" or "expensive." As background, the z-statistic measures how many standard deviations a fund's discount/premium is from its three-year average discount/premium. For instance, a fund with a z-statistic of negative 2 would be two standard deviations below its three-year average discount/premium. Funds with the lowest z-statistics are classified as relatively inexpensive, while those with the highest z-statistics are relatively expensive. We consider funds with a z-statistic of negative 2 or lower to be "statistically undervalued" and those with a z-statistic of 2 or higher to be "statistically overvalued." Typically, we prefer to use the three-year z-statistic, which shows the funds that are most heavily discounted relative to their prices over the past three years. Exhibit 3 shows the most undervalued CEFs as of February 2017.
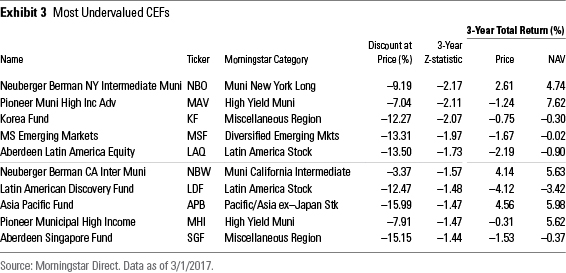
Three CEFs were considered undervalued by their three-year z-statistic as of the end of February. Neuberger Berman NY Intermediate Muni NBO is also the most heavily discounted in its category. That discount was reflected in the fund's trailing three-year share price return, which was the category's lowest at 2.6%. Pioneer Muni High Income Advantage MAV was close behind, with a three-year z-statistic of negative 2.1%. The fund also posted a low three-year share price return (negative 1.2%), despite having the highest NAV return in its category (7.62%).
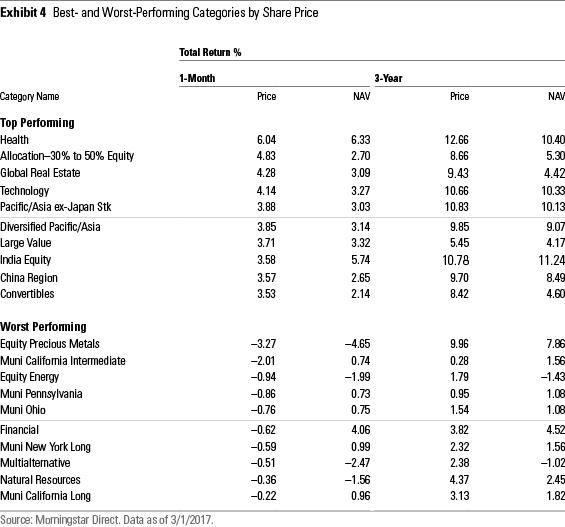
Best- and Worst-Performing CEF Categories February's best-performing CEF categories were concentrated equity sectors, piggybacking on the record gains seen by the Dow Jones Industrial Average and S&P 500. Investors' sentiment toward precious metals, financials, and natural resources was more lukewarm. Financials' average price return was a slight loss of negative 0.62%, despite the average NAV returning 4.06%. Had the categories been ranked by NAV returns, financials would have been the third-best-performing category. This unbalanced relationship could reflect investors' uncertainty toward the rate-sensitive sector, as the difference between the two- and 10-year Treasury yields narrowed toward the end of the month. Exhibit 4 below lists the best- and worst-performing CEF categories, by share price, for February.
Alaina Bompiedi and Brian Moriarty contributed to this article.
/cloudfront-us-east-1.images.arcpublishing.com/morningstar/BNHBFLSEHBBGBEEQAWGAG6FHLQ.png)
/d10o6nnig0wrdw.cloudfront.net/05-02-2024/t_60269a175acd4eab92f9c4856587bd74_name_file_960x540_1600_v4_.jpg)
/cloudfront-us-east-1.images.arcpublishing.com/morningstar/5WSHPTEQ6BADZPVPXVVDYIKL5M.png)
:quality(80)/s3.amazonaws.com/arc-authors/morningstar/af89071a-fa91-434d-a760-d1277f0432b6.jpg)