
Bond CEFs and Rising Rates
How will bond CEFs perform as the Fed raises rates?

The inverse relationship between bond prices and interest rates is a central tenet of bond math. As rates rise, new, higher-coupon bonds become more attractive than previously issued lower-coupon bonds. To get investors to buy those lower-coupon bonds, prices must fall. Eventually higher bond yields will be good for investors, but the short-term pain hits investors where it hurts: with lower investment returns because of the drop in bond price. For bond closed-end funds, or CEFs, the pain of rising interest rates is exacerbated by the funds' use of leverage.
Experienced bond investors may look at a fund's duration (a measure of price sensitivity due to changes in interest rates) to determine whether a portfolio is "protected" from rising rates. Duration, however, has several shortcomings. It's a good measure of interest-rate risk for noncallable Treasury bonds but becomes less predictive for funds with more credit risk, such as junk bonds, or unpredictable cash flows, such as mortgage-backed securities. In addition, portfolio-duration measures assume a parallel shift in the yield curve. Simply put, they assume that all rates along the entire yield curve (one month to 30 years) move up or down by the exact same amount. However, this is almost never the case in the real world.
What does this mean for bond-fund investors? It means that headline duration may be a somewhat misleading indicator of performance depending on how the yield curve shifts. Two fund managers, for example, may target the same average duration, but their underlying portfolios may vary widely in makeup, as may their performance during interest-rate shifts. What’s more, the yield curve may shift in a nonparallel fashion as it has in recent months—the short end has gone up while the longer end has dropped, causing the yield curve to "flatten."
That flattening of the yield curve has helped bond CEFs perform well despite "rising" interest rates. Most bond CEFs tend to hold long-maturity bonds, which are higher-yielding and less-liquid (a good fit for the CEF wrapper) and, as the long end of the curve has dropped, bond CEFs have performed well on both a share price and net asset value basis. For the year to date through May, the average taxable-bond CEF gained nearly 6% on NAV and nearly 8% on share price. During that time, the one-month Treasury rate rose 34 basis points and the 10-year dropped 24 basis points. Investors should also note that the cost of leverage is typically tied to short-term interest rates, which have gone up. This means funds are likely paying more for leverage, which could negatively affect a fund's total return.
While bond CEFs have done well so far this year, market factors are surely at play as many believe the U.S. economy will continue to expand and strengthen. Bond CEFs have performed poorly during short-term periods of rising rates, especially when rates moved unexpectedly. Exhibit 1 below shows the average share price and NAV returns for taxable and municipal bond CEFs over recent time periods during which the 10-year Treasury curve rose more than 50 basis points.
Exhibit 1: Bond CEF Returns During Periods of Rising Interest Rates

- source: Morningstar Direct. Data through 05/31/2017.
Returns have varied widely during different periods of rising rates. For example, during the taper tantrum from May 2013 to July 2013, which caught the market off-guard, both groups performed poorly on both a share price and NAV basis. During the most recent rate rise (November to December 2016), taxable bonds were up on share price and flat on NAV. Municipal bonds struggled—losing on both share price and NAV—as other market forces caused panic among muni investors. There's no clear answer to the question of how bond CEFs will perform as rates rise, though it's likely that this round of clearly telegraphed rate hikes by the Fed will be less damaging than the surprise taper tantrum.
Best- and Worst-Performing Categories The best-performing asset class in May was the Europe stock Morningstar Category, which pulled in strong returns on May 15, the day after Emmanuel Macron was officially installed as France's newest president. The category returned 7.25% for the month, at the top of the leader board on a share-price basis. Among the worst-performing categories was Latin America stock, which fell almost 9% on May 18, following allegation of bribery against Brazilian President Michel Temer. But the worst performers, on both an NAV and share-price basis, were the energy categories. These tumbled on May 25 when OPEC announced it would continue to shave oil production through March of next year.
Exhibit 2 lists the best- and worst-performing CEF categories for the month of May, ranked by share price return.
Exhibit 2: Best- and Worst-Performing Categories by Share Price
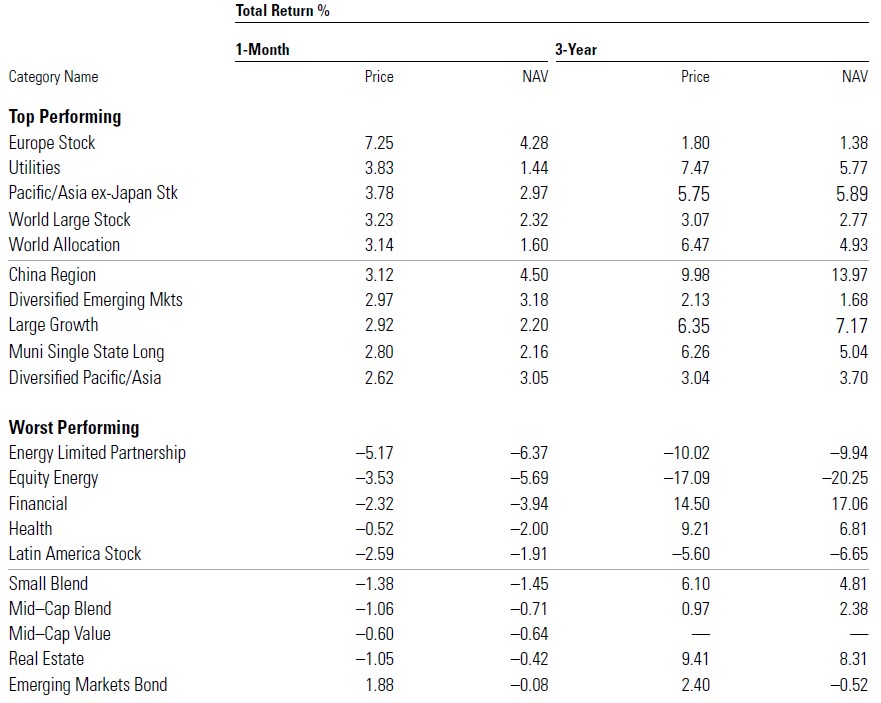
- source: Morningstar Direct. Data through 05/31/2017.
CEF Discount Trends Municipal bond CEF discounts widened last month, trading more cheaply than their taxable-bond counterparts. The two fixed-income asset classes had been trading at similar discount levels since the beginning of the year, but began to drift apart this past month. The average municipal CEF was trading at a 3.5% discount at the end of May, just slightly lower than the average taxable-bond CEF, whose average discount was 2.6%. Few deals could be found among equity CEFs, whose discounts narrowed to their lowest levels over the trailing three-year period. At the end of May, the average equity CEF was trading at a 5.2% discount.
Exhibit 3 shows the average discounts for the three major CEF asset classes for the trailing three-year period.
Exhibit 3: Average Discounts
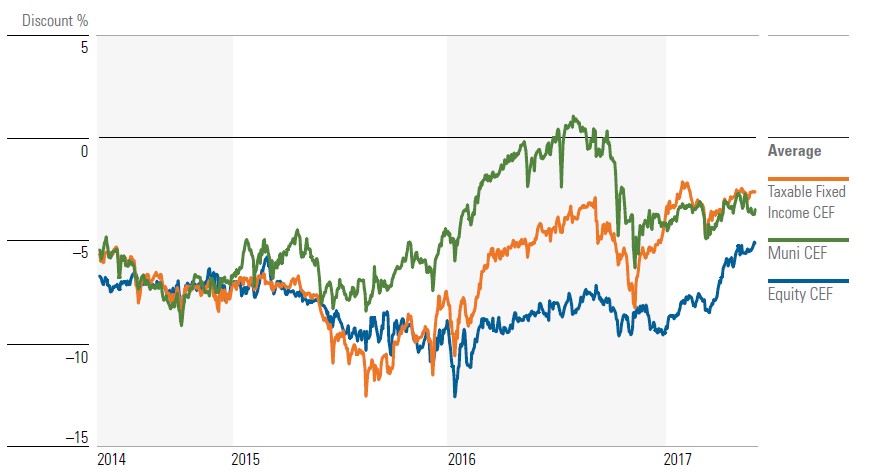
- source: Morningstar Direct. Data through 05/31/2017.
Valuations We use a z-statistic to measure whether a fund is "cheap" or "expensive." As background, the z-statistic measures how many standard deviations a fund's discount/premium is from its three-year average discount/premium. For instance, a fund with a z-statistic of negative (positive) 2 would be two standard deviations below (above) its three-year average discount/premium. Funds with the lowest z-statistics are classified as relatively inexpensive, while those with the highest z-statistics are relatively expensive.
We consider funds with a z-statistic of negative 2 or lower to be "statistically undervalued" and those with a z-statistic of positive 2 or higher to be "statistically overvalued." Typically, we prefer to use the three-year z-statistic, which shows the funds that are most heavily discounted relative to their prices over the past three years.
As of the end of May, hardly any CEFs were statistically undervalued. Just one,
Alaina Bompiedi contributed to this article.
/cloudfront-us-east-1.images.arcpublishing.com/morningstar/BNHBFLSEHBBGBEEQAWGAG6FHLQ.png)
/d10o6nnig0wrdw.cloudfront.net/05-02-2024/t_60269a175acd4eab92f9c4856587bd74_name_file_960x540_1600_v4_.jpg)
/cloudfront-us-east-1.images.arcpublishing.com/morningstar/5WSHPTEQ6BADZPVPXVVDYIKL5M.png)