
ETF Flows: Investors Curb Their Enthusiasm in January
Tepid flows accompany lukewarm performance.
/s3.amazonaws.com/arc-authors/morningstar/c00554e5-8c4c-4ca5-afc8-d2630eab0b0a.jpg)
Key Takeaways
- Markets started 2024 on a cautious note. The Morningstar Global Markets Index climbed a modest 0.38% in January.
- Interest-rate volatility continues to taper off, but lingering uncertainty over the Federal Reserve’s plan drove a 0.16% loss for the Morningstar US Core Bond Index.
- Investors curbed their enthusiasm significantly in January after a strong November and December, pouring only $31 billion into U.S. exchange-traded funds.
- Taxable-bond ETFs were the major attraction last month, pulling in $20 billion of investors’ money. Over a fourth of this money, $6.3 billion, went to corporate-bond ETFs.
- Same index, different fate: SPDR S&P 500 ETF Trust SPY bled nearly $23 billion in January, while iShares Core S&P 500 ETF IVV and Vanguard S&P 500 ETF VOO gathered around $10 billion each.
Lackluster Returns Everywhere ...
Exhibit 1 shows the January returns for a sample of ETFs that represent major asset classes. A blended global portfolio shed 0.15% in January, courtesy of uninspiring performance from international stocks and bonds.
January Market Performance Through the Lens of Analyst-Rated ETFs
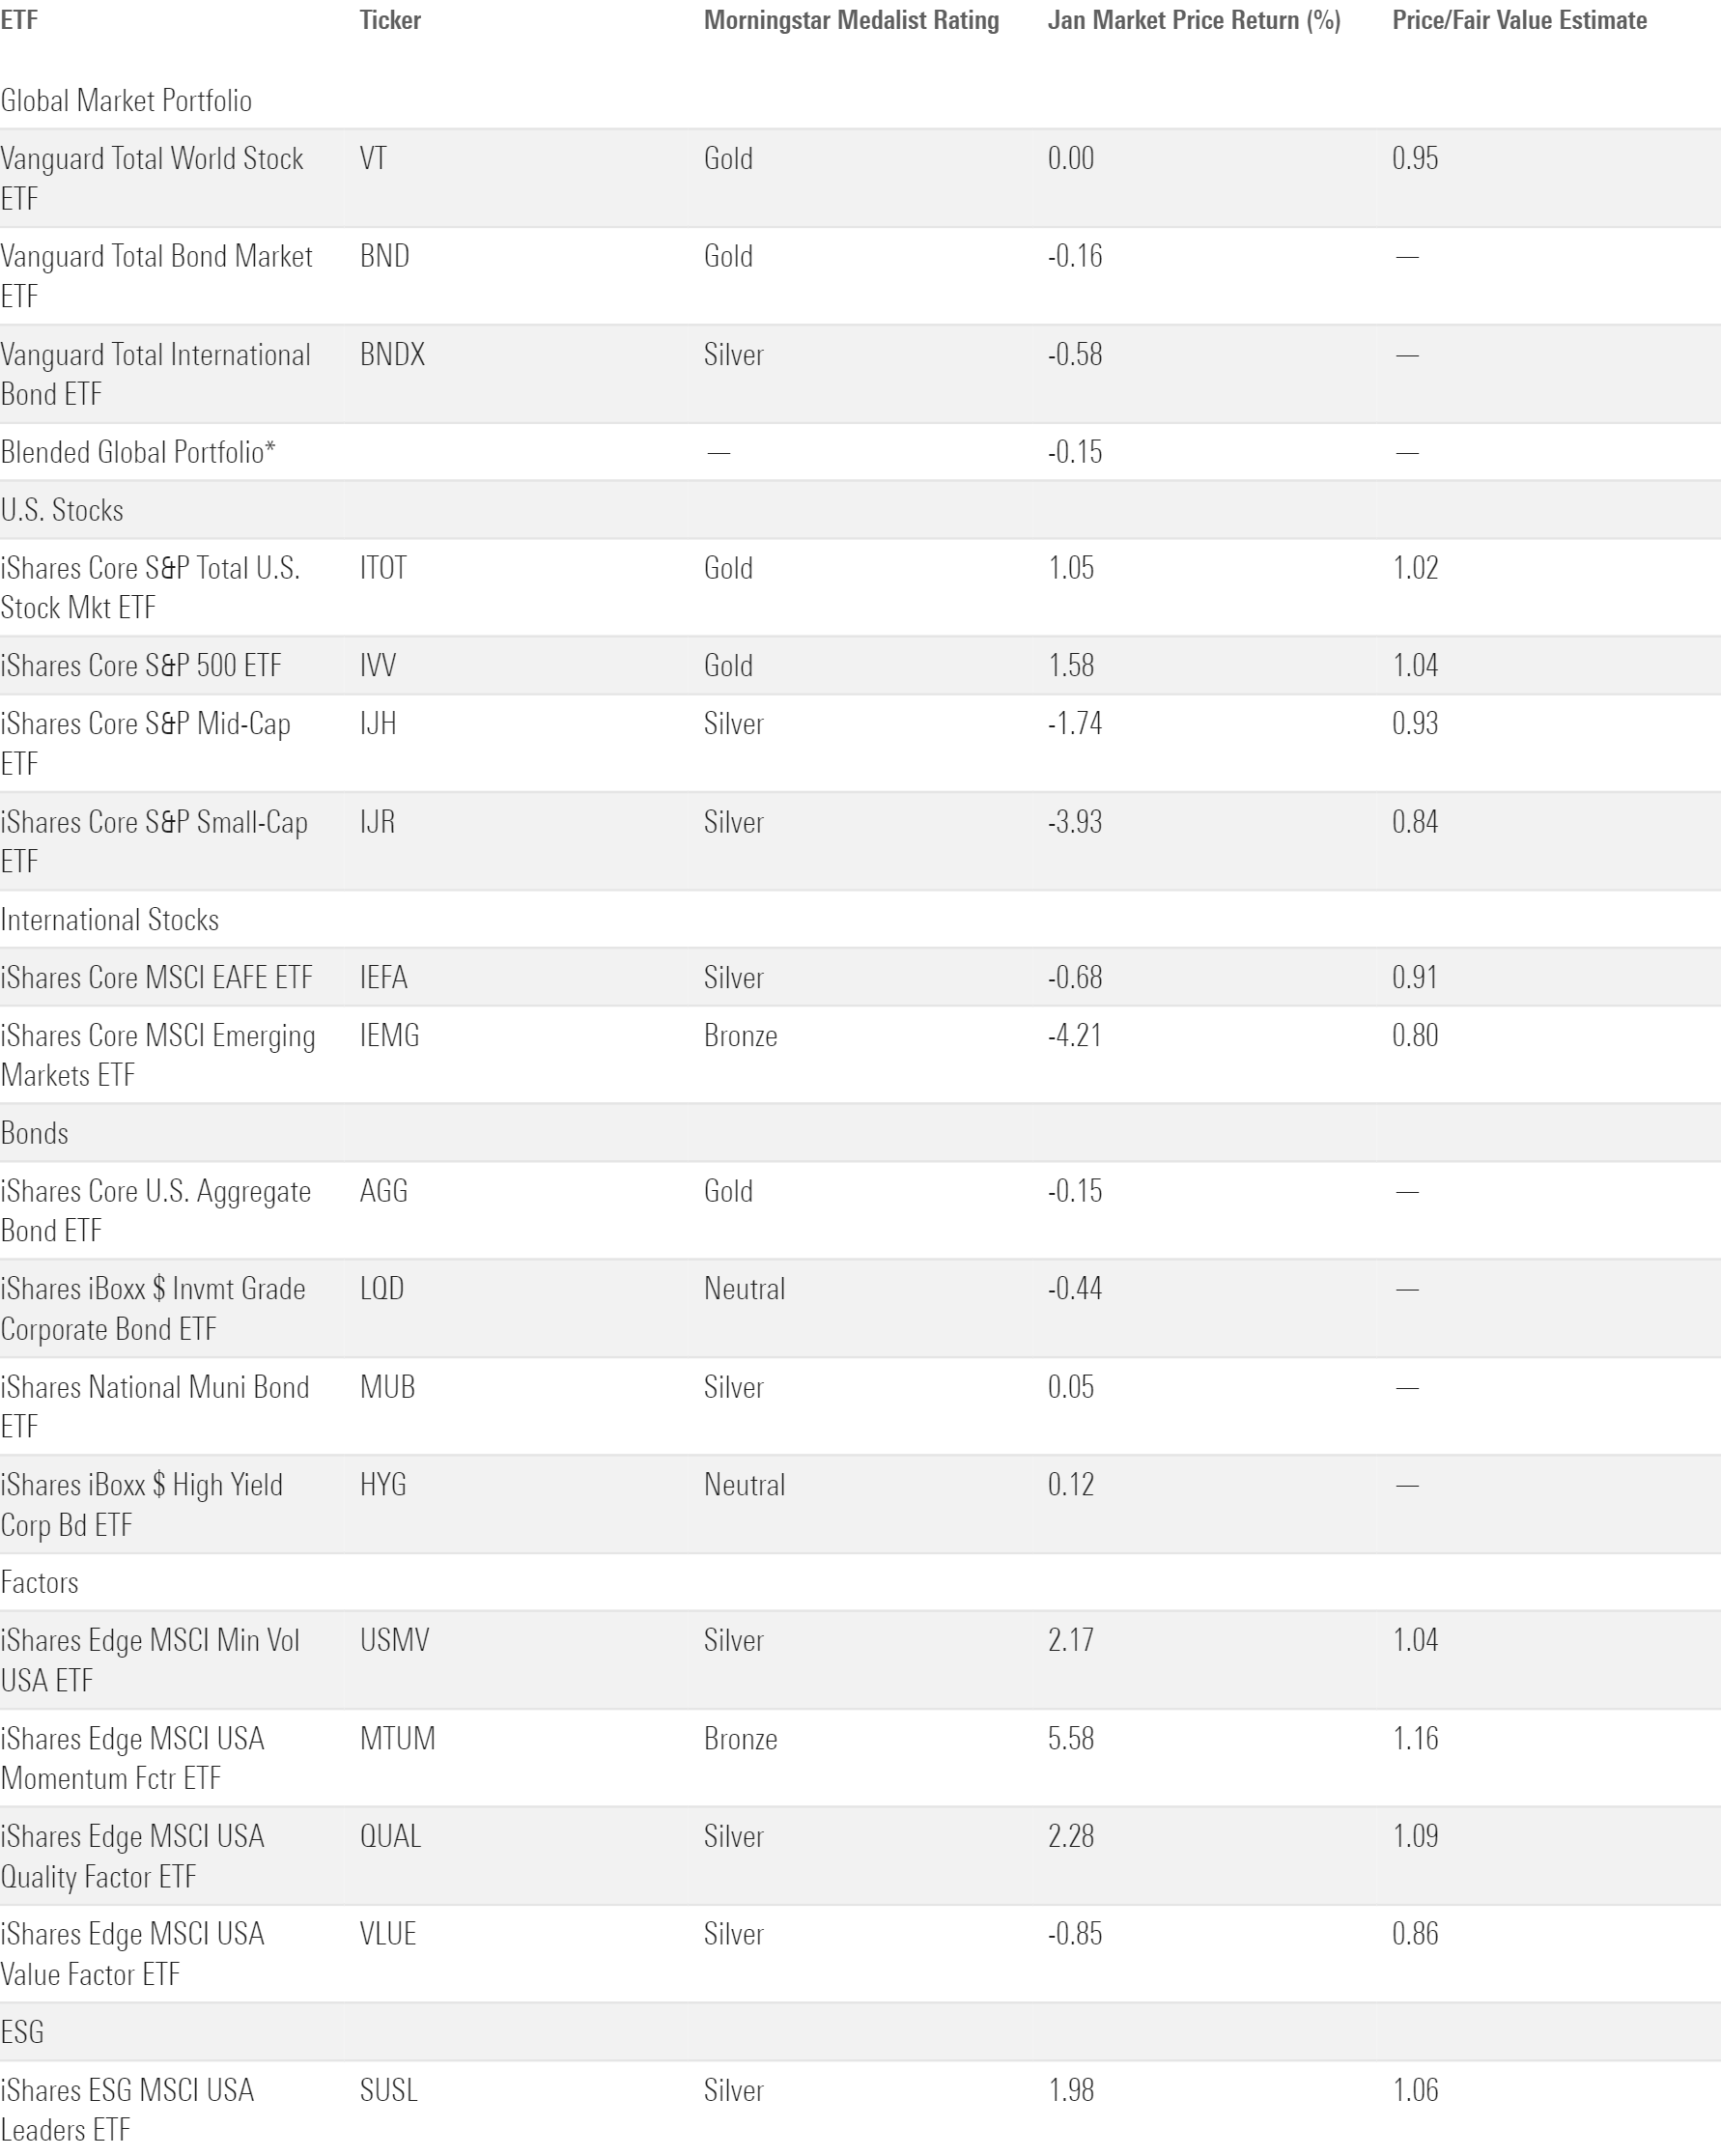
The new year started on a measured note after a strong rally in the last two months of 2023. Both U.S. and international bonds had minor losses. The market reduced its expectation for a March rate cut, pushing yields on 10-year Treasuries back to a 4.14% peak after a steady decline since November 2023. This sent long-term bonds downward, with iShares 20+ Year Treasury Bond ETF TLT down 2.27% in January. International bonds didn’t fare any better, hit by a double whammy of lackluster performance in emerging markets and a strengthening U.S. dollar.
Emerging markets fought their way back into positive territory in 2023, but they failed to keep up in January. IShares Core MSCI Emerging Markets ETF IEMG lost 4.21%, while its bond counterpart iShares J.P. Morgan USD Emerging Markets Bond ETF EMB shed 1.24%. Signs of trouble in China’s markets continue to be a sore spot, affecting neighboring emerging Asian markets as well.
… but U.S. Stocks Remain a Bright Spot
Large-cap U.S. stocks provided a sight for sore eyes. Strong economic data and expectations of a rate cut from the Fed fueled the U.S. stock market to levels not seen since its 2021 peak. IShares Core S&P Total U.S. Stock Market ETF ITOT carried on its upward hike from November 2023 and ended January with a 1.05% return. While still a far cry from the ETF’s 9.11% return in November and 4.52% in December, this reflected the U.S. market’s optimistic outlook for the year, despite a fresh round of worry over regional banks on the last day of the month.
Investors continued to bet on large-cap stocks to start the year, driving a 5.51% gap between iShares Core S&P 500 ETF and iShares Core S&P Small-Cap ETF IJR. Similarly, growth stocks still trumped value stocks in January after beating them by double digits in 2023. IShares Russell 1000 Growth ETF IWF returned 2.4% for the month, while iShares Russell 1000 Value ETF IWD scraped together a modest 0.09% gain.
Along sector lines, market optimism powered some familiar faces: Technology Select Sector SPDR XLK and Communication Services Select Sector SPDR XLC gained 2.7% and 4.4%, respectively, in January. Healthcare and financial services were the other sectors that ended the month in the black. Real Estate Select Sector SPDR XLRE lost 4.82%, followed by its counterparts tracking the materials and utilities sectors. Consumer Discretionary Select Sector SPDR XLY slid 4.41% in January after a strong 2023, owing in part to Tesla’s TSLA disappointing performance.
ETF Flow Back to Normal in January
After hauling in over $100 billion in November and December, ETF inflows came back to earth in January to a modest $31 billion. Stock and bond ETFs took in most of the new money, but alternative ETFs raked in a decent amount.
January Flows Across Morningstar Broad Category Groups
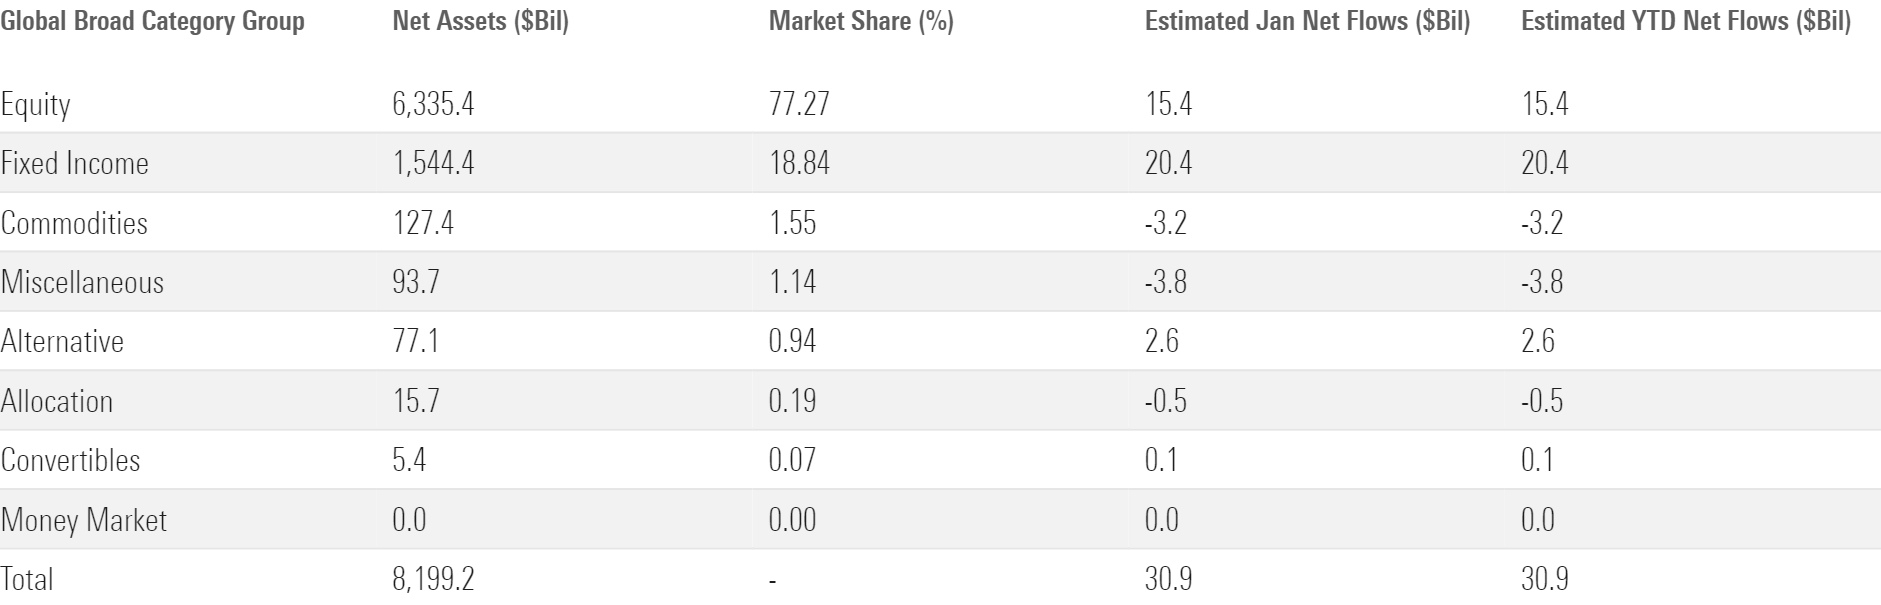
The large-growth Morningstar Category carried its 2023 momentum into the new year. Fan favorite Invesco QQQ Trust QQQ and its sibling Invesco Nasdaq 100 ETF QQQM brought in almost $8 billion combined in January. The rest of the category broke even on flows for the month, after iShares S&P 500 Growth ETF IVW shed $1.8 billion, likely because of BlackRock’s tilt to value in the latest rebalance of its model portfolios.
The large-growth category accounted for most of the $6.7 billion net inflow into the U.S. equity category group. On the other hand, investors shunned large-value and small-blend ETFs after an underwhelming 2023, leading each category to bleed over $1 billion.
Investors still had an appetite for credit risk, as corporate-bond and intermediate core-plus bond ETFs took in the most money among bond categories. International-equity ETFs kept pace with U.S. equity ETFs, bringing in $6.2 billion. The foreign large-blend category led the charge, followed by ETFs in the Japan stock category. Japanese equities have revived investors’ interest recently as market reforms sparked hopes of a rally.
Morningstar Categories With the Largest January Flows
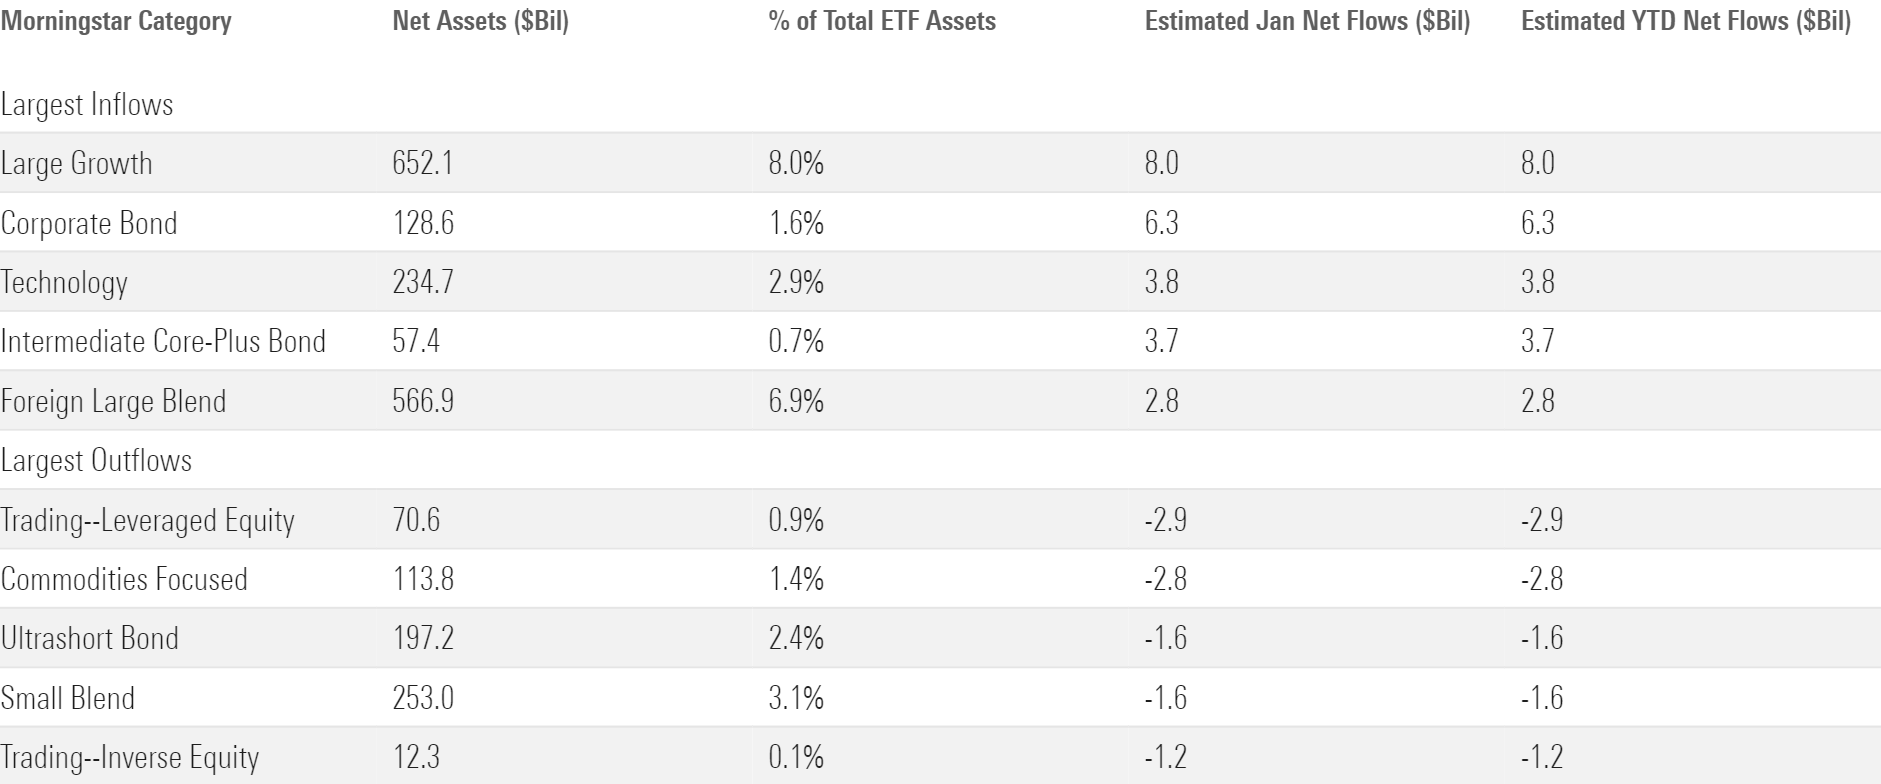
Ultrashort bond ETFs continued to shed assets in January as the timeline for rate cuts looms closer. But ETFs from the trading-leveraged equity category shed even more, earning the top spot on the outflow list.
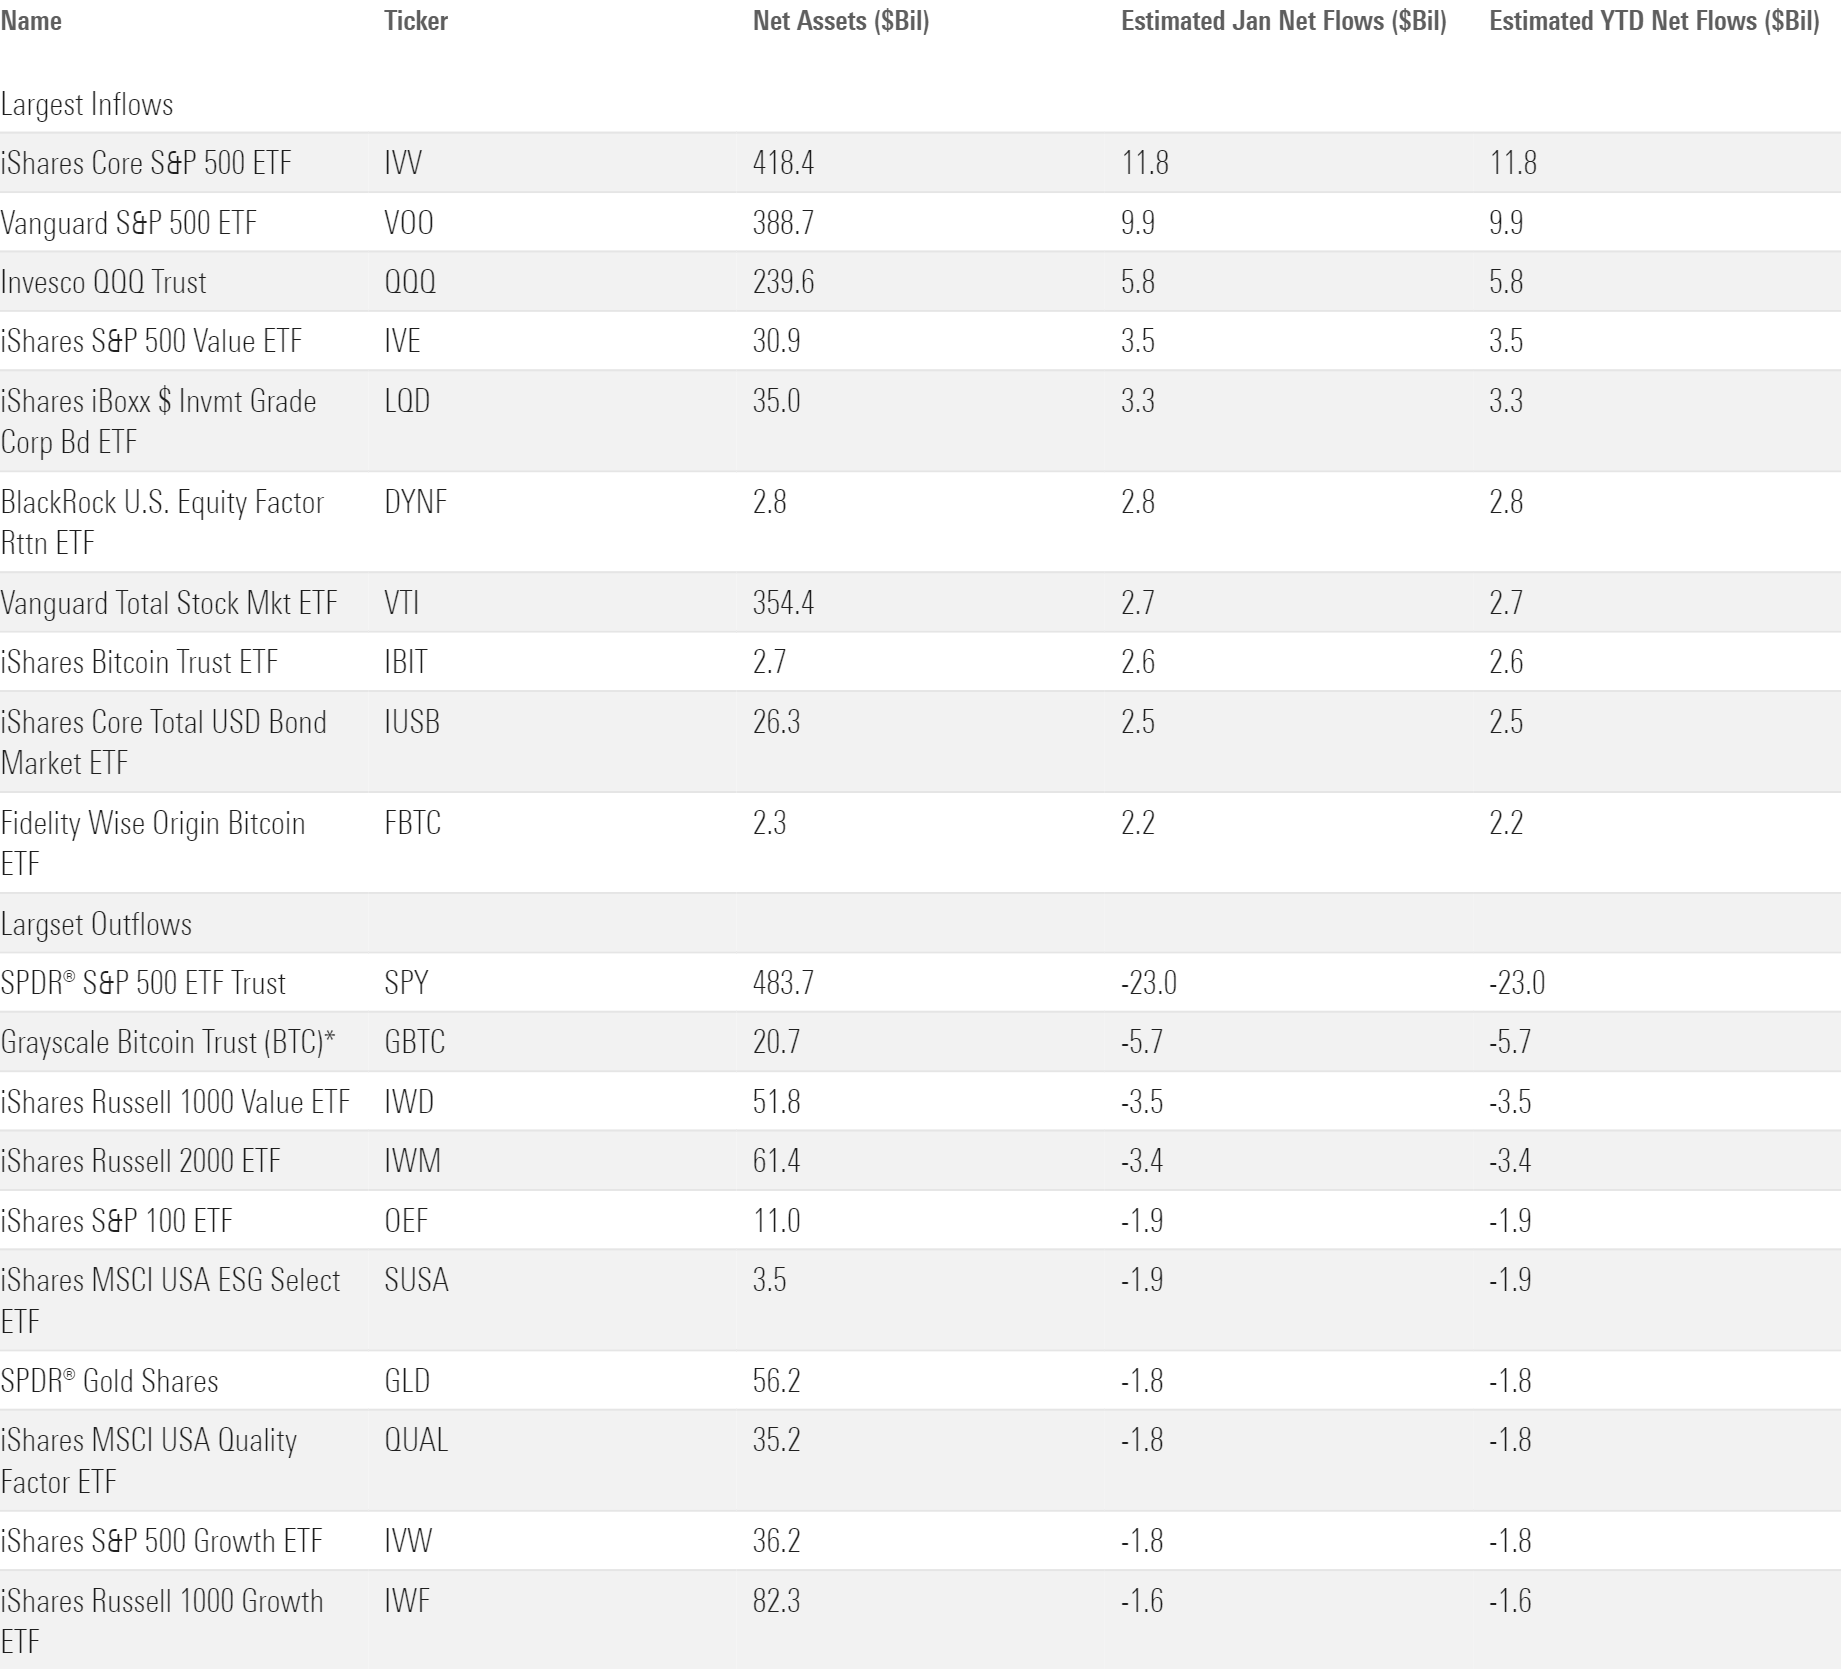
SPY Sheds Assets
A curious divergence happened this month in broad-market index ETFs. The ETFs with the largest inflows in January were iShares Core S&P 500 ETF and Vanguard S&P 500 ETF, while SPDR S&P 500 ETF Trust had the largest outflow. IVV raked in nearly $12 billion, and VOO followed closely behind with nearly $10 billion. Yet SPY, which tracks the same index, lost a whopping $23 billion. This came after the fund amassed nearly $40 billion in December 2023. None of these figures moved the market-share needle that much, given these ETFs’ enormous asset bases. Still, it serves as a reminder of the various roles that ETFs play in the broader ecosystem. Traders typically flock to SPY as a trading tool to express short-term directional market opinions or to hedge other related investments. On the other hand, IVV and VOO have a stickier user base largely made up of asset allocators and buy-and-hold investors.
Speaking of asset allocators, the recent rebalancing of BlackRock’s model portfolio also likely played a part in pushing BlackRock US Equity Factor Rotation ETF DYNF into the limelight. It gathered a total of $2.8 billion last month, increasing its asset base from a mere $50 million to nearly $3 billion.
ETFs With the Largest January Flows
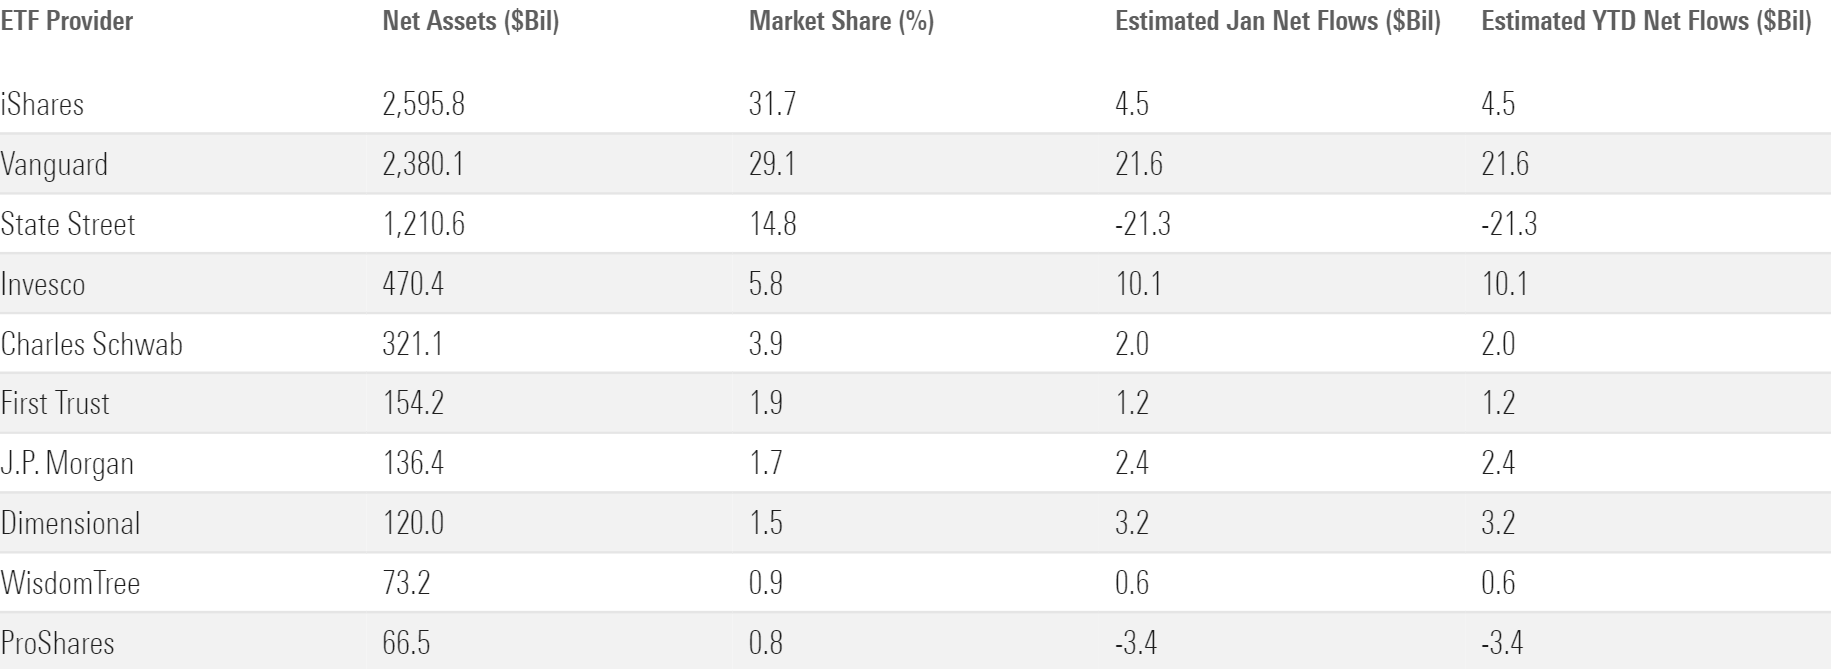
An Off Month for State Street
SPY’s outflow explained much of State Street’s struggles in January. The firm still claims the third spot on the largest ETF providers list, but its $21.3 billion outflow looked out of place against Vanguard’s $21.6 billion and iShares’ $4.5 billion in inflows.
Vanguard enjoyed another strong month as its suite of core ETFs diligently gathered assets, led by VOO and Vanguard Total Stock Market ETF VTI. Invesco also did well as investors flocked to QQQ and QQQM.
January Flows for the 10 Largest ETF Providers
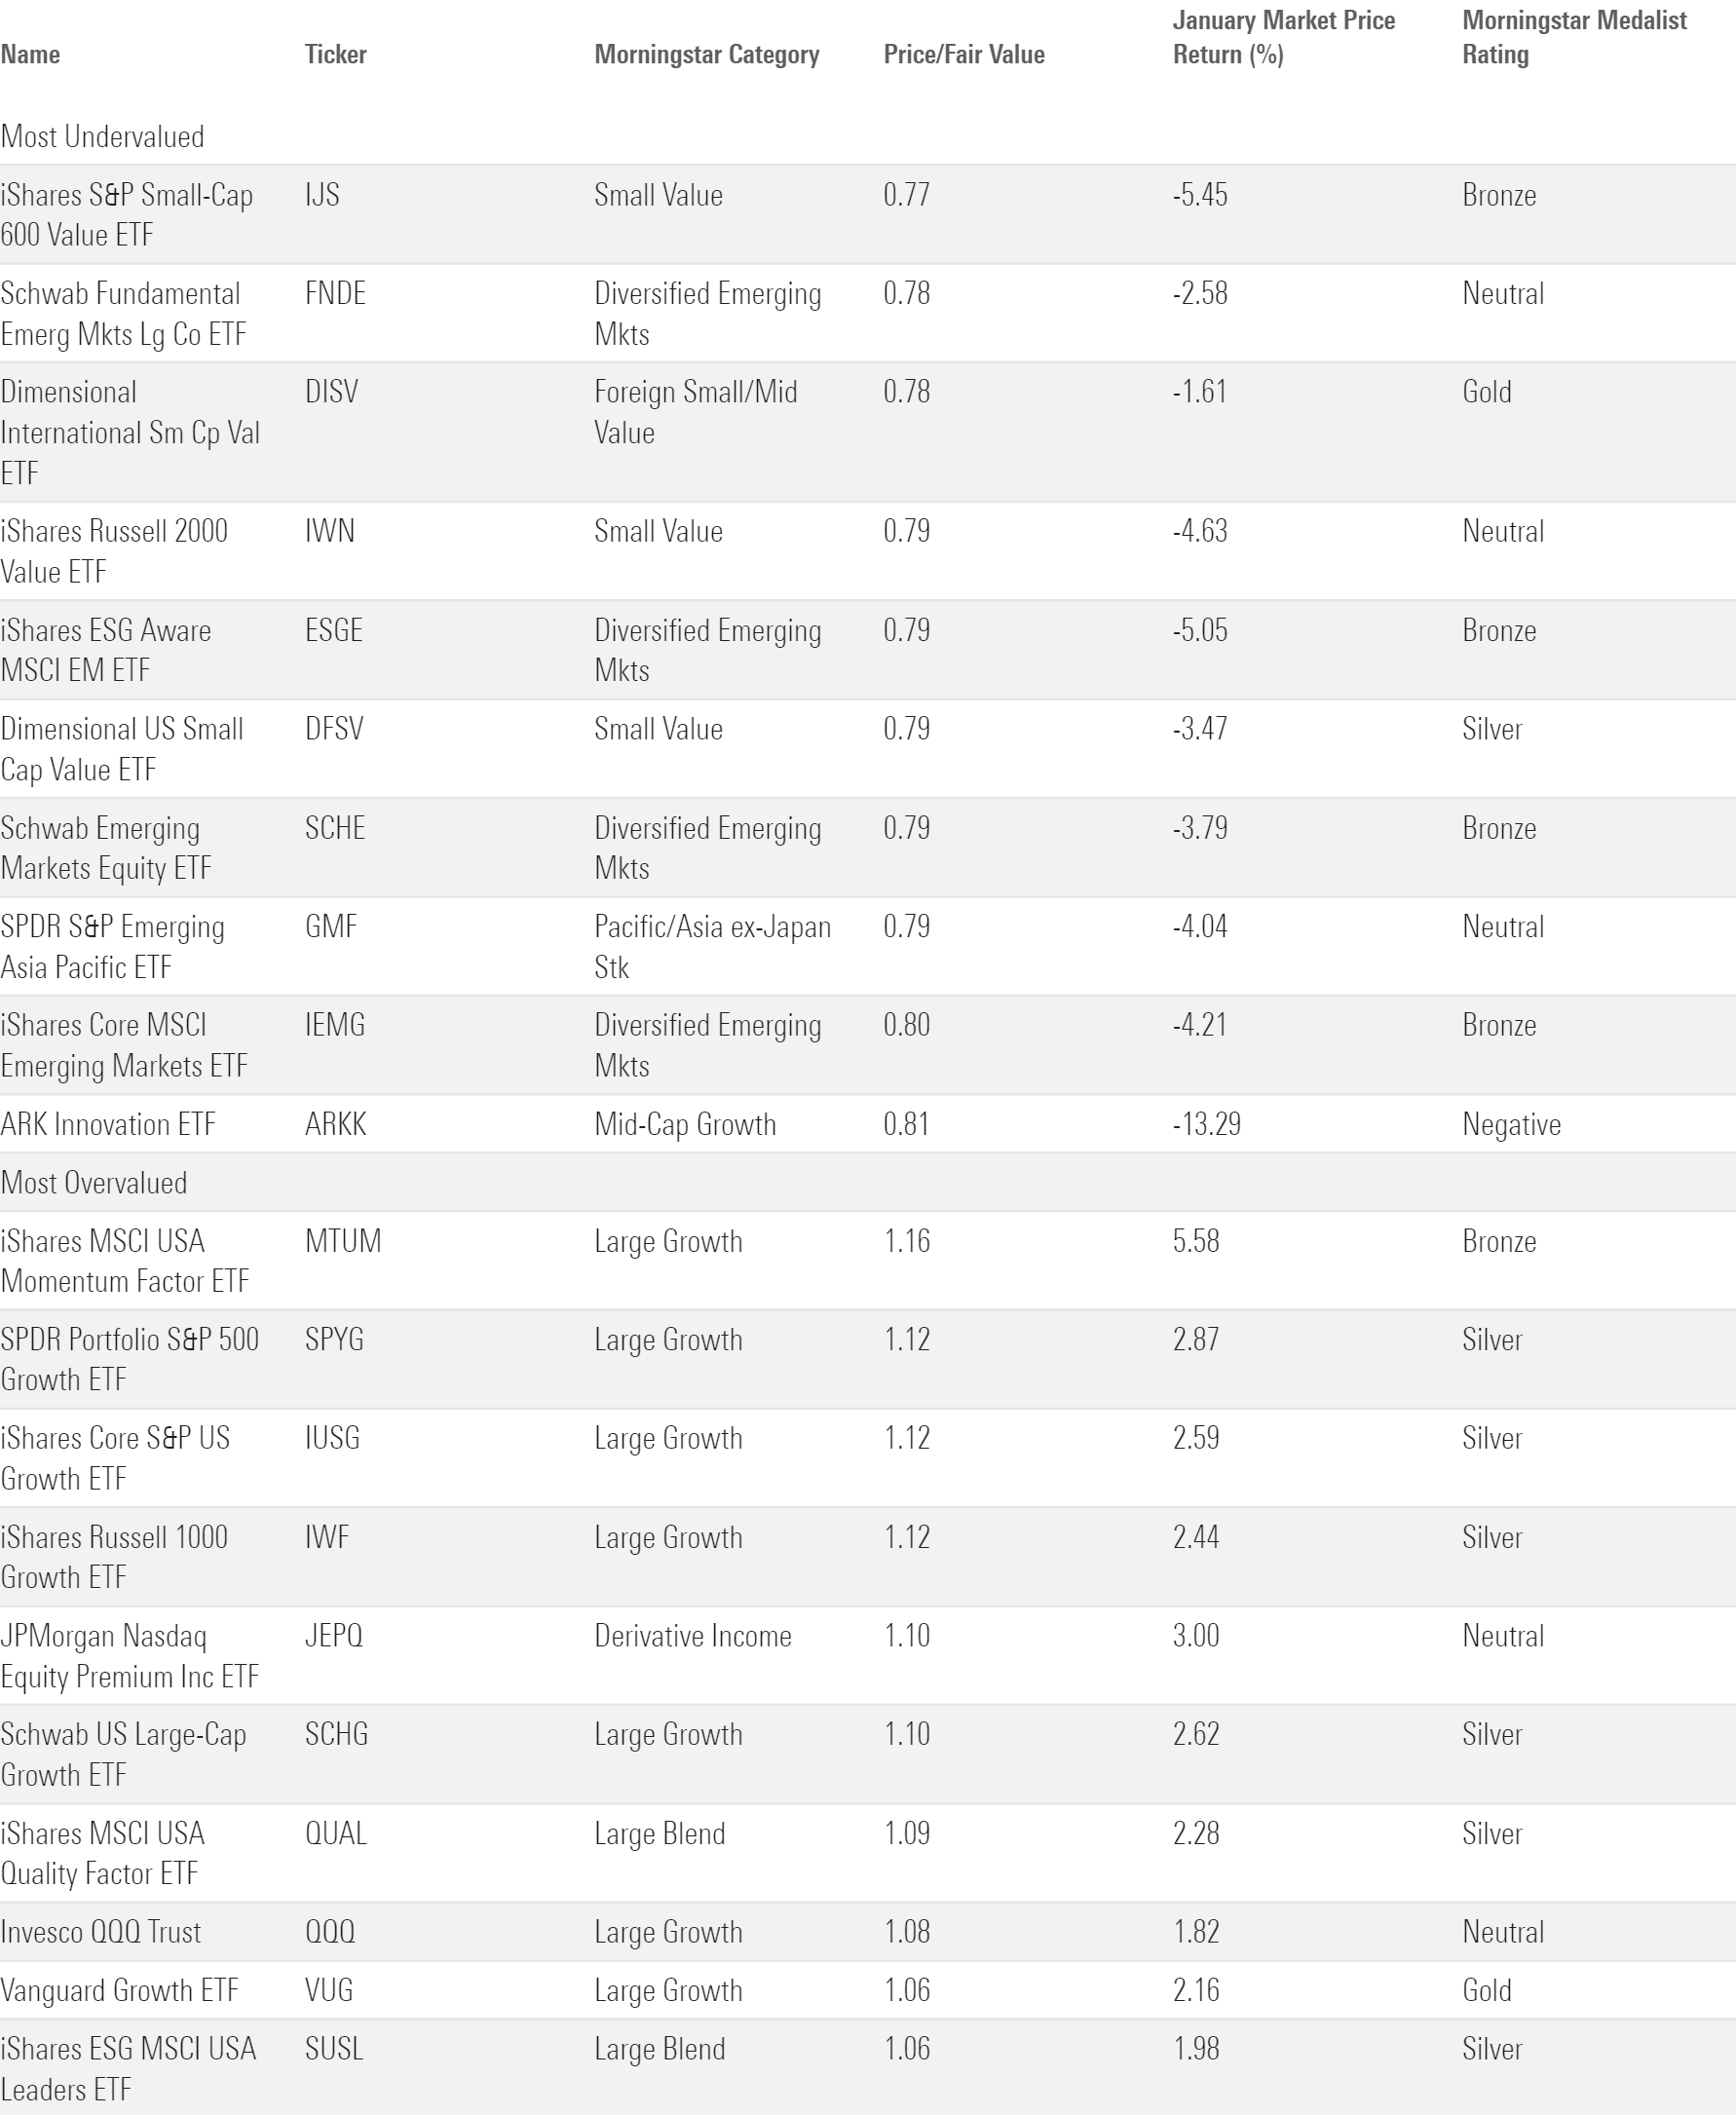
Stocks Are Getting (Slightly) More Expensive
The fair value estimate for ETFs rolls up our equity analysts’ fair value estimates for individual stocks and our quantitative fair value estimates for stocks not covered by Morningstar analysts into an aggregate fair value estimate for stock ETF portfolios. Dividing an ETF’s market price by this value yields its price/fair value ratio. This ratio can point to potential bargains and areas of the market where valuations are stretched.
Valuations remained elevated, with some ETFs’ price/fair value ratios increasing from their November and December levels. Notably, growth and momentum ETFs have gotten slightly more expensive, while value ETFs remain undervalued. Emerging-markets equity ETFs also climbed up the list of the most undervalued, likely because of their middling performance so far this year.
The 10 Most Under- and Overvalued Analyst-Rated ETFs
The author or authors own shares in one or more securities mentioned in this article. Find out about Morningstar’s editorial policies.
/cloudfront-us-east-1.images.arcpublishing.com/morningstar/EC7LK4HAG4BRKAYRRDWZ2NF3TY.jpg)
/cloudfront-us-east-1.images.arcpublishing.com/morningstar/T2LGZCEHBZBJJPPKHO7Y4EEKSM.png)
/d10o6nnig0wrdw.cloudfront.net/05-07-2024/t_9dca62d6f7b3444d90619b3637ec379b_name_file_960x540_1600_v4_.jpg)
:quality(80)/s3.amazonaws.com/arc-authors/morningstar/c00554e5-8c4c-4ca5-afc8-d2630eab0b0a.jpg)