
- Fund flows measure changes in net purchased or redeemed shares over a certain period.
- Recent performance, expense ratios, and firm reputation can affect fund flows.
The Ultimate Guide to Fund Flows
Read Time: 10 Minutes
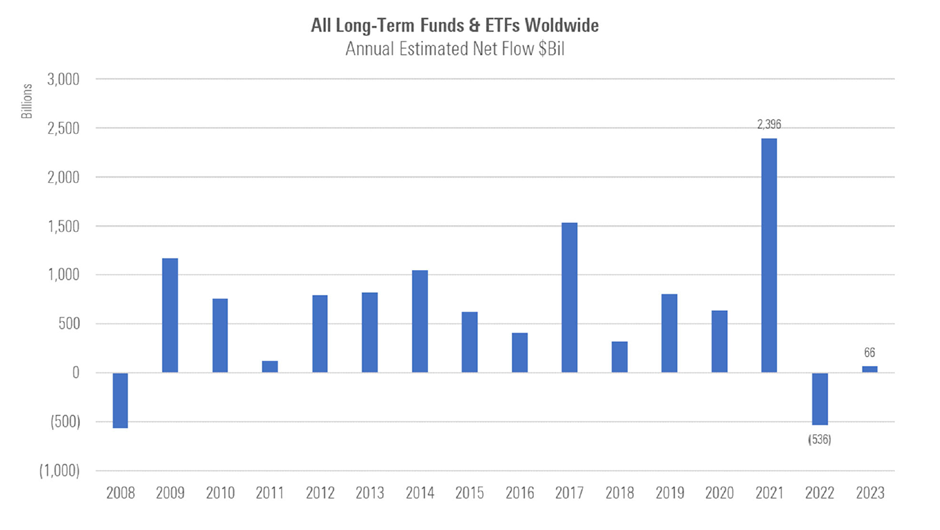
A modest $66 billion flowed into global and exchange-traded funds in 2023. In 2022, money flowed out of global funds for the first time in 14 years, with actively managed vehicles being hit especially hard.
Fund flows show a wide-angle view of how investors and financial advisors behave, revealing patterns that reflect investor sentiment and contextualise emerging trends. How do investors react to market swings? Why do investors buy some products and not others?
In this ultimate guide to fund flows, we outline how asset managers can take the pulse of the competition.
Position Investment Products With Flows Data
Since 2002, more than 3,000 share classes were launched each month.
In a seemingly ever-expanding pool of investment options, asset management firms need a way to showcase their products’ strengths.
Fund flows illuminate shared characteristics of growing investment vehicles that can validate your positioning.
If investor interest in ESG holds steady, firms could consider highlighting how they use environmental, social, and governance criteria in managing clients' assets. If one type of fund is flourishing in one region but stalling in another, firms might rethink where they concentrate their promotional efforts.
You can use this rich global data to:
- Find categories that attracted the most inflows.
- Understand who’s buying from your competitors: institutional investors? Retail investors on the direct market?
- Analyse how your products stack up against influential flow factors.
- Predict impending fund shutdowns.
- Monitor pivots in your competitors’ product strategy.
Free Download Library
Report

2023 Global Fund Flows
Take a deep dive into global fund families with Morningstar’s report, which evaluates funds by category, like exchange-traded funds or fixed-income funds, as well as region, asset class, and more.
Report

Fund Flows Commentary
Stay up to date with the latest fund flows data, covering Europe, the United Kingdom, the United States, and Japan. Find out what’s happening in your region and around the world.
Report

Global Sustainable Fund Flows
This quarterly report examines open-end funds and ETFs focused on impact, sustainability, or environmental, social, and governance (ESG) risk factors.
Guide

A Guide to Asset Flows
A step-by-step walkthrough on using asset flow data to maintain a competitive edge and discover which funds are in favour and which aren’t.
Report

SFDR Article 8 and Article 9 Funds: Q4 2023 in Review
Explore quarterly fund flows, fund launches, and regulatory updates.
Guide

Guide to Manager Research
Learn how manager research can help you build trust with your clients, enhance your performance, and personalise your offering.
Key Takeaways
How Does Morningstar Measure Fund Flows?
Fund flows measure changes in newly purchased or redeemed shares over a certain period. Fund flows are the change in assets in a given period not explained by the performance of the investment.
To calculate net flows, Morningstar uses an industry-standard approach. Our process involves comparing a fund’s total assets under management at the beginning and end of a period. Price changes, distributions, and reinvested dividends are then excluded from net flows. From there, we adjust for infrequent corporate actions such as reverse share splits.
Asset flow data intends to show shifts in investor preference with movement between noticeably different investment strategies. When possible, Morningstar offsets outflows caused by movement to another fund with an identical mandate.
To calculate the organic growth rate and show fund flows as a percentage, analysts divide net flows by the total assets under management at the beginning of the period.
Morningstar’s approach assumes that fund flows occur at the same rate over the course of the month. While fund flows are estimates, the difference from the precise total is often negligible. Morningstar will overwrite our estimates with data from managers when available.
Morningstar’s approach assumes that fund flows occur at the same rate over the course of the month. While fund flows are estimates, the difference from the precise total is often negligible. Morningstar will overwrite our estimates with data from managers when available.
Source: Morningstar Direct Asset Flows. Data as of Dec. 31, 2023.
What Factors Affect Fund Flows?
Morningstar analysts compared mutual fund flows data from 2003-14 and 2015-18. Some variables consistently lined up with investor preferences:
- Strong performance.
- Low fees.
- Positive firm reputation (measured by metrics like the Morningstar Medalist Rating).
- Recommended by independent rating agencies.
- Consider ESG criteria.
- Indexed.
Related Products and Services

Solutions for Marketers
Elevate your brand by showcasing your value, driving effective engagement, and creating great reports with ease.

Morningstar Direct
Advanced portfolio analytics and performance reporting.

Licensed Portal
Independent evaluations of equities, funds, and managed investment products.
Key Takeaways
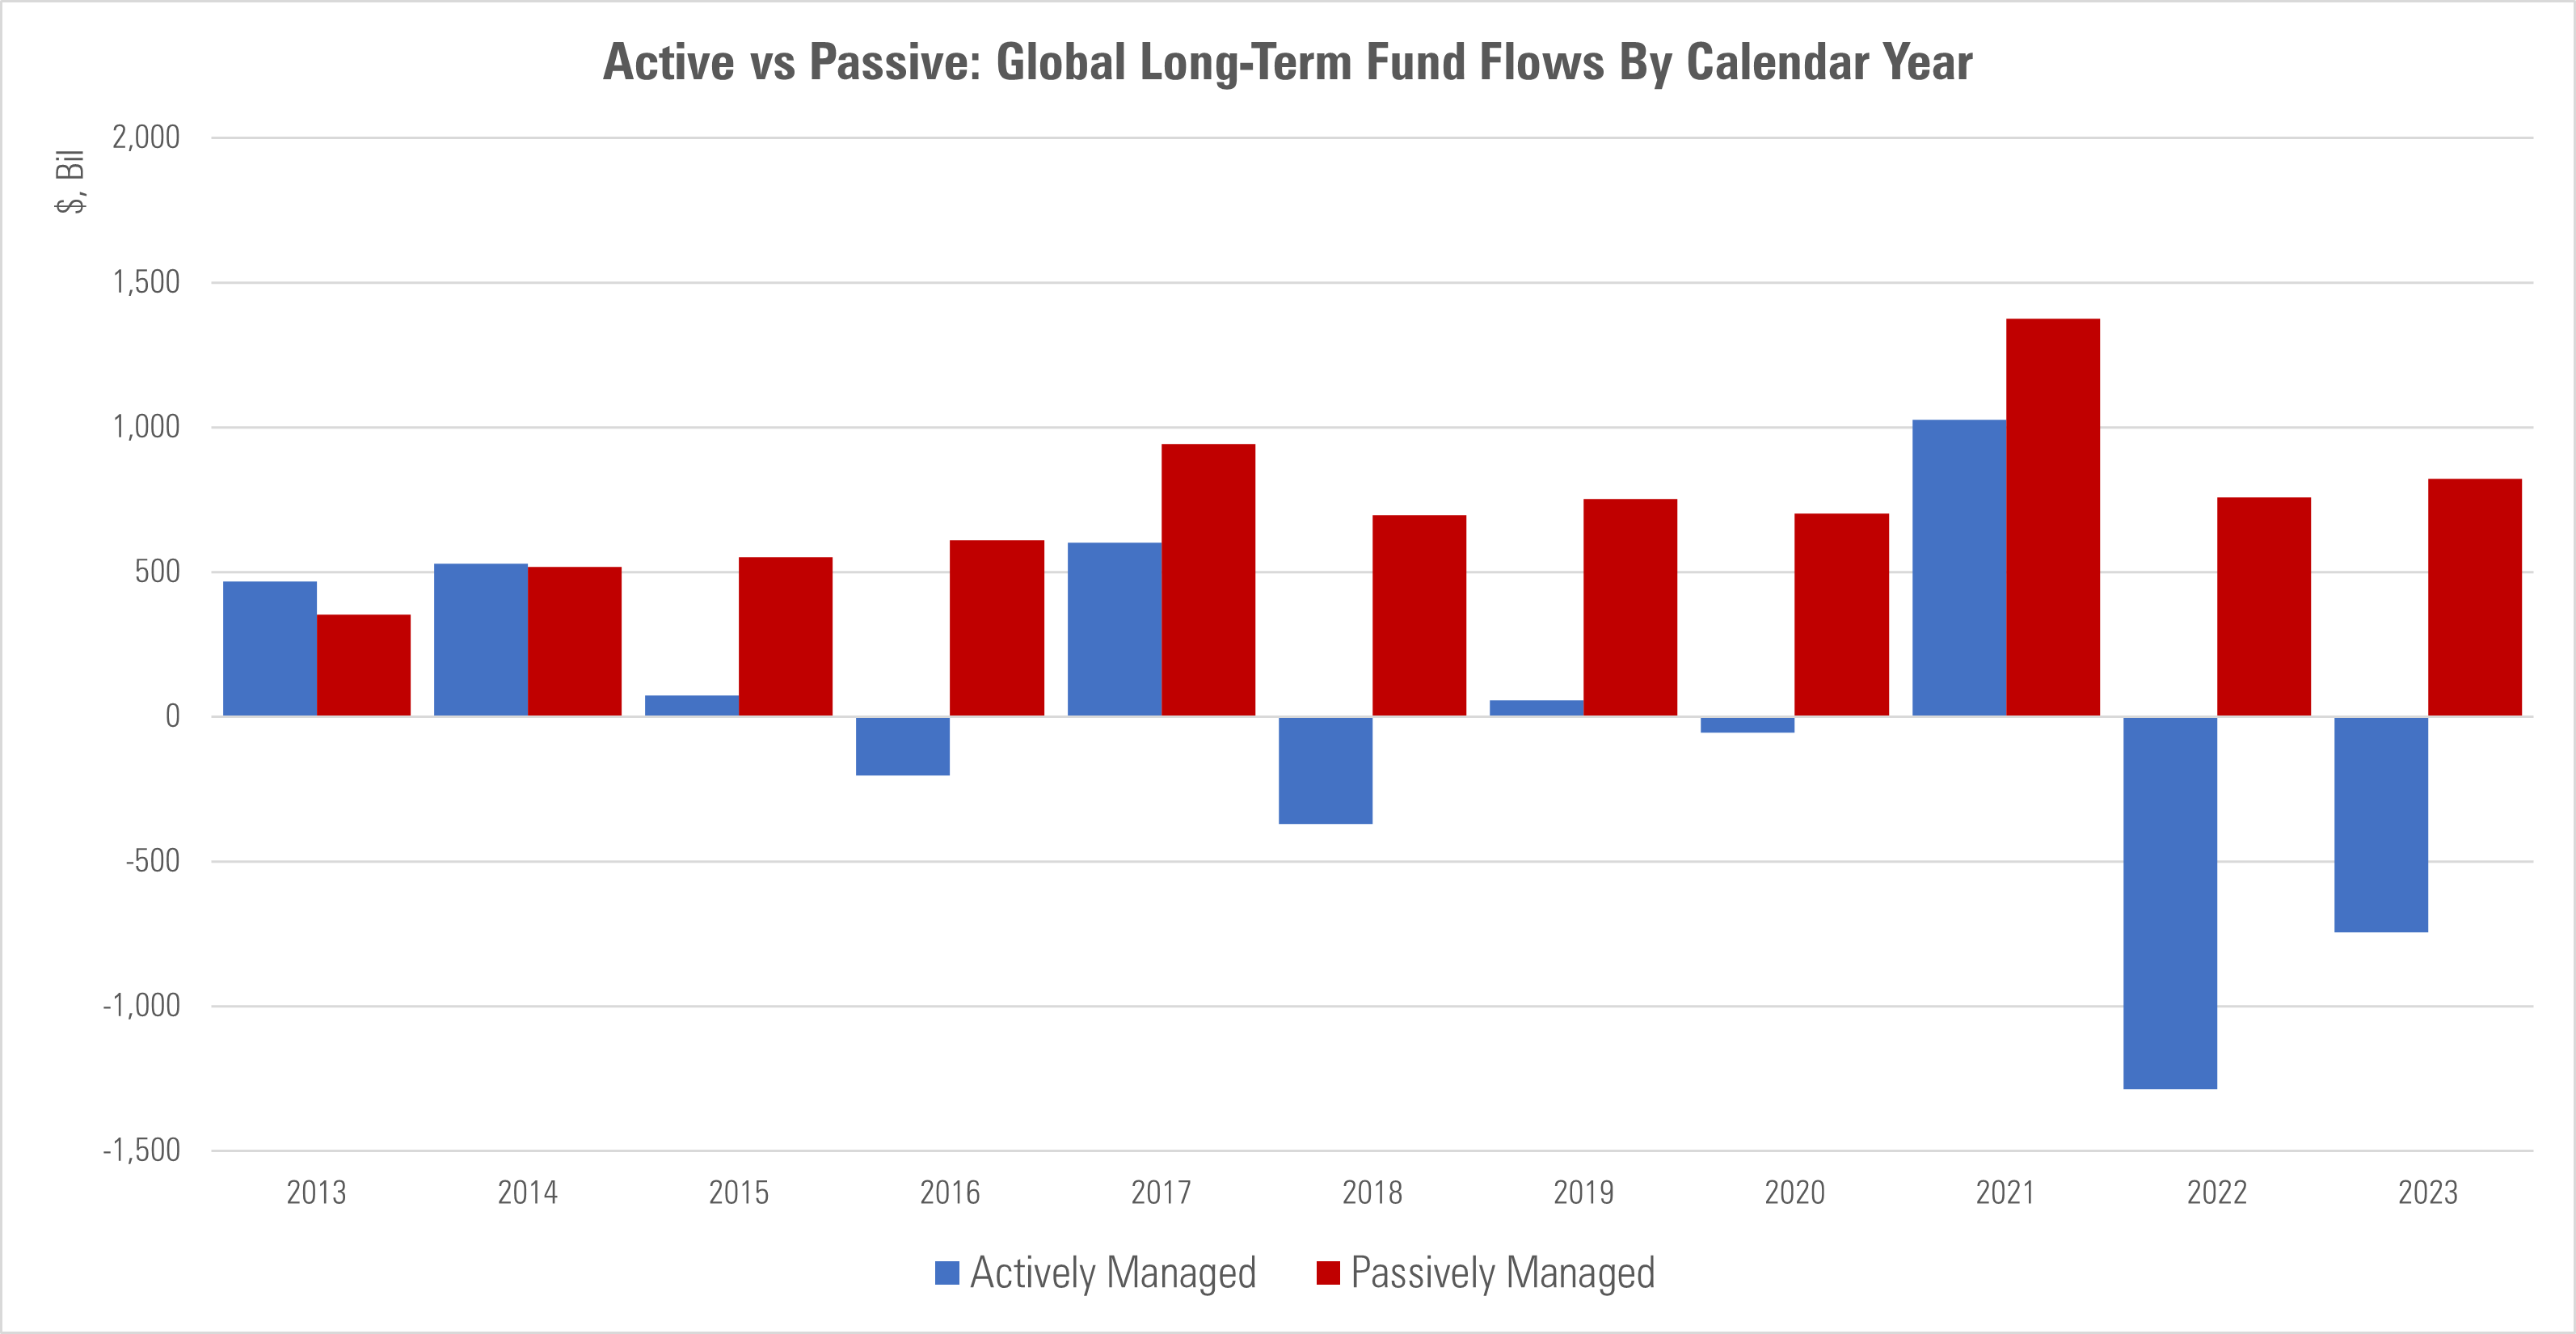
- Fund flows reveal a tidal shift of actively managed funds to passively managed ones.
- Active funds have had negative flows every year since 2015, while indexed ETFs continue to gain market share.
What Are the Types of Fund Flows?
With the right analysis, fund flows information can tell a larger story about investors.
Passive vs. active fund flows
Over the last two decades, the U.S. market has undergone a tidal shift from active to passive investment vehicles, but this trend is not reflected globally. At the end of 2023, passive funds accounted for 40% of worldwide long-term assets, and surpassed 50% in the U.S., but beyond the U.S. market, their share was only 26%. European countries including France and Spain, demonstrated a preference for short-term fixed-income funds that are actively managed. What’s more, the bank-centric distribution of funds in many countries results in investors buying shares in actively managed funds, which results in banks selling relatively expensive products to customers.
Asset flows can illuminate corners of the market where active management continues to drive mutual fund inflows. The choice between an active and passive investment strategy is a personal one. Asset flows by distribution channel can help understand the target audience of each approach.
Global fund flows
Fund flows by domicile show how investor behavior differs by country.
With detailed global data, asset managers can make informed decisions on upcoming product launches.
Source: Morningstar Direct Asset Flows. Data as of Dec. 31, 2023.
Flows by fund family
Fund family flows roll up all the funds by brand name for a big picture look at competitor performance.
Grouping flows by fund family can illustrate gaps in competitor coverage. You can see patterns in new product launches and pending fund shutdowns.
Morningstar Category fund flows
Category fund flows offer a detailed lens for analysing investor preferences. The Morningstar category reflects the underlying securities, not the prospectus.
Fund Flows by Asset Class
Because funds can contain a range of products—bonds, stocks, alternative assets—fund flows also shine a light on how investors feel about the underlying asset classes.
What investments can weather market headwinds and tailwinds?
ETF fund flows surge
In the first half of 2023, nonindexed ETFs grew at a 6% organic growth rate, representing5% of ETF assets globally. The U.S. dominates the category, with 78% of assets under management residing there.
While they hold a smaller market share, active ETFs have posted an annual organic growth rate of over 25% since 2015. Actively managed ETFs in Asia grew at a 78% rate in the first half of the year (albeit from a small base), the highest rate of any region by far.
The growth in active ETFs defies the broader shift toward passive investing. Active ETFs give investors the benefits of lower expense ratios, transparent pricing, and easy liquidity, paired with the intervention of asset managers.
Active ETFs defied the broader shift toward passive investing.
Alternative funds hold investor attention
Alternative funds diversify portfolios with exposure to different risk factors than stocks and bonds. Some look for growth in any market conditions. Others provide exposure to specific events with their own flavour of risk. Others function like bonds, aiming for small but consistent returns.
Investors can miss out on the defensive benefit of alternative funds by waiting until other investment vehicles suffer before investing.
Alternative funds grew popular in 2020 and 2021 when interest rates were low, and the stock market was booming. In 2022, when asset valuations in the traditional market began to flag, they collected over $25 billion but lost momentum by year-end.
Some alternative funds performed strongly despite a tough 2022, providing shelter from interest rate–sensitive sectors.
In 2023, fixed-income funds were the only category group with inflows, taking in $395 billion.
Inflows ebb for fixed-income funds
Fixed-income funds logged record-breaking paper losses in 2022. Bond funds posted their worst absolute outflows and organic growth rates in over two decades.
While the total 2022 outflows of $476 billion are significant, it looks small against the massive $968 billion inflows of 2021 alone, and even smaller compared to the $6 trillion of inflows into fixed-income funds from 2009 to 2021.
Allocation funds continue to slide
Asset allocation funds target a specific percentage of equity and fixed-income assets to deliver a combination of capital appreciation and income to investors. The category also includes target retirement funds that will rebalance aggressive and conservative investments as owners move closer to withdrawal.
Allocation flows had a disastrous 2023, and the category’s USD 165 billion in outflows were the worst ever on an absolute and organic basis. Asset allocation funds offer diversification but don’t allow for personal adjustments, instead locking investors into one risk tolerance level.
Key Takeaways
- Asset flows show that ESG attributes are important for many investors, even in downturns.
- Overall, today’s investors think long-term about their financial goals.
Propelled by an interest in lower fees, investors have sought out index funds at growing rates.
Fund Flows in Charts
ESG investing trends
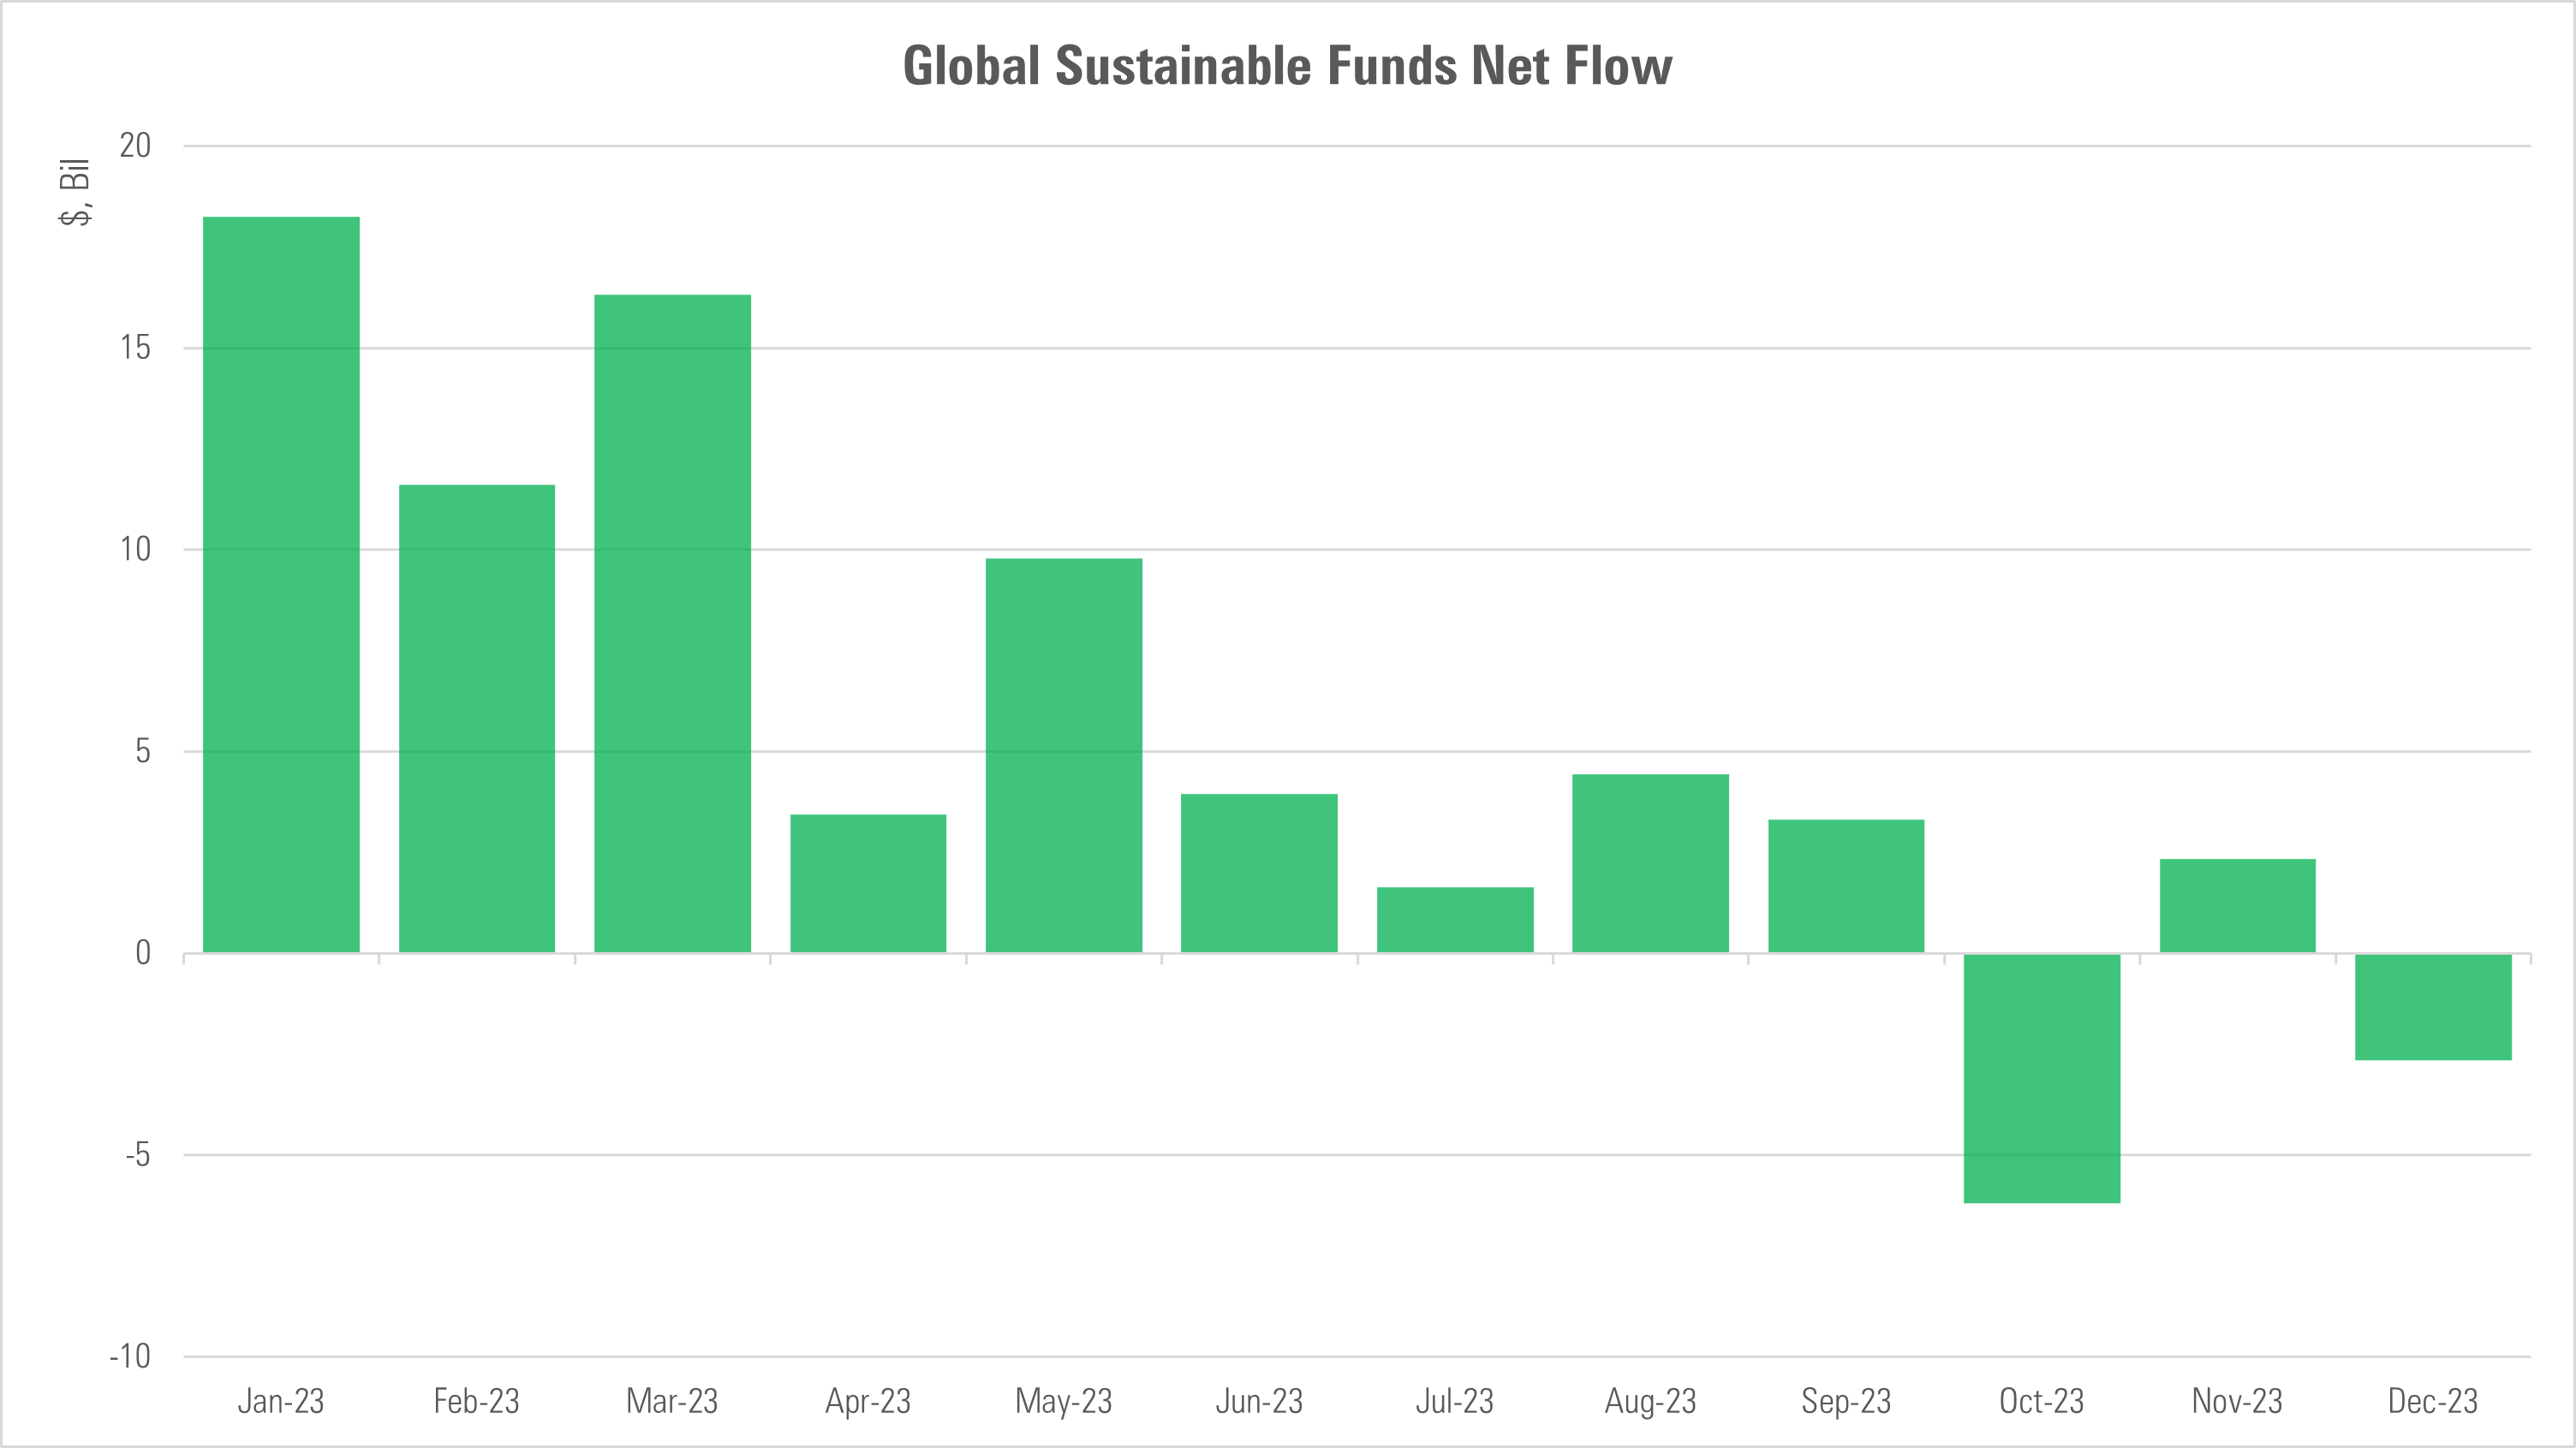
Environmental, social, and corporate governance investing has reached the mainstream. But after a year of market turmoil, will investors hold on to their sustainable investments? Do they think of ESG criteria as “nice-to-haves” or essentials?
Asset flows give us context.
Despite—or perhaps because of—the backlash against ESG investing, investors have put more money into sustainable funds than non-sustainable funds for the year to date, though the rate of flows into intentional sustainable funds fell sharply from 2021 to 2022 and fell again in 2023 to a 2% organic growth rate, with inflows of $59 billion. However, sustainable flows remained positive, thanks to $73 billion from Europe and cross-border investors.
Source: Morningstar Direct Asset Flows. Data as of Dec. 31, 2023.
Investors stick to their asset allocations
As the equities market rebounded after the 2008 market crash, investors let their stock allocation grow. Bond allocation has held steady in recent years, while money-market holdings have begun to dwindle.
The 2022 downturn proved the mettle of investors. Despite significant outflows, most assets stayed where they were. Overall, today’s investors think long-term about their financial goals.
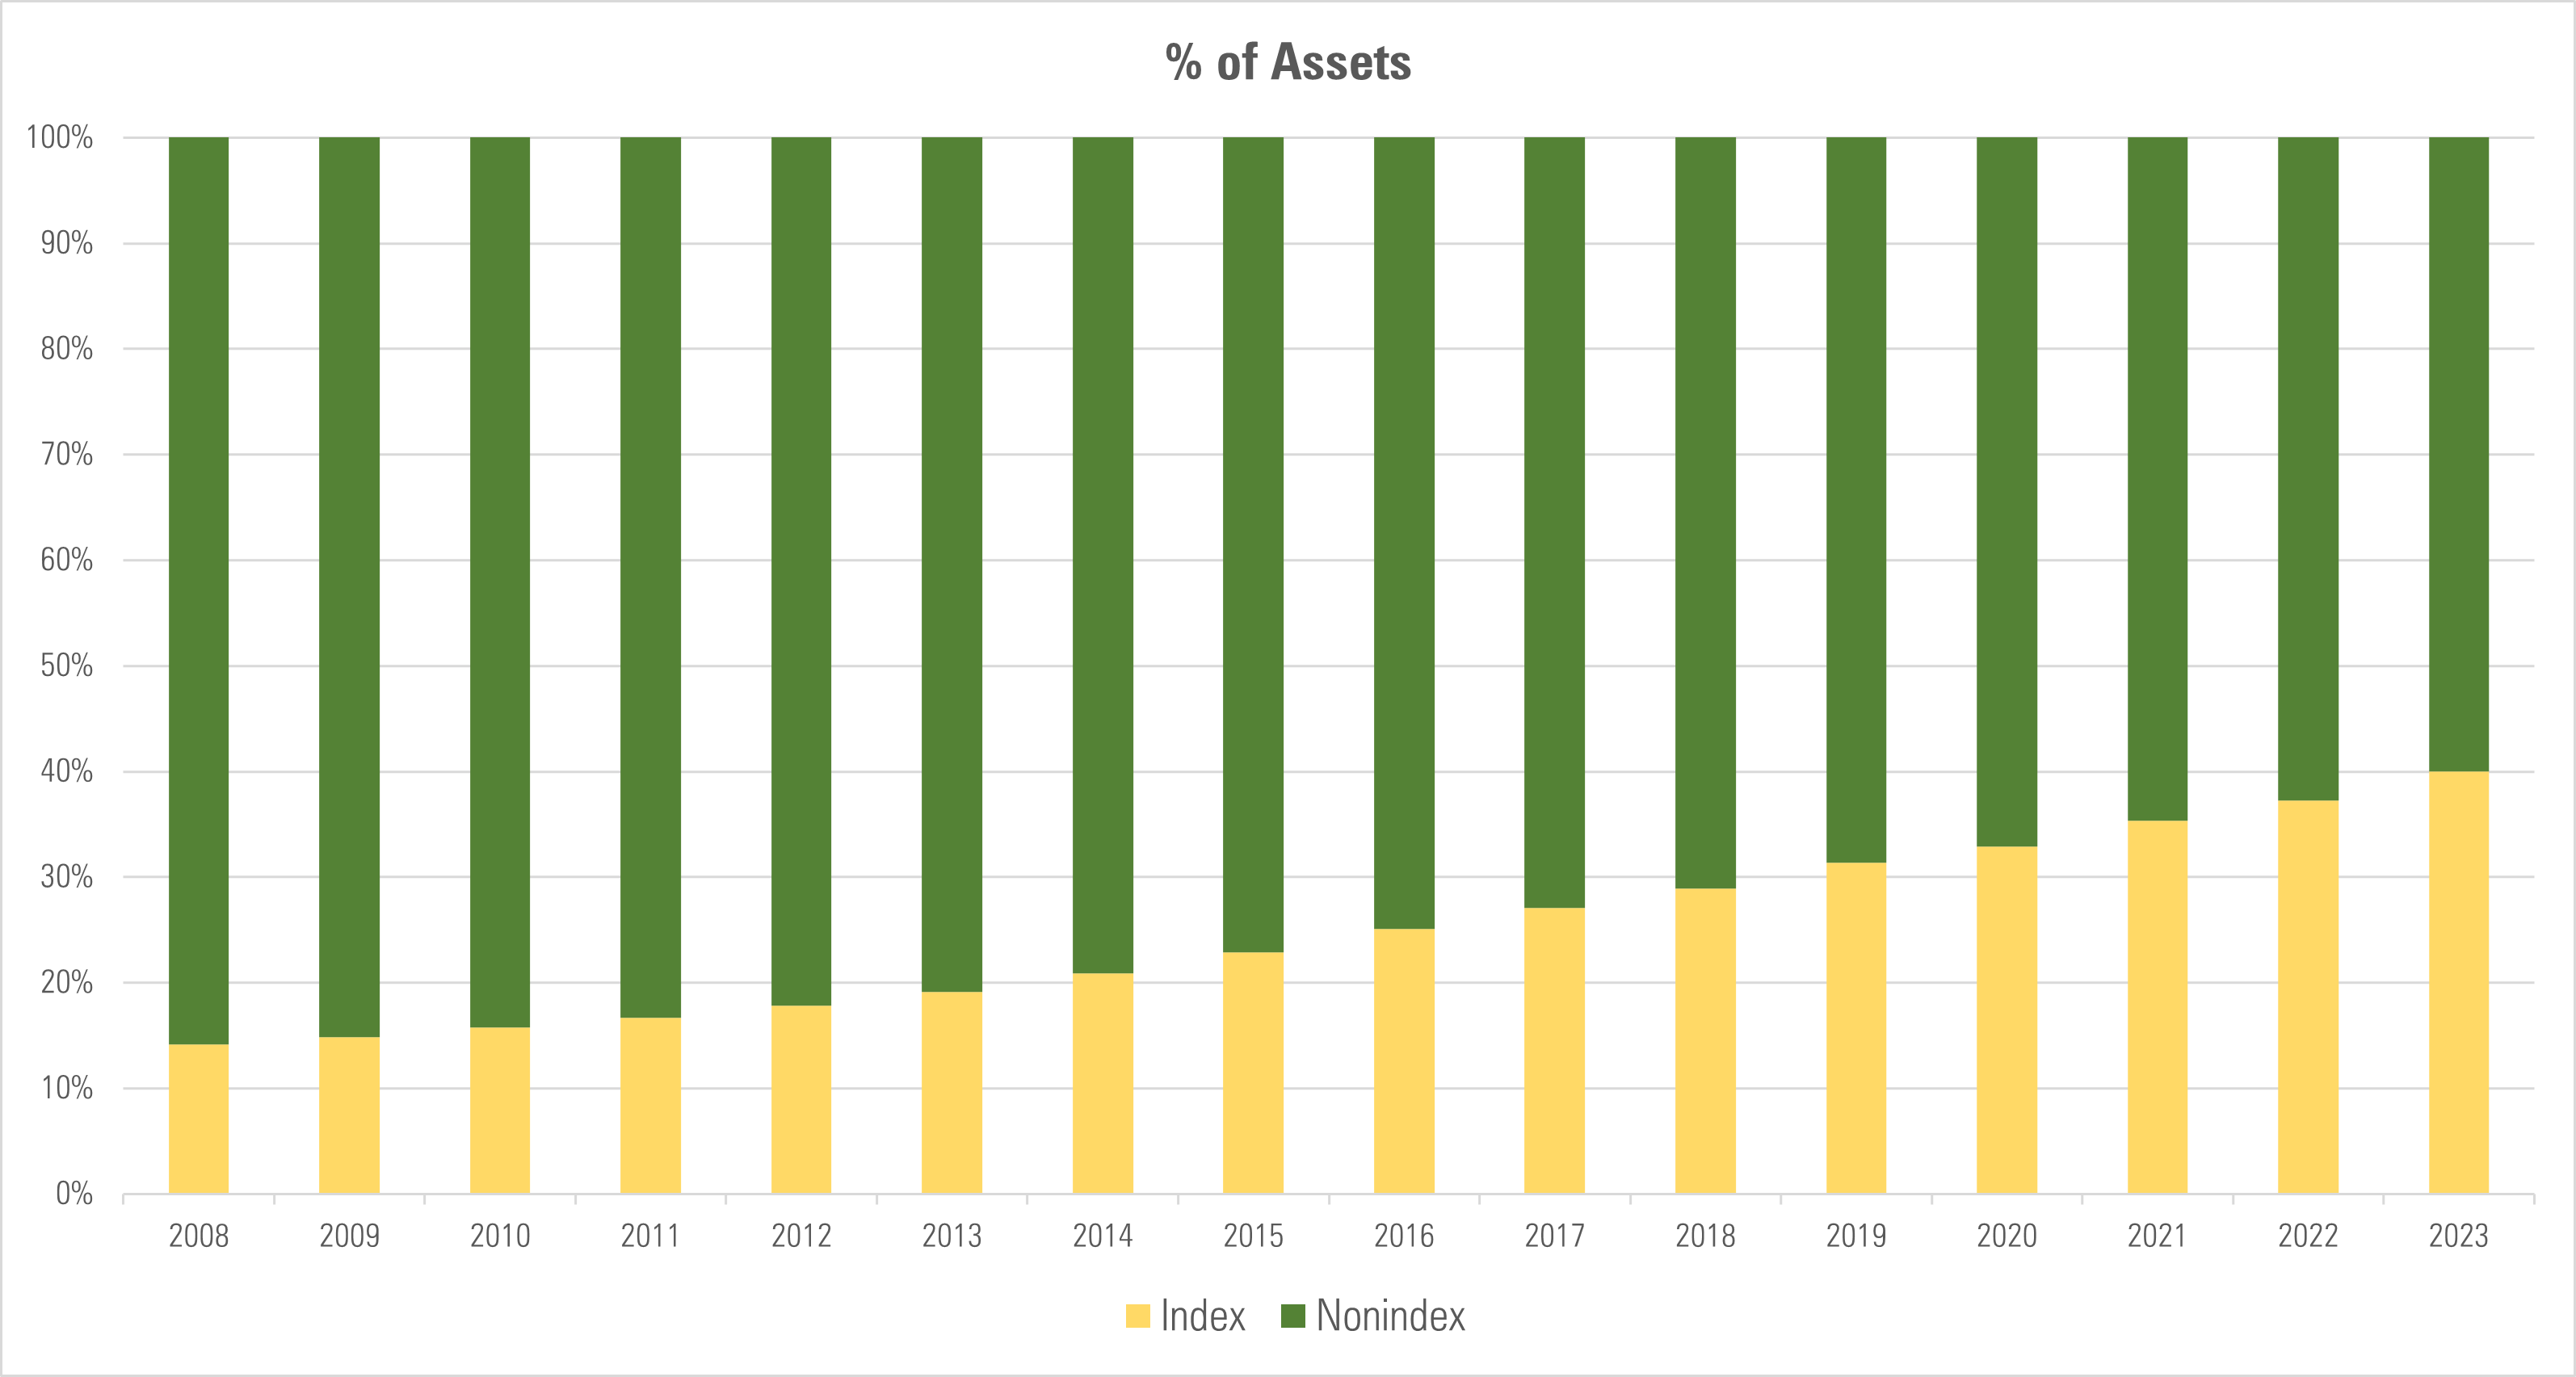
Trends in active vs. passive fund management
Propelled by an interest in lower fees, investors have sought out index funds at growing rates. Indexed vehicles had $747 billion in inflows in 2022, while their actively managed counterparts shed $1.28 trillion.
Index funds have eroded the market dominance of non-index funds at an annual 1% rate since 2013. In recent years, that pace has accelerated. Indexed assets’ market share increased by 2.3% to 38% in 2022. Investors’ preference for passive vehicles has increased to 39% today from 31% at the end of 2019. In 2023, indexed ETFs grew 8%, on an organic basis, while ex-U.S. actively managed ETFs grew 28%
Source: Morningstar Direct Asset Flows. Data as of Dec. 31, 2023.
Where Can I Find ETF Fund Flow Data?
In Morningstar Direct, asset management firms can dig into the underlying data to contextualise the market. Every month, a Morningstar mutual funds report recaps flows by asset class, domicile, and Morningstar category. These reports cover fund flows data in the Europe, the United Kingdom, the United States, and Japan. Our researchers publish a global retrospective each year.
Report
Fund Flows Commentary
Stay up to date with the latest fund flows data, covering Europe, the United Kingdom, the United States, and Japan. Find out what’s happening in your region and around the world.
How Can Asset Managers Use Fund Flows Information?
Flows can help inform marketing as a window into investor preferences. Do investors choose funds based on their recent performance or low expenses? How can fund managers position their products in line with investor expectations?
Asset flows can also help firms prioritise which funds to promote or deemphasise in which regions. Shift resources to products that reflect investor interest.
Fund flows shed light on AUM trends across major fund families. Find gaps in the competition and discover ways to differentiate your firm.
Asset Flows in Morningstar Direct
Morningstar Direct gives users the data, research, and analysis they need on over 600,000 collective investments. In the platform, asset managers can show how their investment stories relate to the broader markets, compare products with the competition, and present their findings in compliance-friendly reports.
Morningstar’s asset fund flows data contains historical data alongside forecasting models for future growth rates. Direct includes all fund flows data at one price with its performance reporting, presentation, and search capabilities. The Direct team also supports new users with onboarding, training materials, and 24-hour customer service.
Customise your fund flows research. Schedule a demo today!