
14 Charts Financial Advisors Should Show Clients
Providing context around stock markets, inflation, market concentration, and more.

A New Bull Market?
Optimism was in short supply entering the year, with many different measures of sentiment hovering near all-time lows. Stocks didn’t share the concern.
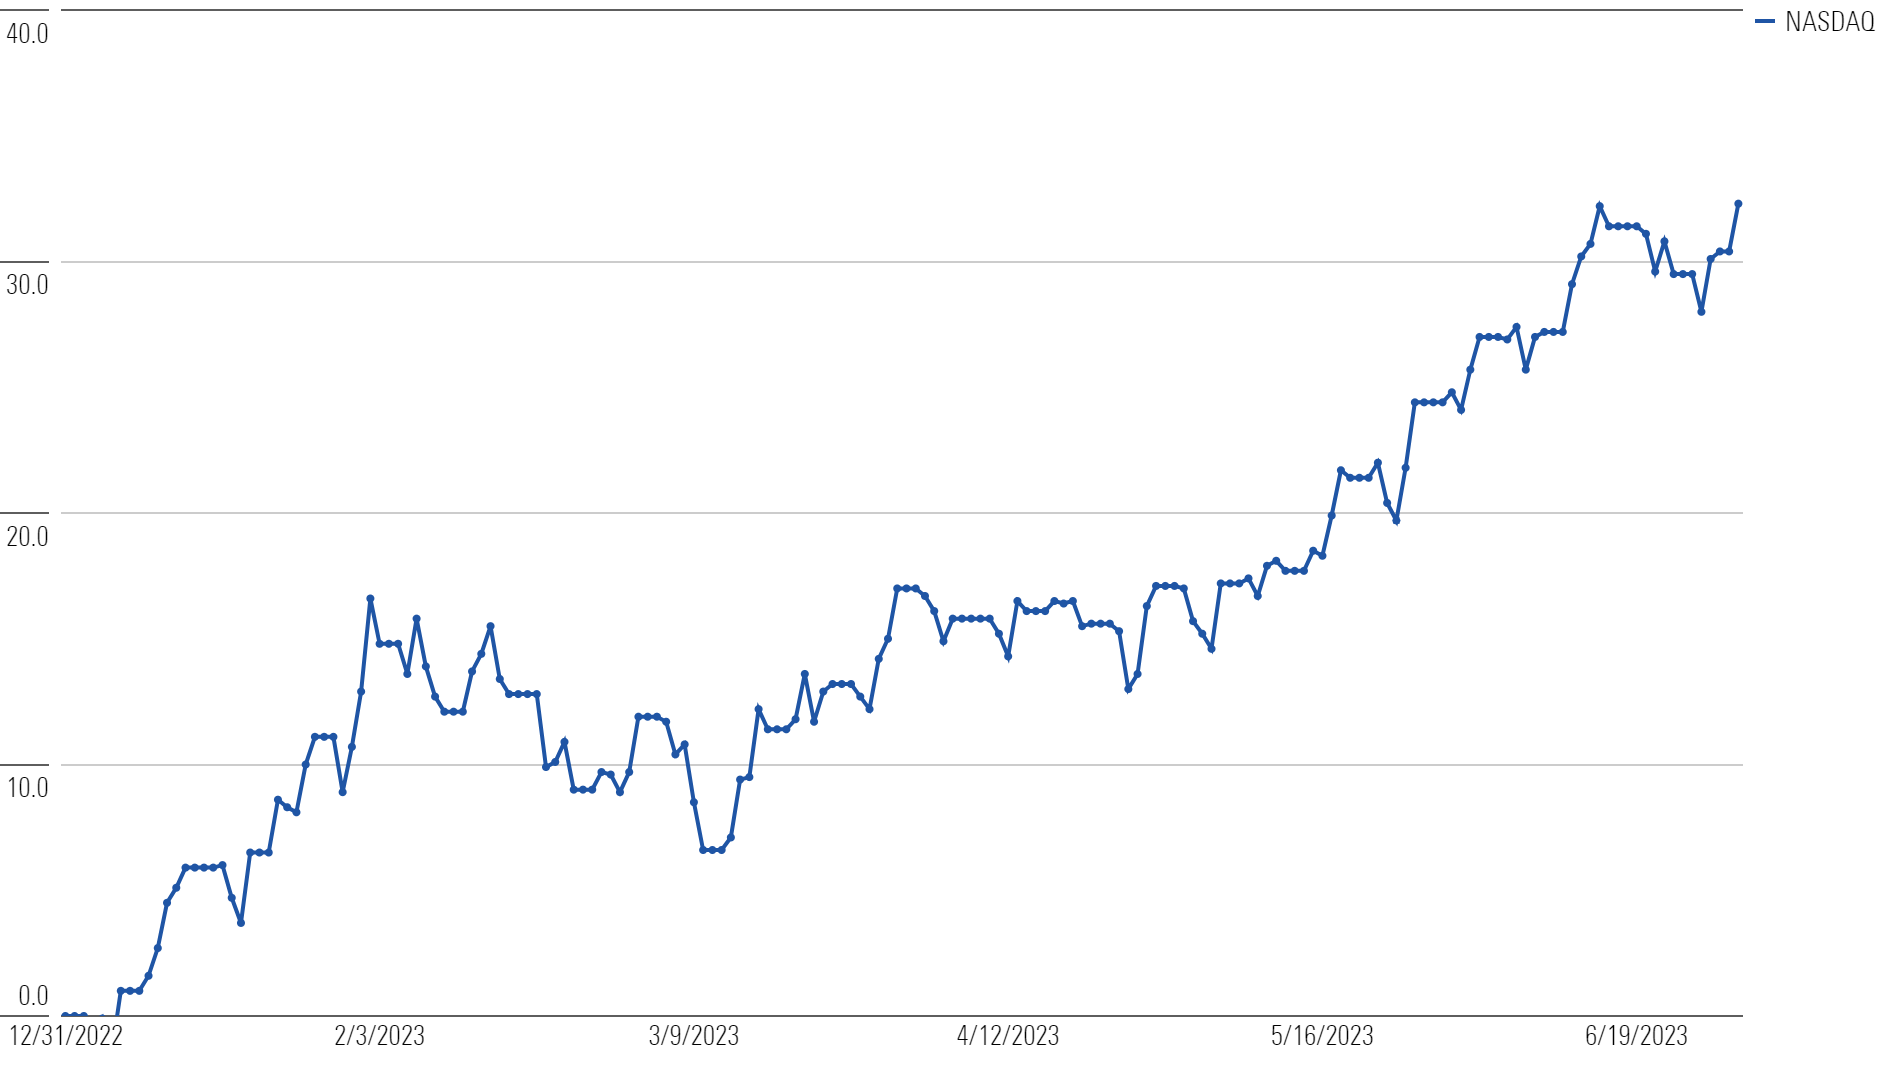
The tech-heavy Nasdaq put together a historic first half, finishing up 32% for its best start to the year since 1983.
Nasdaq Year-to-Date Return
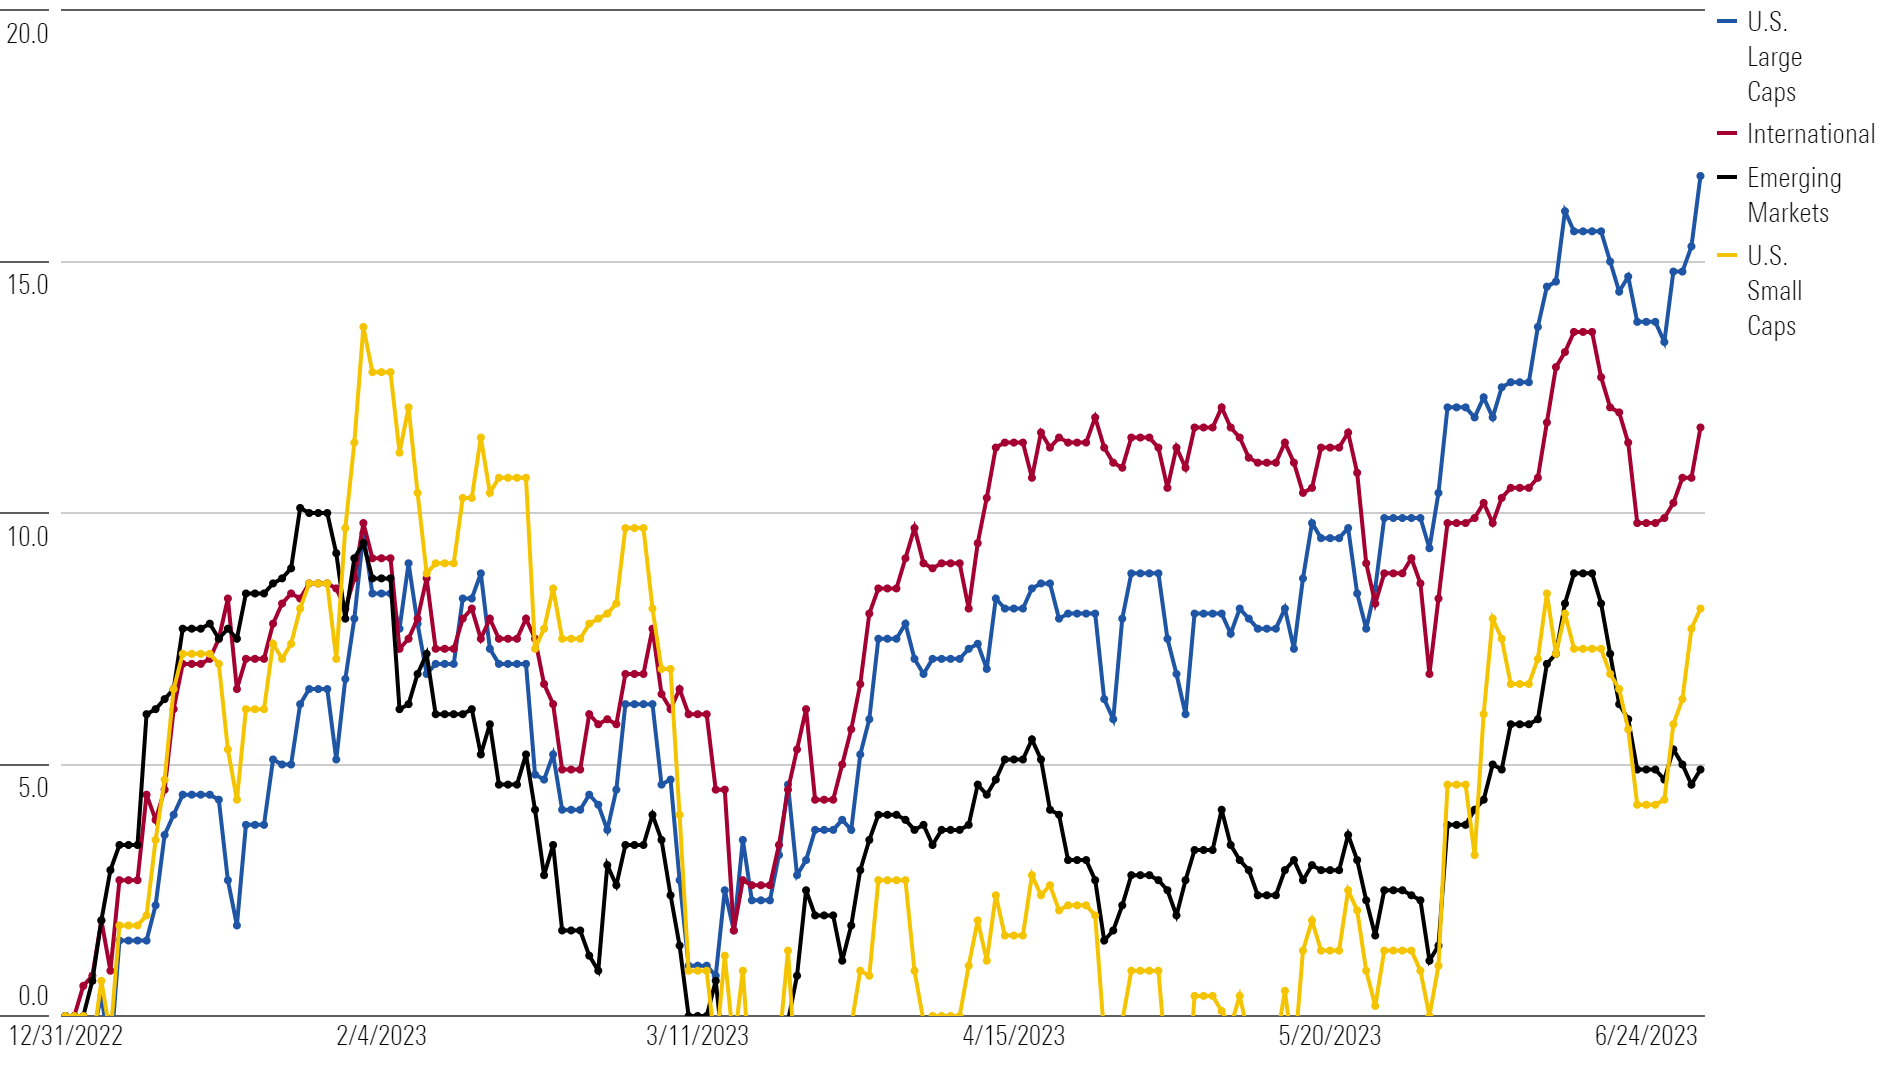
And the Nasdaq wasn’t a “party of one.” U.S. large caps, U.S. small caps, international stocks, and emerging markets are all in positive territory as well.
Year-to-Date Returns
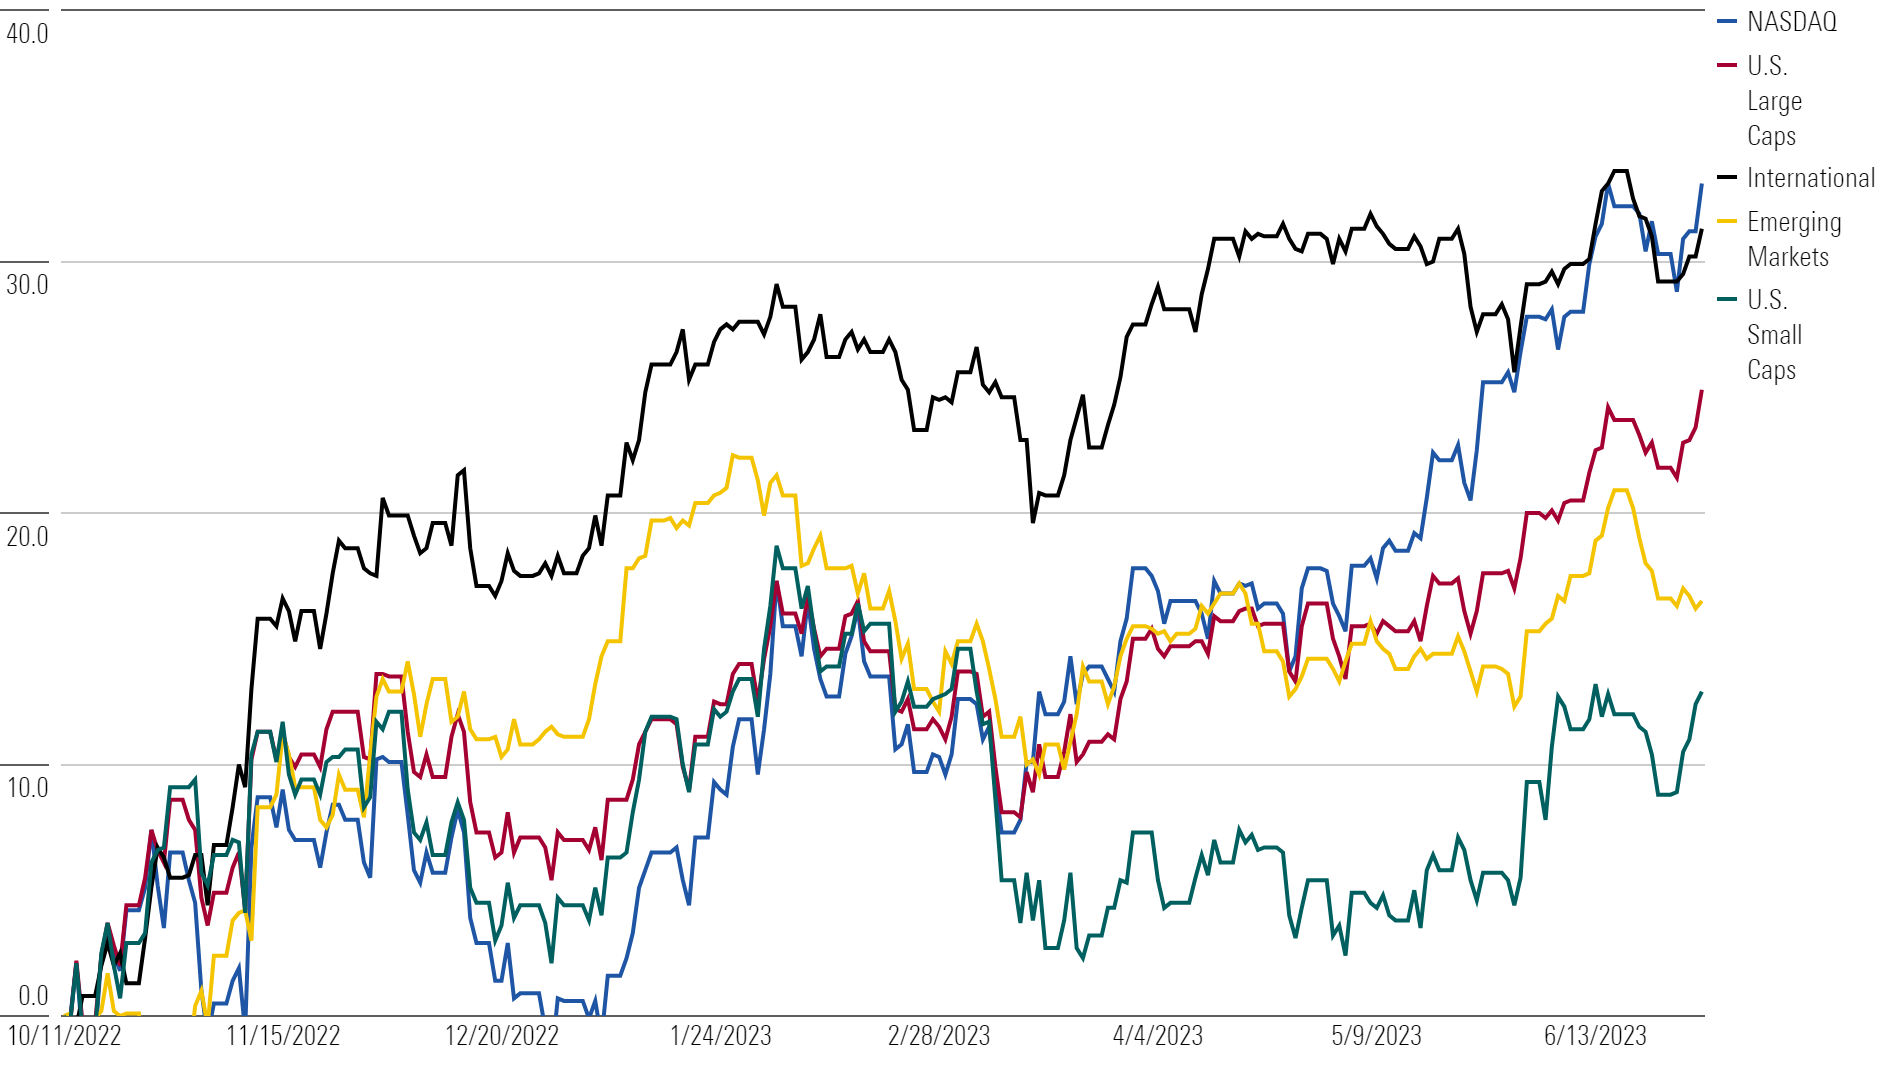
The market made a collective bottom during the middle of October. From those October lows, all the major indexes are meaningfully positive, with quite a few meeting the technical definition of a bull market, up more than 20%.
Returns Since October Lows
In short, welcome to the new bull market. Or maybe a bull market, as it’s always possible the trends observed in the first half unwind in the second half.
There’s certainly a case to be made that we’re living through a “bear-market rally” when considering how few stocks are driving the market’s gains.
But whether you call something a bull market or a bear market is semantics. It may affect how things are recorded in the history books, but naming conventions don’t change the quantifiable facts: Markets have charted a consistent upward course since October.
And while people may disagree about whether we should call it a bull market, what matters is that everyone can agree that the market is up significantly and the breadth of the rally is narrow.
That said, narrow breadth isn’t necessarily a bad thing.
Top-Heavy Market
Every few years, different investing arguments have a way of recycling themselves. Recently, there’s been increased emphasis on the concentration that exists at the top of the U.S. stock market.
Through the middle of June, approximately seven stocks—commonly referred to as the magnificent seven—make up roughly 80% of the total return in U.S. large caps.
U.S. Large Cap: Return Contribution by Stock Year-to-Date
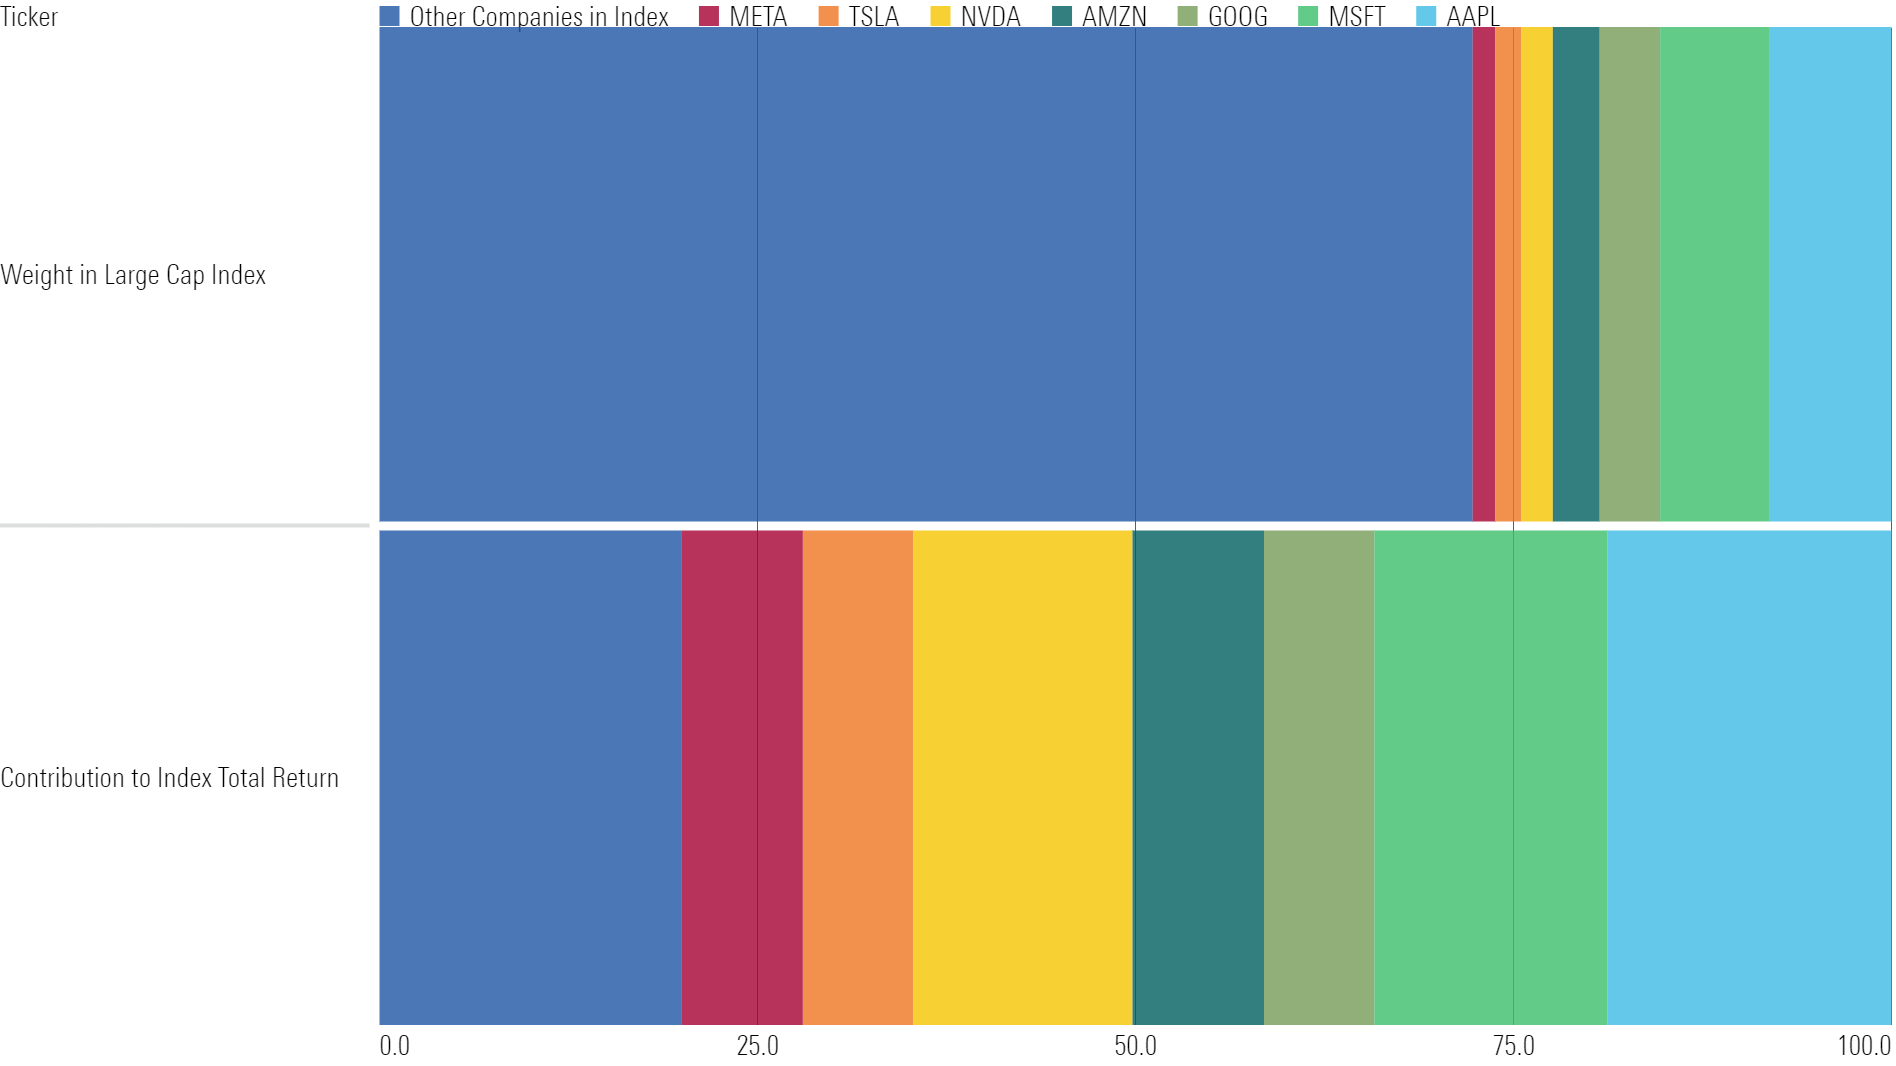
To many, this is problematic. It’s often said that markets are weakest when they are narrow. And with so few stocks delivering most of the gains, the U.S. market is extremely narrow.
Aswath Damodaran—often referred to as the “dean of valuation”—recently weighed in on this topic, mentioning:
“This lack-of-breadth thing drives me crazy. You know what? Markets have never had breadth.”
Damodaran went on to add that he recently looked at 80 years of market data and found that periods of strong market returns were commonly carried by 10% of stocks or less.
Put simply, it’s normal for the market to be dominated by a few companies.
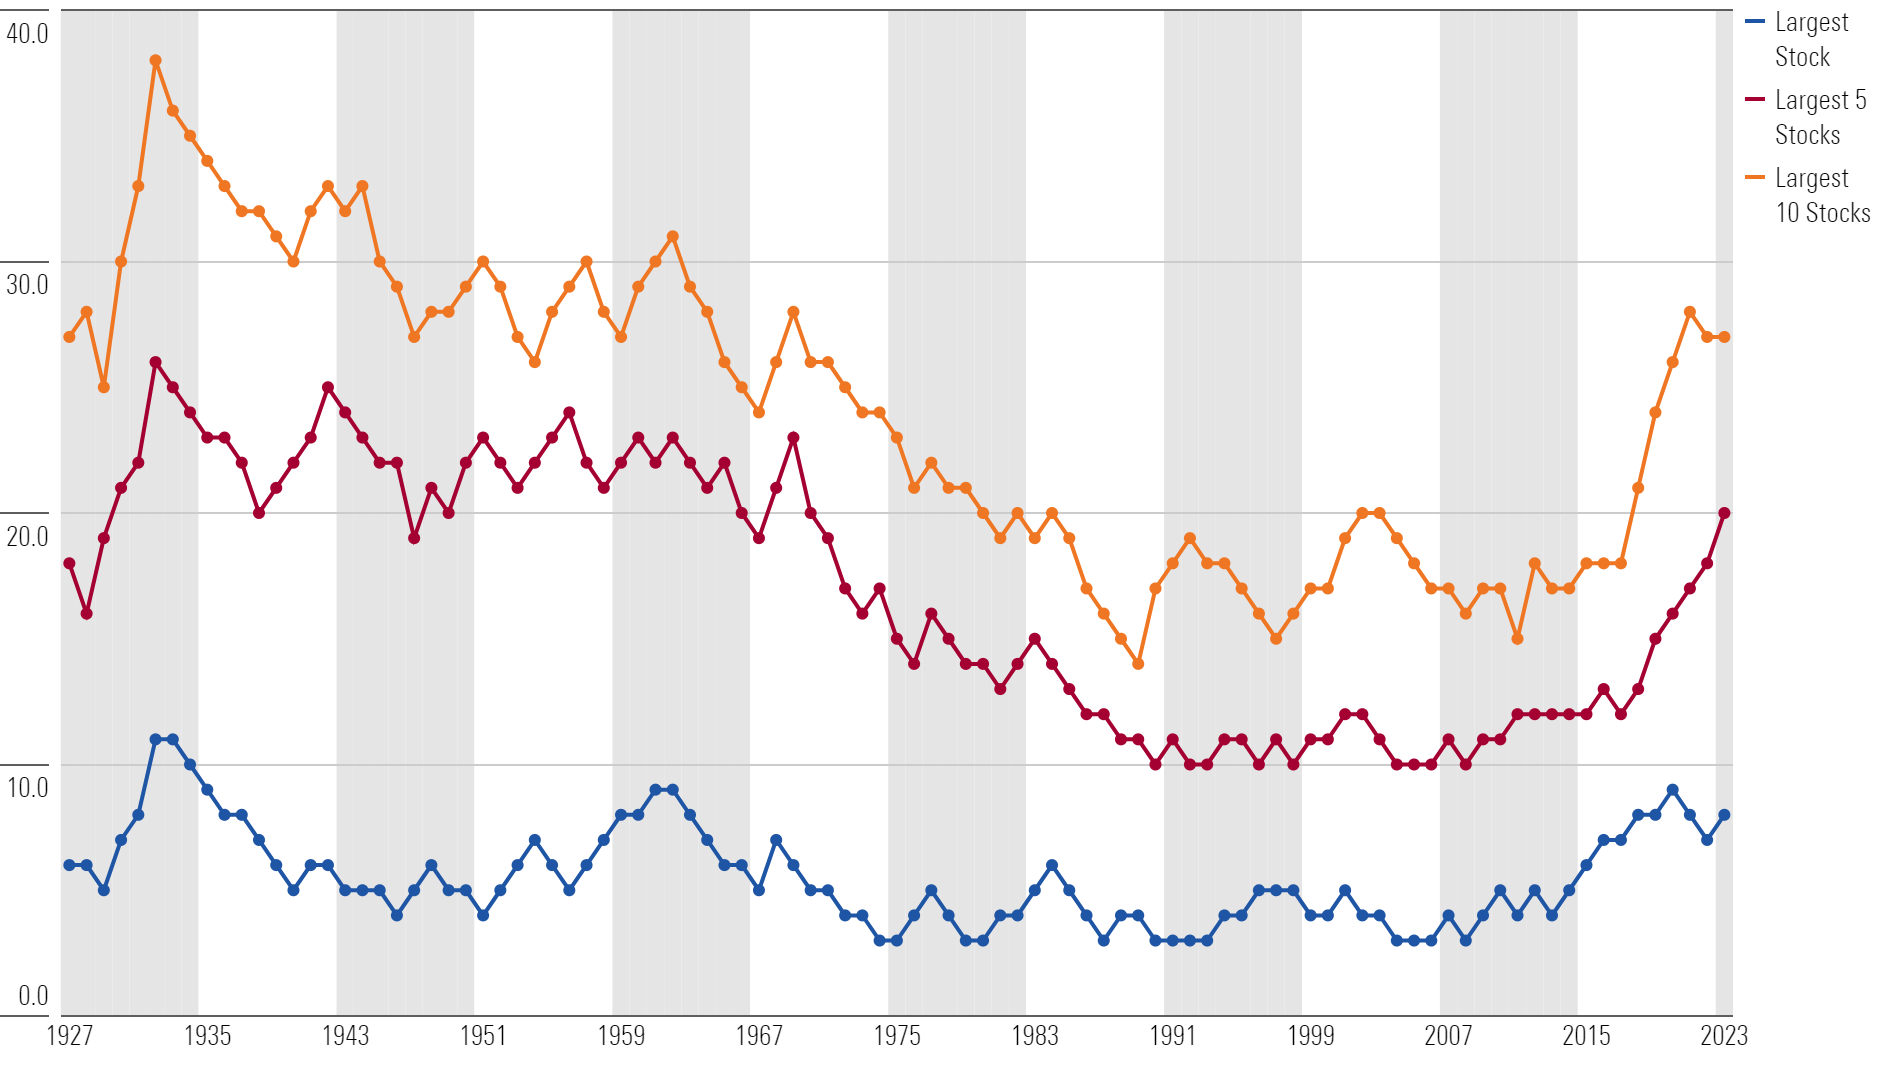
As you can see below, at different points throughout history, the combined index weight of the top single stock, top five stocks, and top 10 stocks has hovered in similar ranges to their current ranges.
Total Weight of Largest Stocks in U.S. Large Cap Index
What Recession?
Coming into 2023, most economists were pretty convinced that the U.S. economy would dip into a recession—it was a consensus forecast.
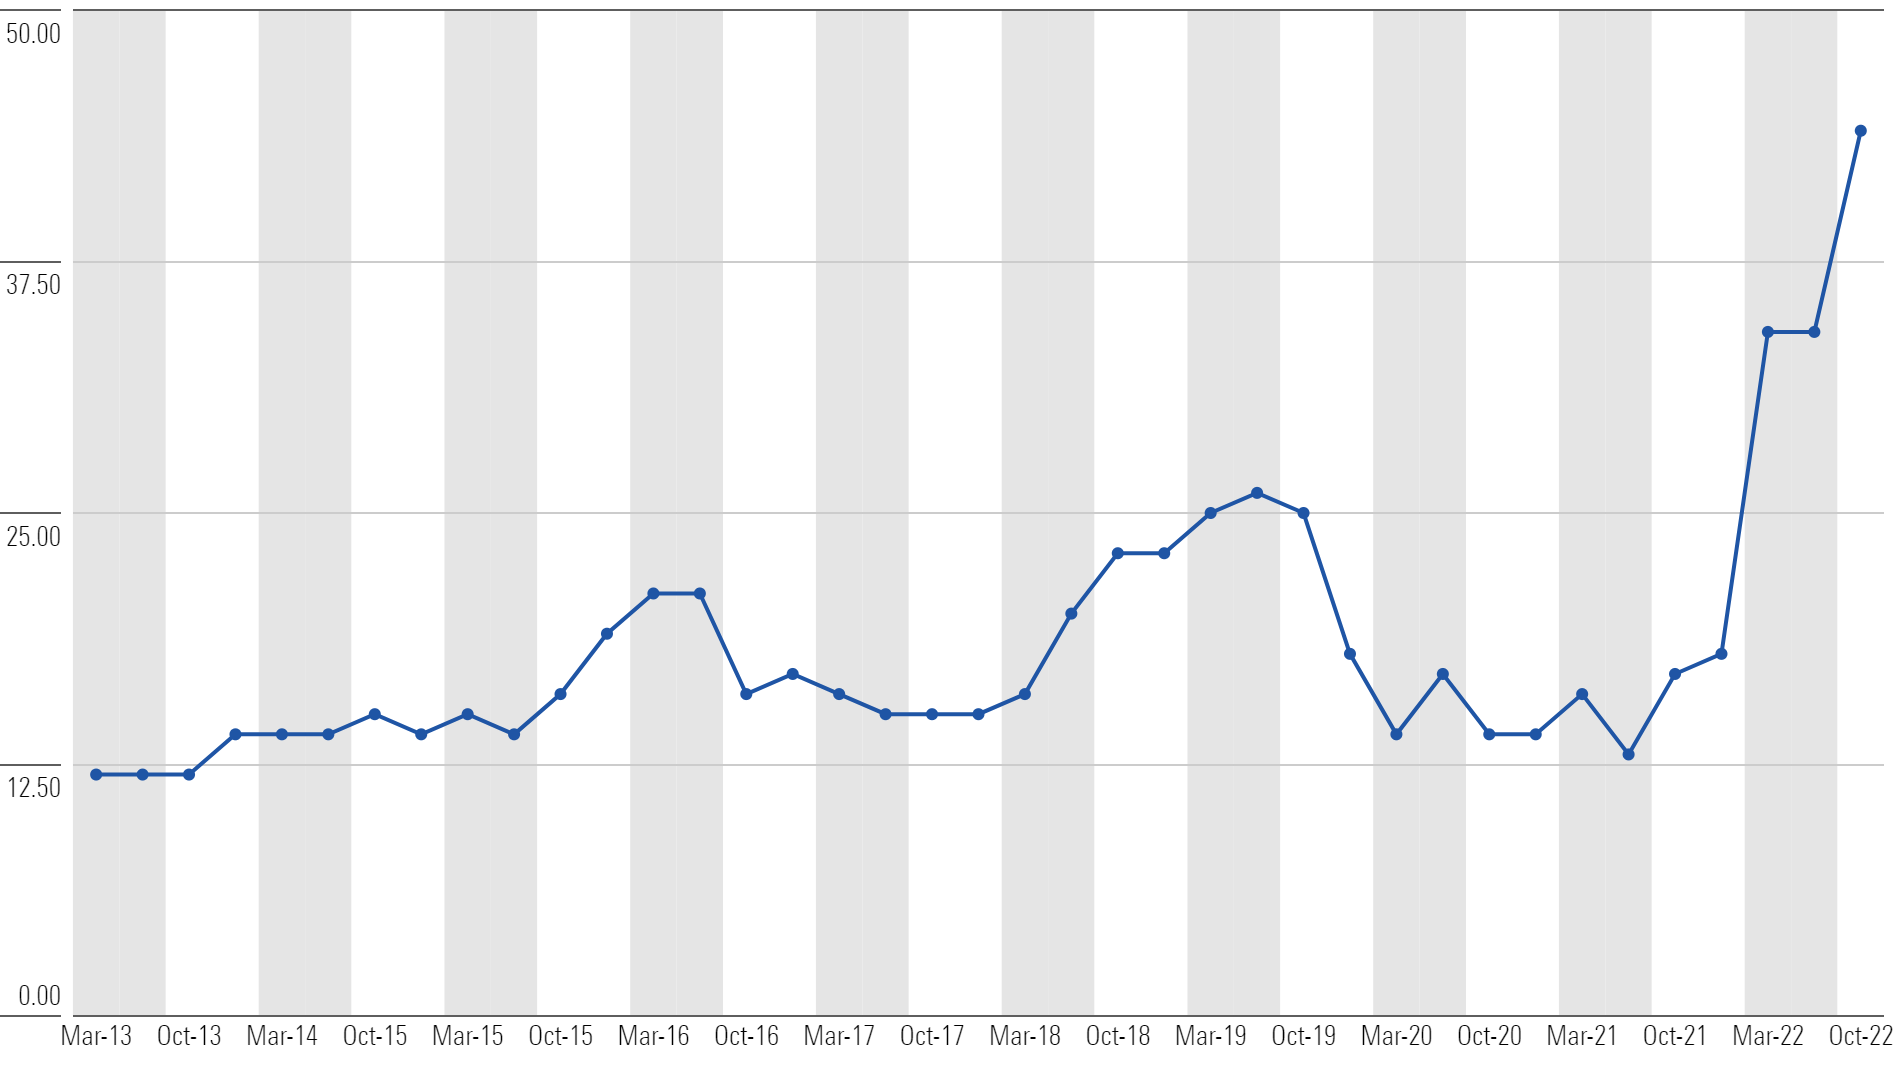
Using a Philadelphia Fed survey from January, nearly 44% of respondents predicted a recession would happen at some point in the next 12 months, the highest number in more than a decade.
Philly Fed Recession Probability Index (Next Four Quarters)
Obviously, the year’s not over, and it’s not time to celebrate—but to date, recession fears have not metastasized into the real thing.
And if we are in a recession, it’s a weird one.
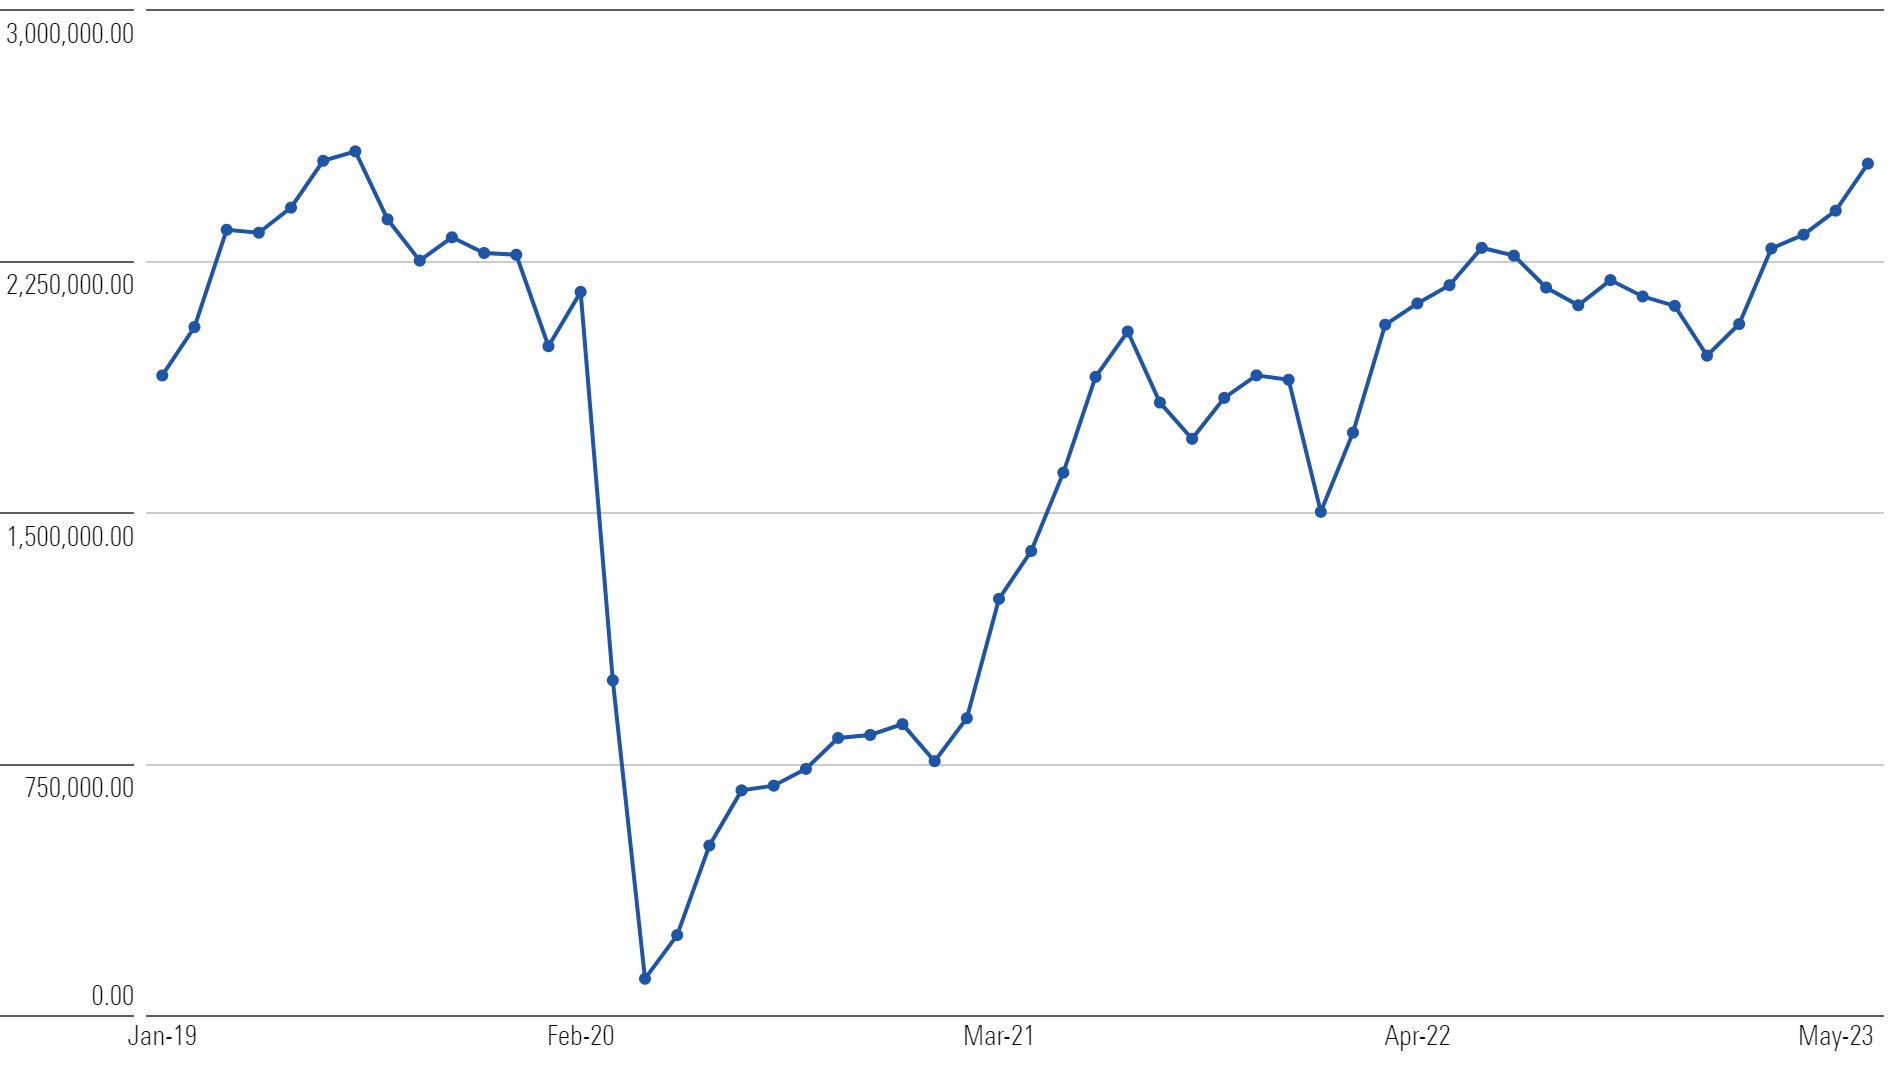
One example? Travel demand. More than 2.5 million people traveled through U.S. airports per day in June, the most since July 2019.
TSA Checkpoint Travelers (Monthly Average)
Airbus AIR—the second-largest aircraft manufacturer—recently provided a business update, mentioning:
“We cannot make planes fast enough to satisfy the demand. An airplane order these days is essentially just reserving a spot in the backlog.”
Boeing BA—the largest aircraft manufacturer—echoed the same sentiment, noting that many orders for planes in its backlog won’t be delivered until the 2030s. In the words of Boeing CEO Dave Calhoun:
“Why are people ordering airplanes out into the ‘30s now? Because they see the same thing,” referencing long-term demand trends for airline travel.
Strong long-term demand trends are not only unique to airlines; cruises are seeing a similar demand pattern. In a recent earnings call, Carnival Cruise Lines CCL mentioned booking volumes are at all-time highs and the “booking curve is as far out as we’ve ever seen it.”
While the next six months could look a lot different, there has not been a recession yet. And some people are losing confidence one will come—the Philadelphia Fed survey prediction has fallen to 30%.
July Fed Meeting
The June Fed meeting was significant. After 10 consecutive meetings with rate hikes, the Fed finally decided to pause, holding the federal-funds rate at a range of 5.00%–5.25%.
Many referred to the Fed’s decision as a “hawkish pause,” however, as the Fed alluded to more rate hikes in the future.
Looking toward the July Fed meeting, the market is currently expecting the Fed to hike rates 25 basis points again.
Target Rate Probabilities—July 26 Fed Meeting
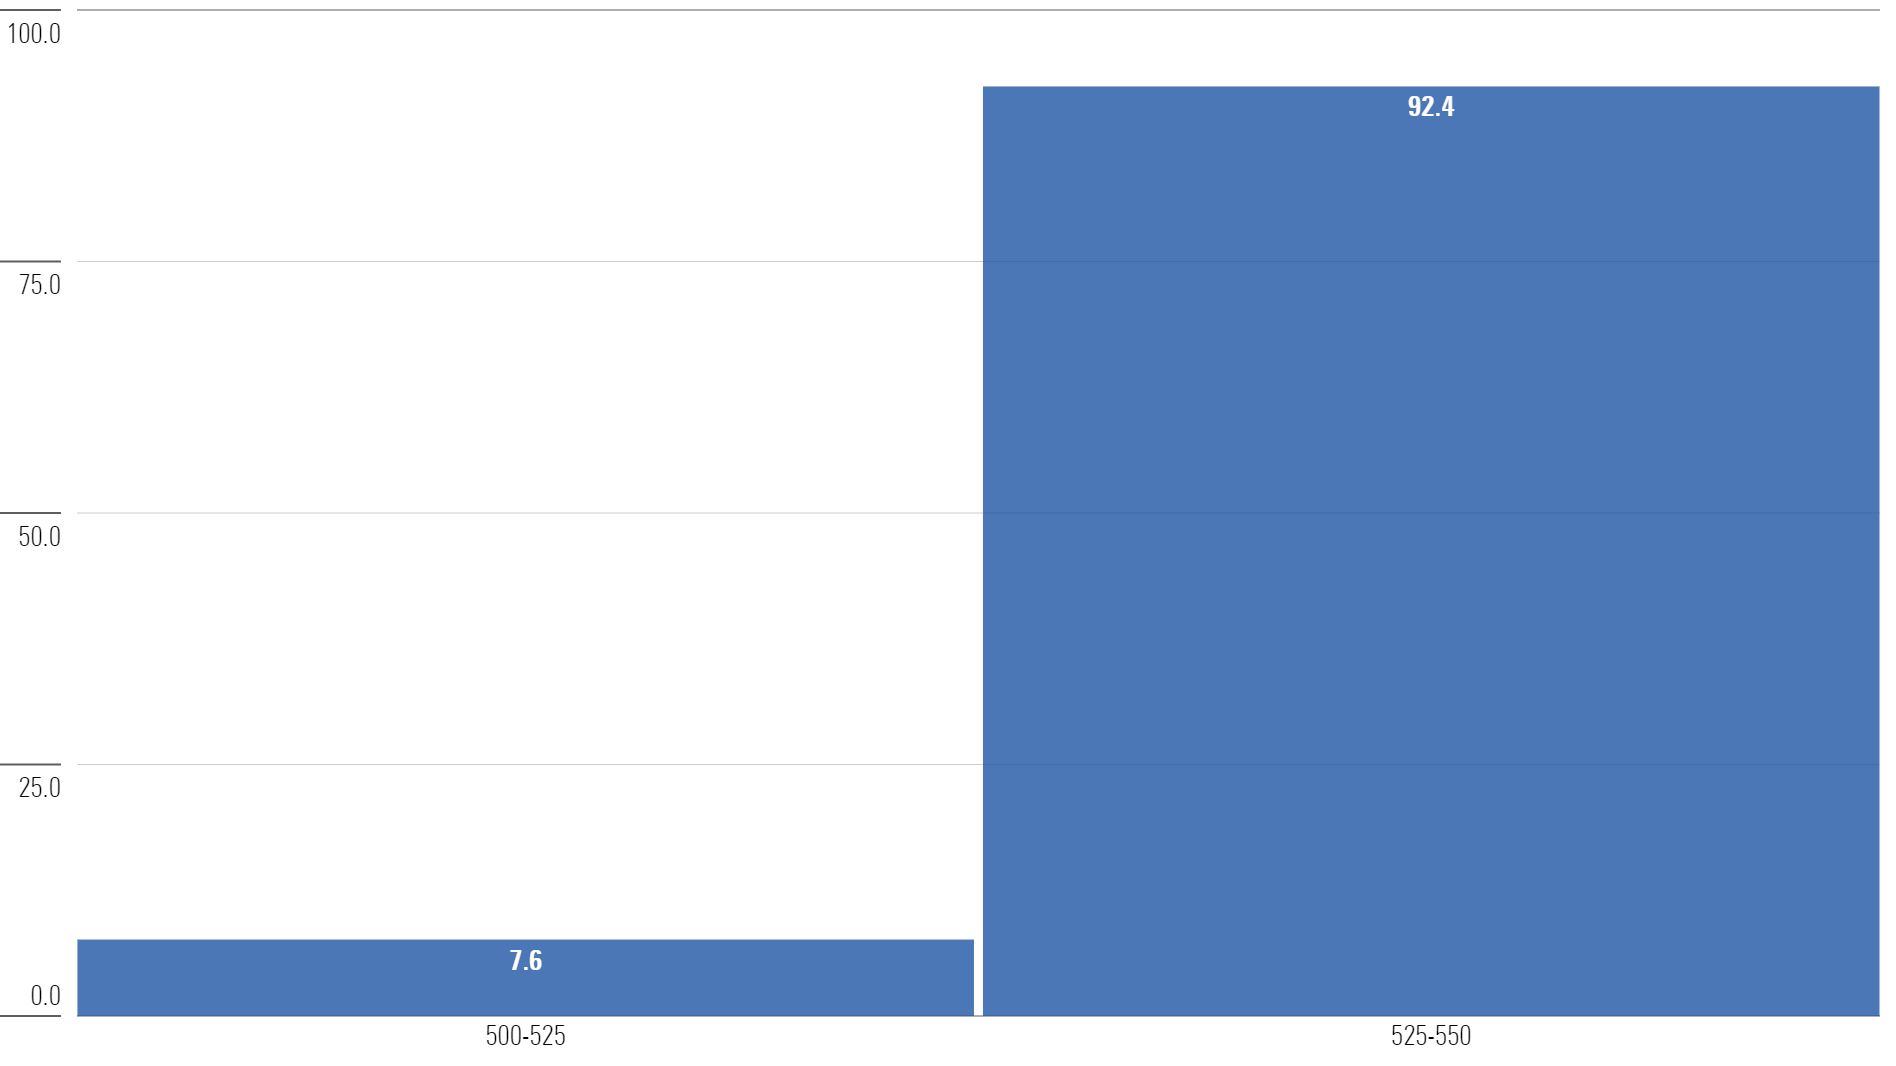
But after the July meeting, the market is not forecasting any more rate hikes. In fact, the futures market is expecting a rate cut by May of next year.
To be clear, none of this is promised—but it does provide some signal based on the current facts we have.
One of the main factors allowing the Fed to get less aggressive with rates is the consistent downward trend in inflation.
Inflation
The May inflation report was released a day before the Fed’s June meeting, and it showed a decline in the overall inflation rate to 4.1%. This was the 11th consecutive decline in the year-over-year rate and lowest level since March 2021.
Consumer Price Index (Year-Over-Year % Change)

Inflation was growing at a rate of roughly 9% last May; while still growing, the rate of growth has dropped considerably.
What’s driving the decline?
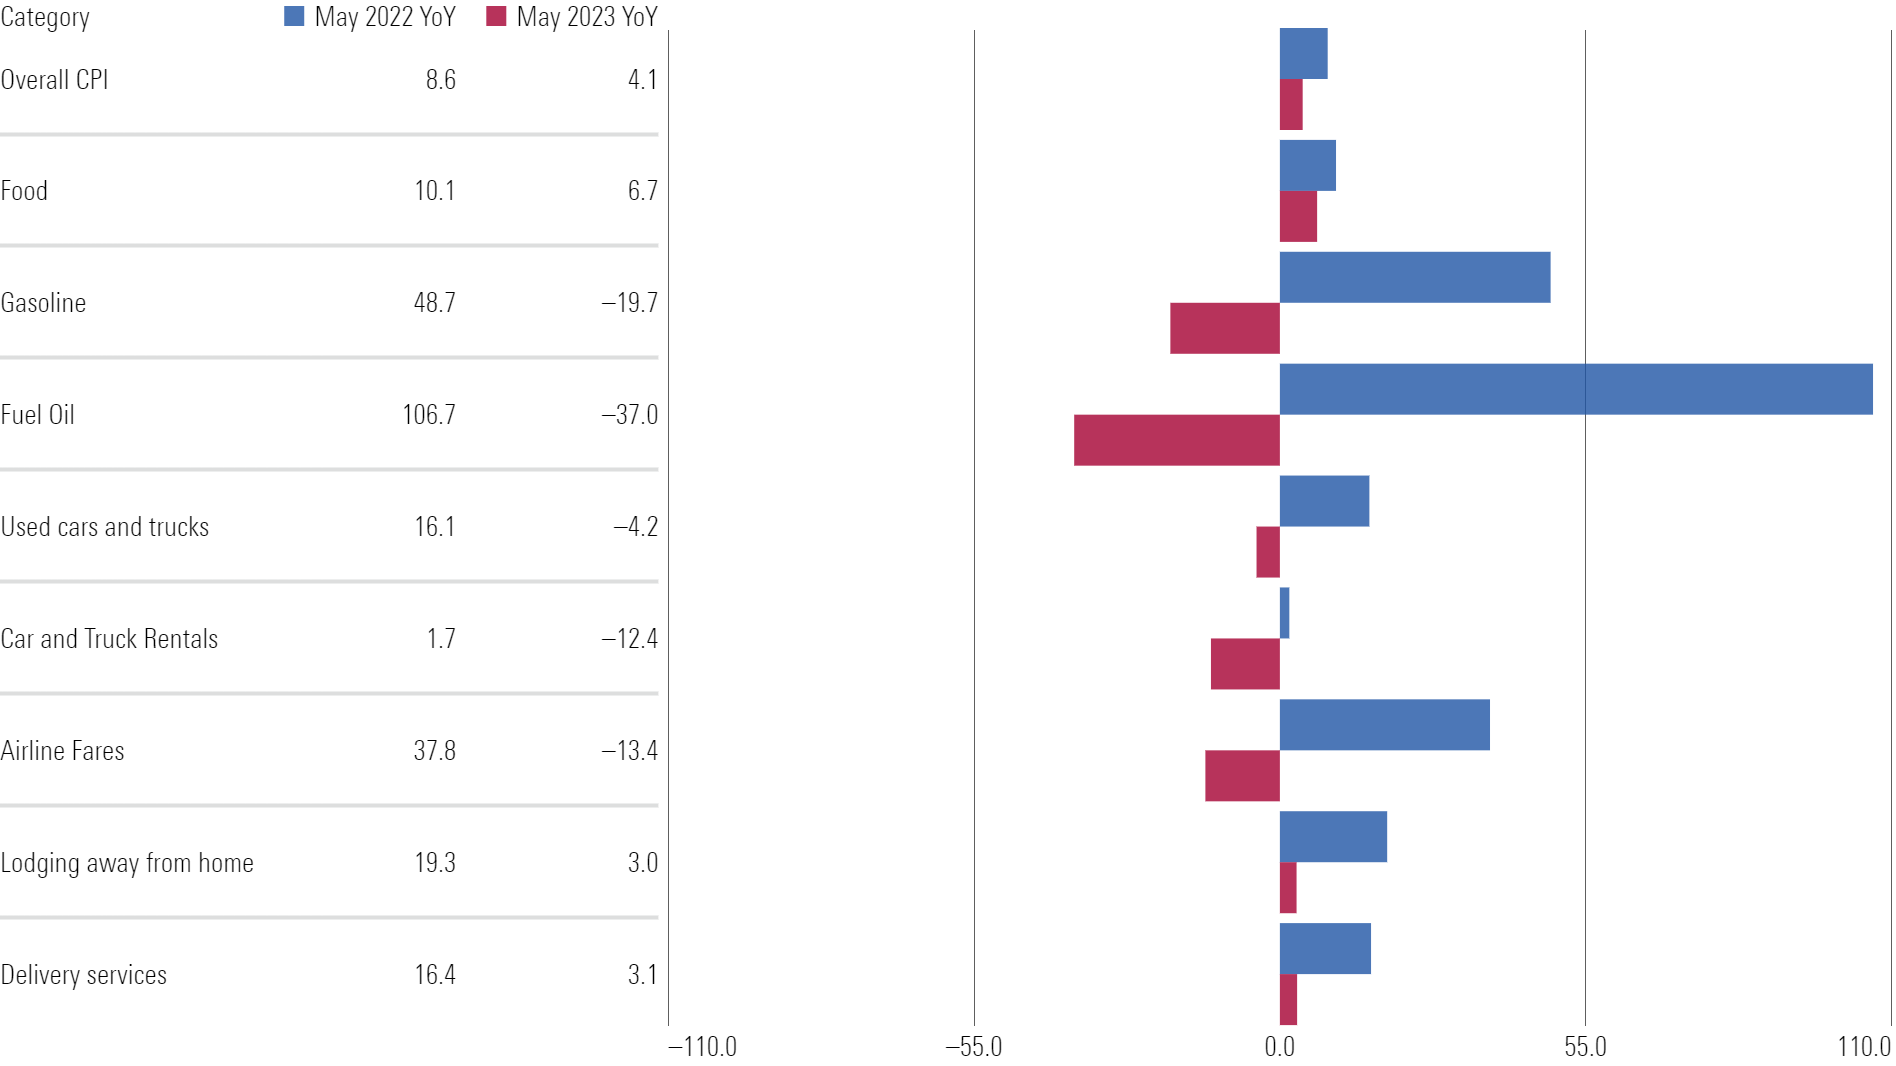
Energy components—gasoline and fuel oil—are completely rolling over. Used cars and trucks turned negative after large increases during the pandemic. And even areas of travel—airline fares and lodging—that reflected “revenge spending” are slowing down from extreme rates of growth.
Year-Over-Year % Change: May 2022 vs. May 2023 CPI Reports
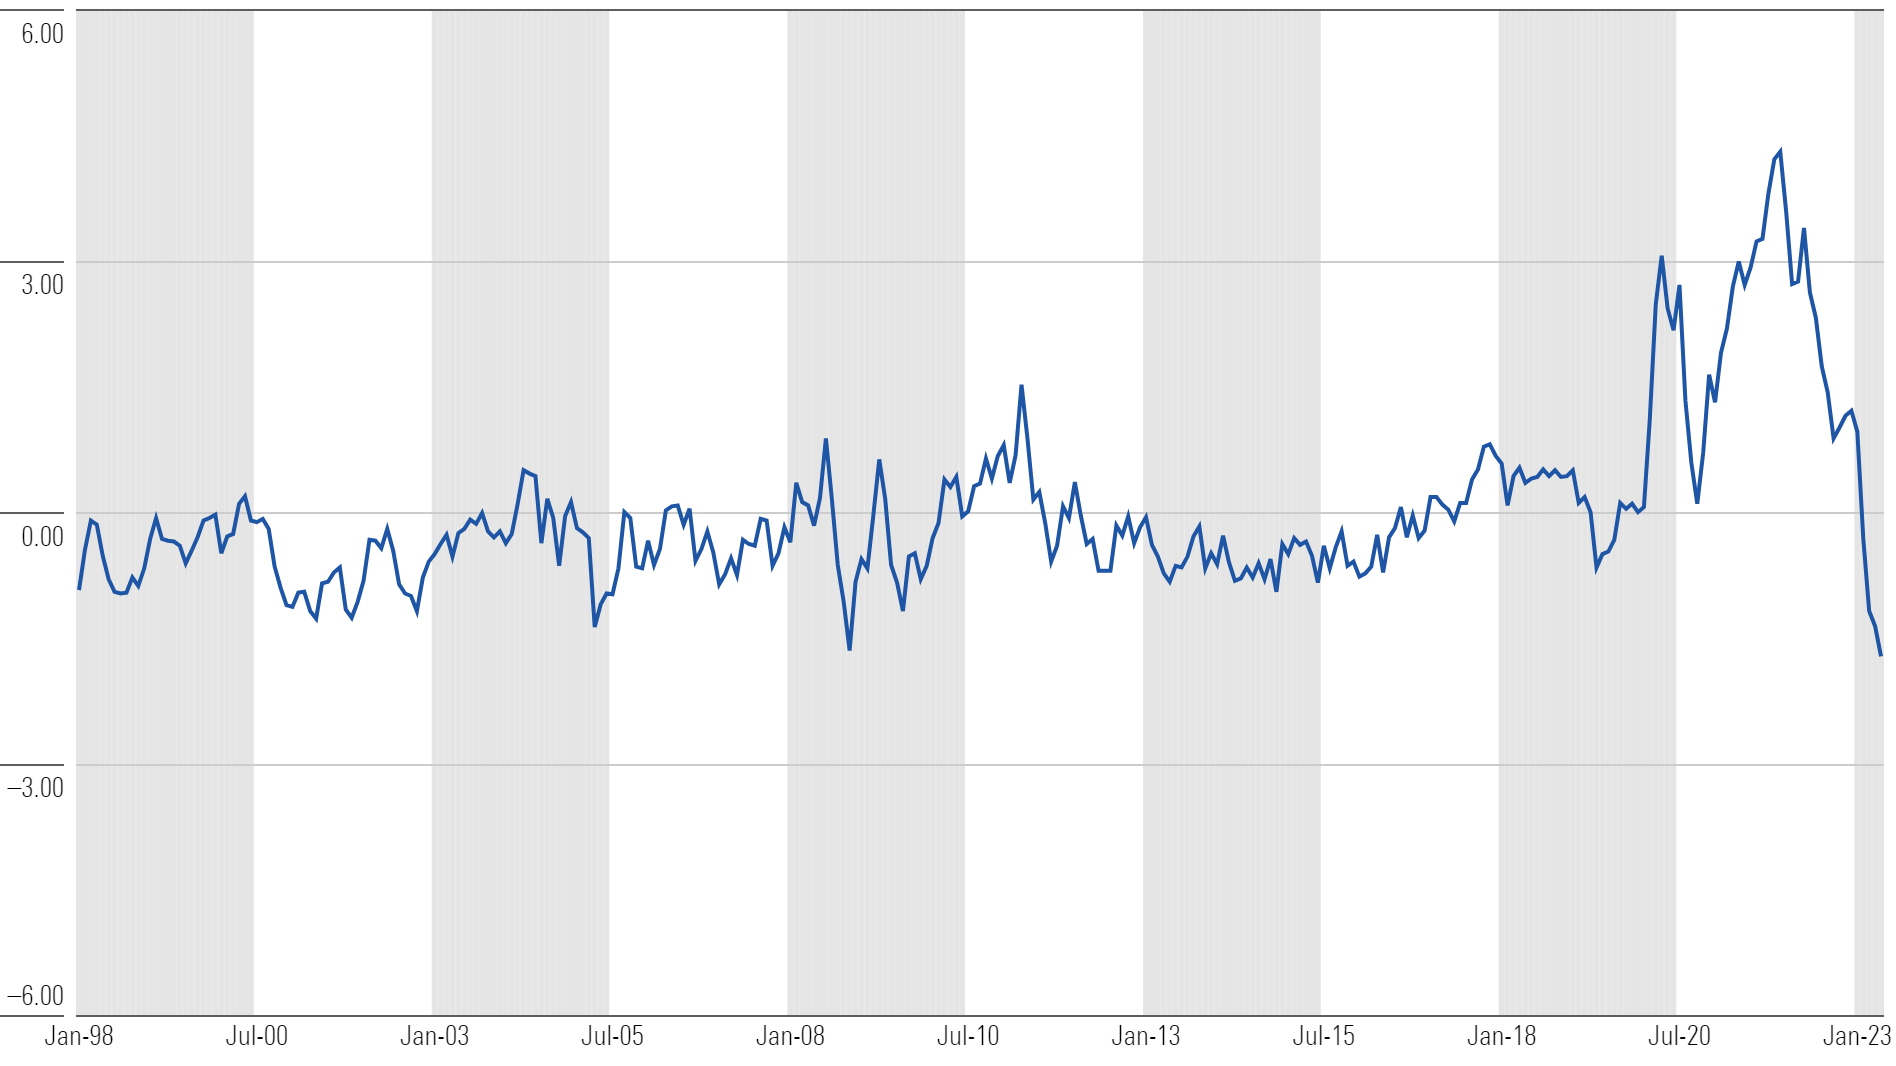
One extra consideration: extreme improvement in supply chains.
By one measure—the New York Fed Supply Chain Index—the pressure on the U.S. supply chain has moved from its worst level ever (December 2021) to its best level ever (May 2023) over the past 18 months.
Global Supply Chain Pressure Index (Standard Deviations From Average Value)
Housing
U.S. home prices fell 0.2% over the past year, the first year-over-year decline since 2012.
Case-Shiller U.S. National Home Price Index (Year-Over-Year % Change)
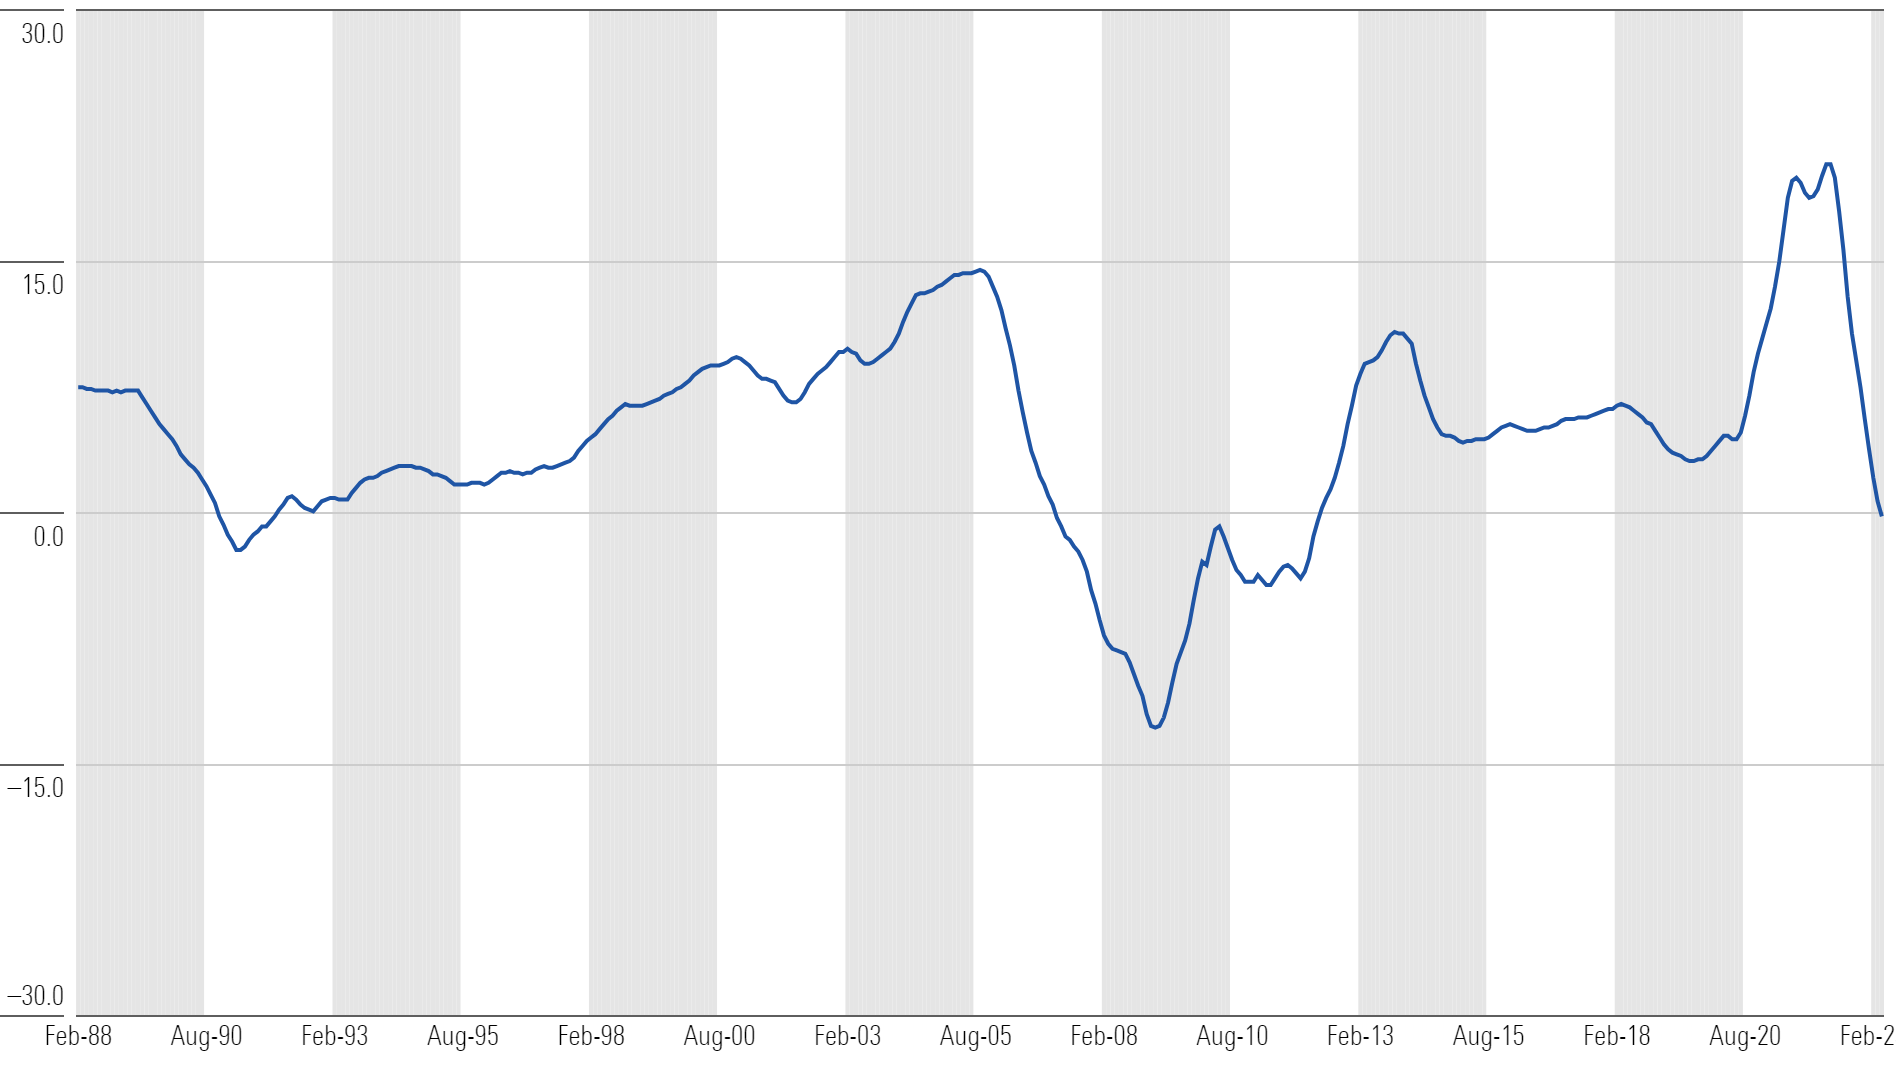
One might think the housing market is in trouble based on that data point. However, reality is something much different.
All the major U.S. homebuilders have stock prices trading near all-time highs.
U.S. Homebuilder Stock Price Returns
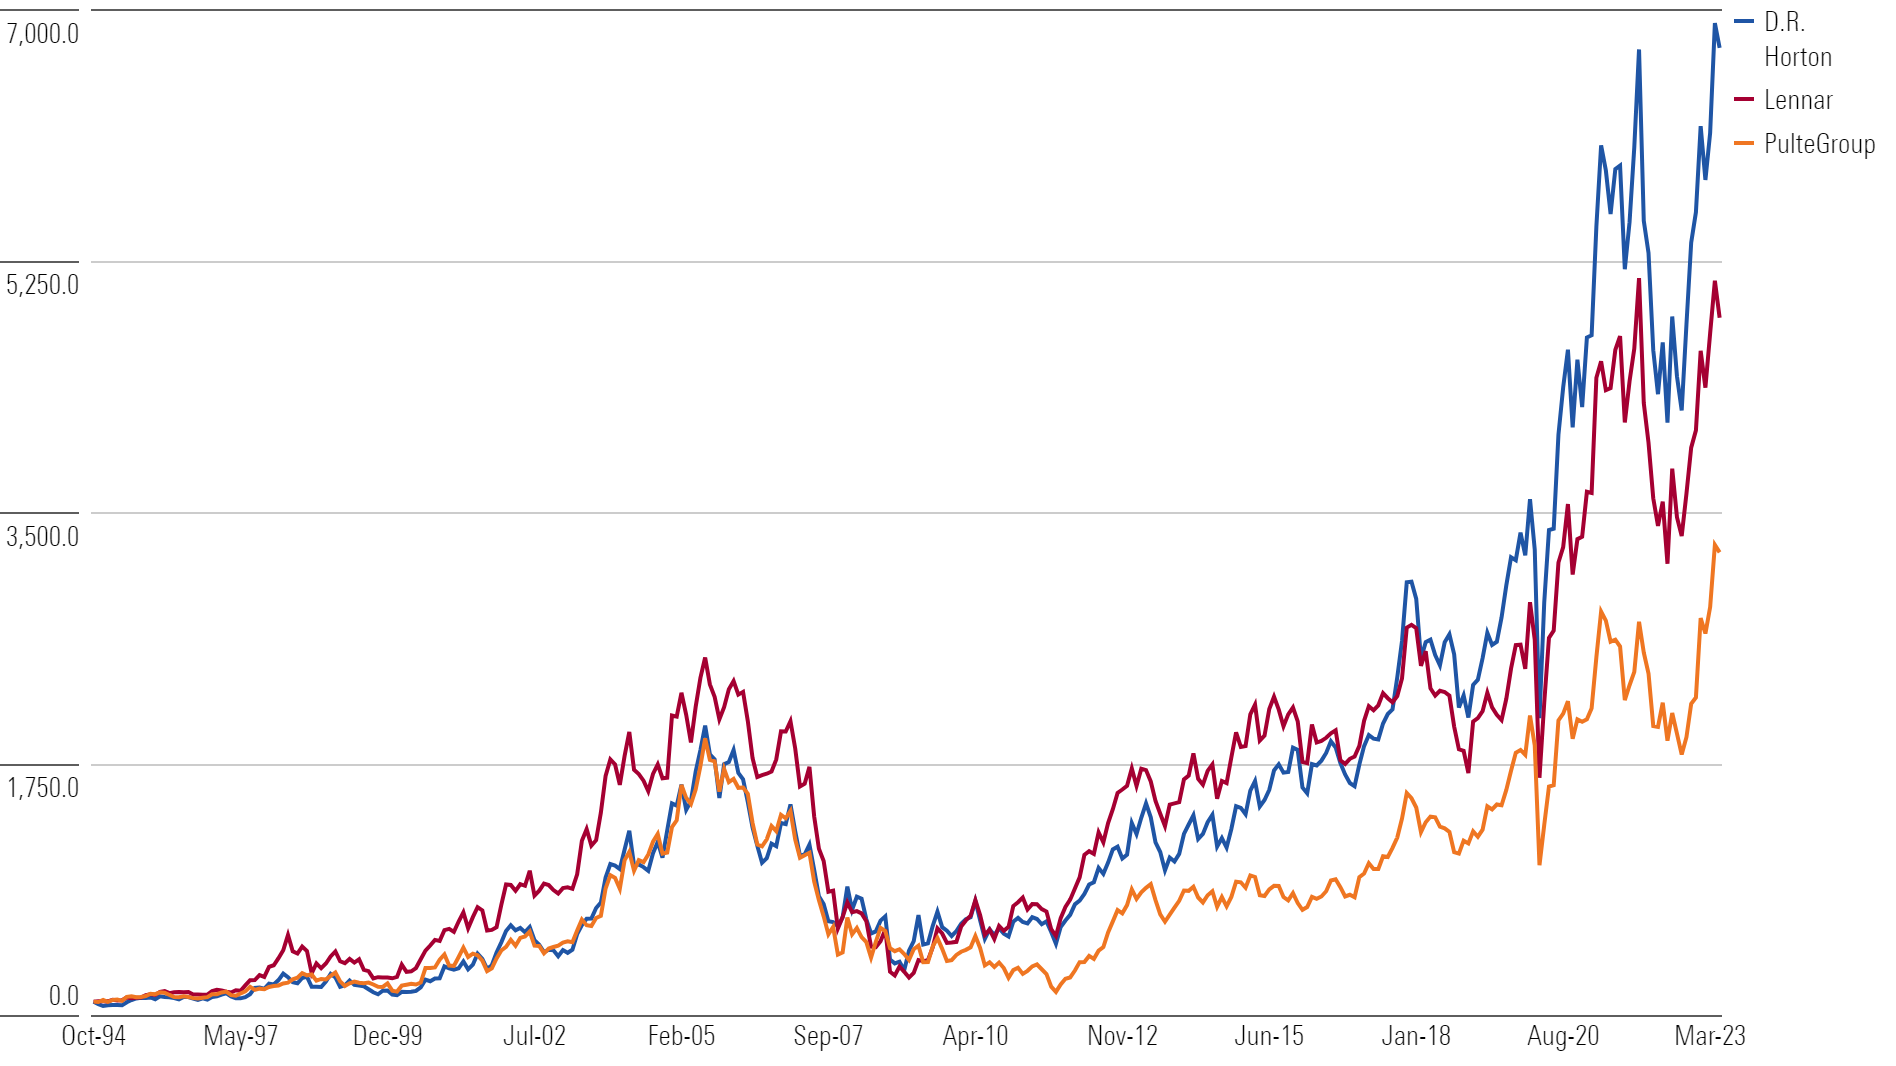
Considering a 30-year mortgage has gone from approximately 3% to 7% over the past two years, it’s hard to understand how homebuilders could be having success.
This is a feature of markets and investing: They often fool the masses.
Homebuilders have one simple factor driving them: limited inventory.
Lennar LEN—a large homebuilder—recently discussed this on an investor call:
“Consumers have come to accept a new normal for interest rates and demand has accelerated, leaving the market to reconcile the chronic supply shortage derived from over a decade of production deficits. Simply put, America needs more housing.”
In the four decades leading up to the global financial crisis, nearly 26 million new homes were built in each decade. In the most recent decade, only 5.8 million new homes were built.
U.S. Homes Built by Decade (Millions)
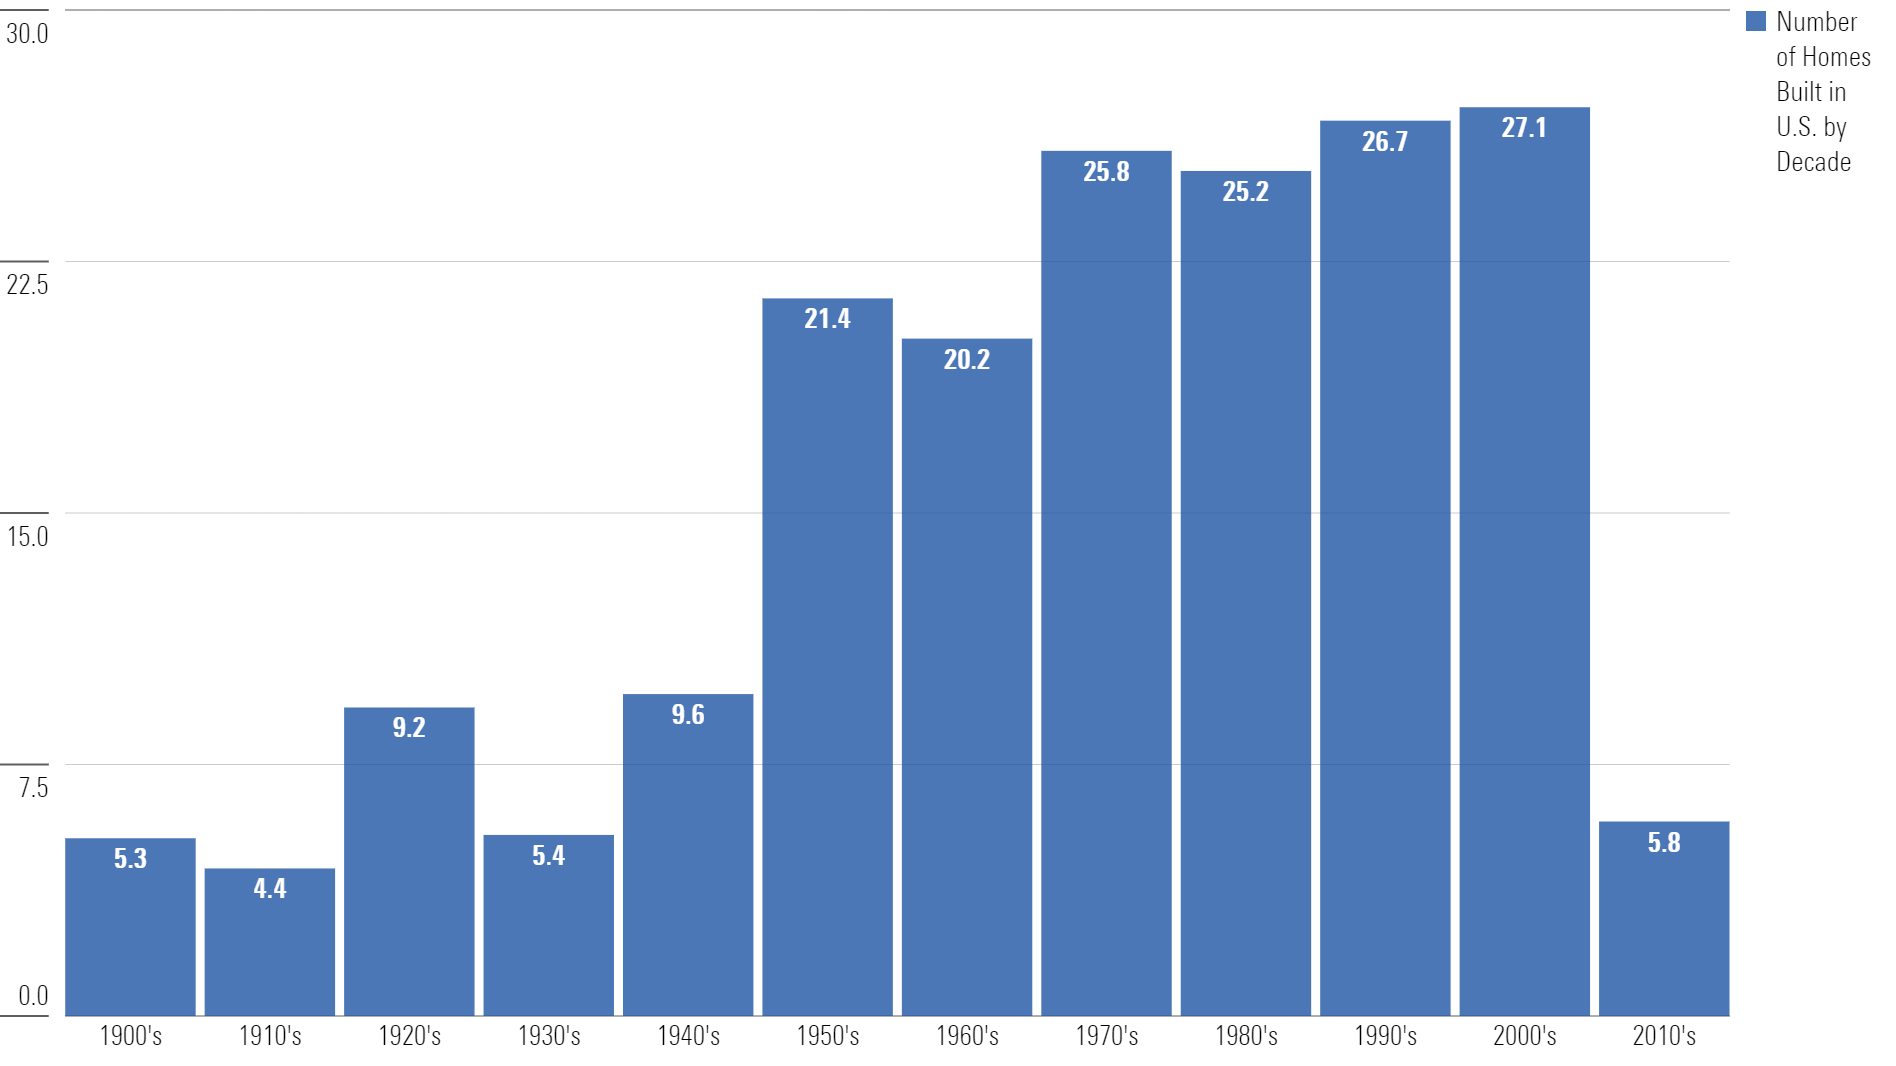
Needless to say, there’s a lot of catching up to do.
Morningstar Investment Management LLC is a Registered Investment Advisor and subsidiary of Morningstar, Inc. The Morningstar name and logo are registered marks of Morningstar, Inc. Opinions expressed are as of the date indicated; such opinions are subject to change without notice. Morningstar Investment Management and its affiliates shall not be responsible for any trading decisions, damages, or other losses resulting from, or related to, the information, data, analyses or opinions or their use. This commentary is for informational purposes only. The information data, analyses, and opinions presented herein do not constitute investment advice, are provided solely for informational purposes and therefore are not an offer to buy or sell a security. Before making any investment decision, please consider consulting a financial or tax professional regarding your unique situation.
Morningstar Investment Management LLC is a Registered Investment Advisor and subsidiary of Morningstar, Inc. The Morningstar name and logo are registered marks of Morningstar, Inc. Opinions expressed are as of the date indicated; such opinions are subject to change without notice. Morningstar Investment Management and its affiliates shall not be responsible for any trading decisions, damages, or other losses resulting from, or related to, the information, data, analyses or opinions or their use. This commentary is for informational purposes only. The information data, analyses, and opinions presented herein do not constitute investment advice, are provided solely for informational purposes and therefore are not an offer to buy or sell a security. Before making any investment decision, please consider consulting a financial or tax professional regarding your unique situation.
The author or authors do not own shares in any securities mentioned in this article. Find out about Morningstar’s editorial policies.
/cloudfront-us-east-1.images.arcpublishing.com/morningstar/L4B22R7UFVDBJN2ZYJWBSMCIJA.jpg)
/cloudfront-us-east-1.images.arcpublishing.com/morningstar/BL6WGG72URAJJJCPC4376SZKX4.png)
/cloudfront-us-east-1.images.arcpublishing.com/morningstar/ZHBXSNJYDNAY7HDFQK47HGBDXY.png)