
5 Charts on the Current Market
What to know about global uncertainties, market corrections, and the opportunity cost of sitting in cash.

The Most Dangerous Time
“I’m more worried about the world broadly than I’ve ever been in my whole career … I’d be worried we’ll have another 10 years of zero returns.”—Seth Klarman
Seth Klarman may not be a household name or hold the notoriety of other famous investors, but his track record stands tall versus anyone. When he speaks, investors usually listen.
Obviously, that statement is scary—and at face value—investing with caution would seem warranted.
There’s only one problem: That quote is from May 2010. From May 2010 through the end of the decade, the S&P 500 tripled in value.
At present, there is no shortage of items to worry about.
Jamie Dimon kicked off JPMorgan’s recent quarterly earnings call by mentioning, “Now may be the most dangerous time the world has seen in decades.”
Dimon is primarily alluding to the fact that we now have wars raging on multiple continents. And while the world finds itself in a sad state of affairs—that doesn’t foreshadow a doomsday market scenario.
The simple truth is that markets often react negatively to major events over the short term, but then move past them pretty quickly.
Sampling 20 major global events over the past 80 years, the data shows that markets often react negatively—down 3% on average over one month—but then turn positive shortly after, with the median return one year after a major event being positive, up more than 6%.
Stock Performance During Major Global Events (U.S. Large Caps)
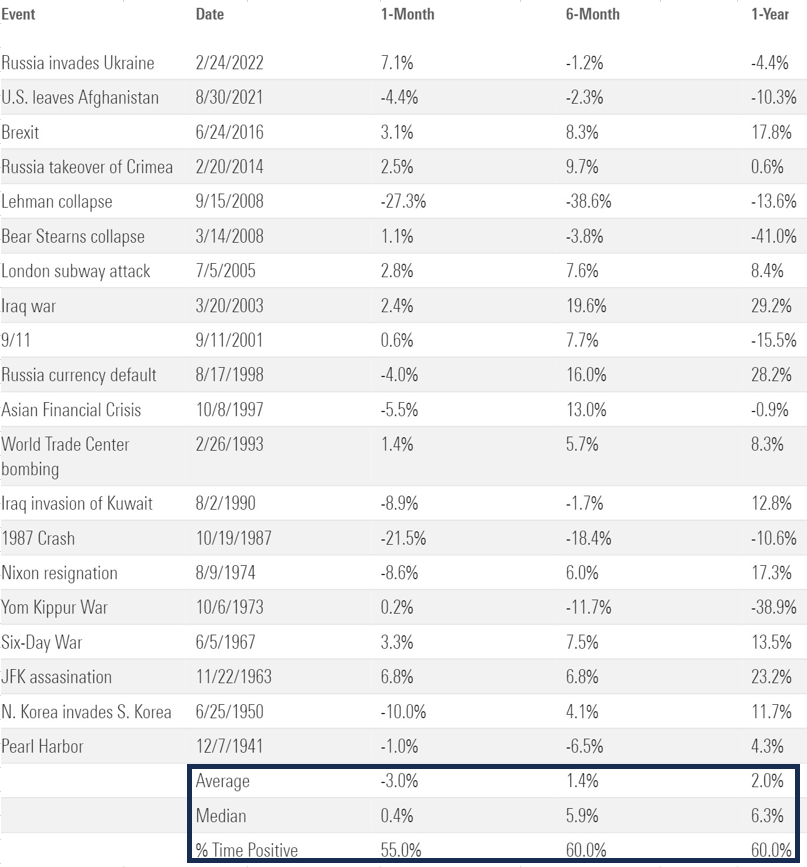
The takeaway? We should not let major global events elicit a reaction to stop investing or get out of the market.
With that being said, the market is currently in its largest drawdown of the year, though the slide began in July, well before recent events.
Correction Territory
The market officially dipped into correction territory—down 10% from a recent high—for the first time this year in late October.
It’s easy to play Monday morning quarterback—of course the market was going to correct!—after it happens.
You can point to a litany of reasons: war, rising rates, the Fed, political uncertainty. This list could probably be extended to fill every slot on a roulette wheel if you were so inclined.
But the easiest thing that can be said in times like these is: This is normal.
In fact, since 1990, U.S. large-cap stocks have been down 10% or more from an all-time high approximately 32% of the time.
U.S. Large Caps Percent Off High (Since 1990)
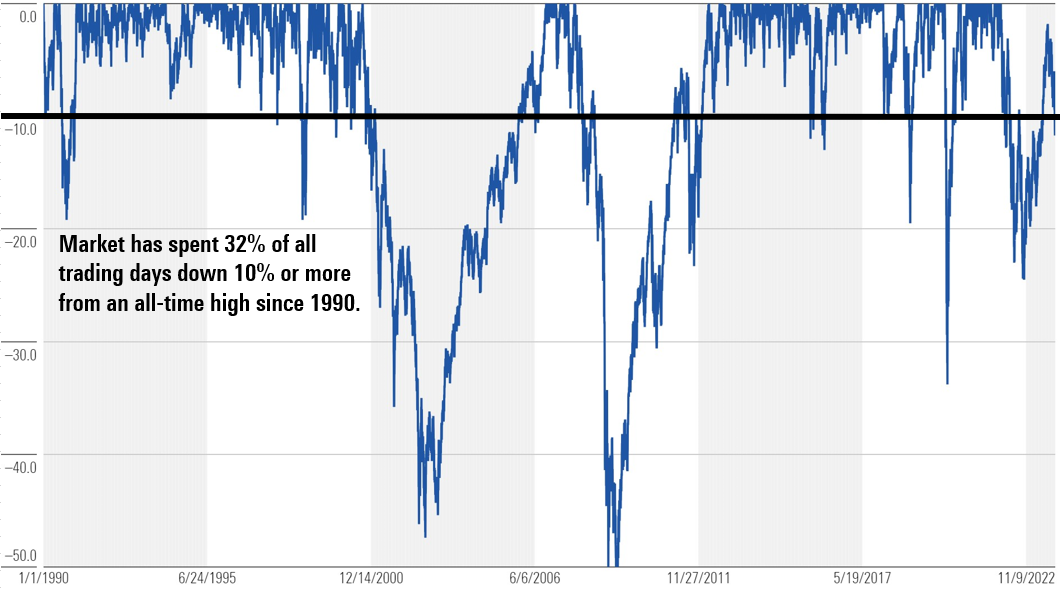
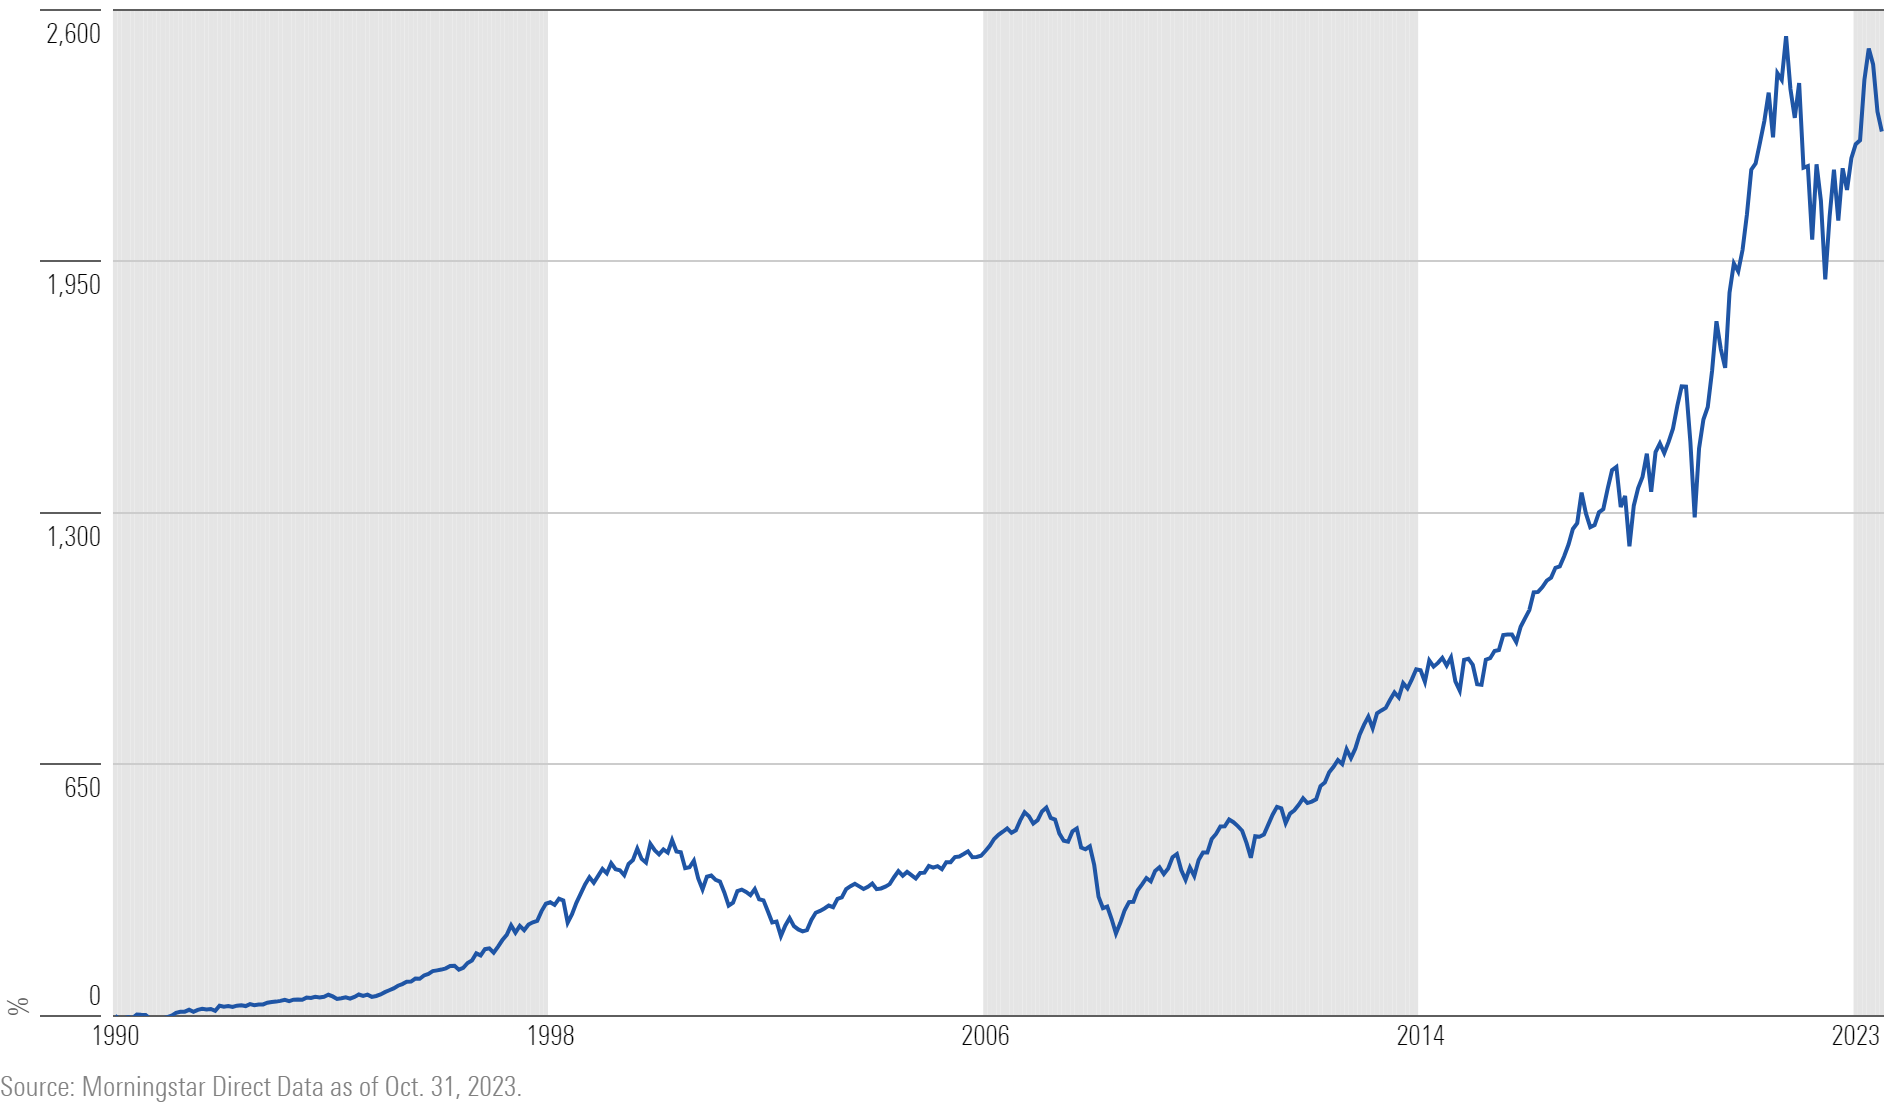
And yet, stocks gained more than 2,200% during this period.
U.S. Large Caps Total Return Since 1990 (%)
If there was no pain, there would never be any gain.
History shows investors are generally at their worst when they allow the roulette wheel of worries to influence wholesale investment changes.
And we should keep in mind that rebounds often occur suddenly and unexpectedly. Trying to time these reversals—or moving to cash to wait for the market to settle down—often backfires since it means missing out on the earliest (and sometimes most rapid) part of a recovery.
Investors Love Cash
One asset class that has seen massive inflows this year? Cash.
One benefit of rate hikes has been that investors can earn a real return on their cash—something that has not been true for a long time. Many money market funds now yield more than 5%, reflecting the path of the Fed’s rate hikes.
Nearly $940 billion has flowed into money market funds this year through September.
Money Market Net Flows (Billions)
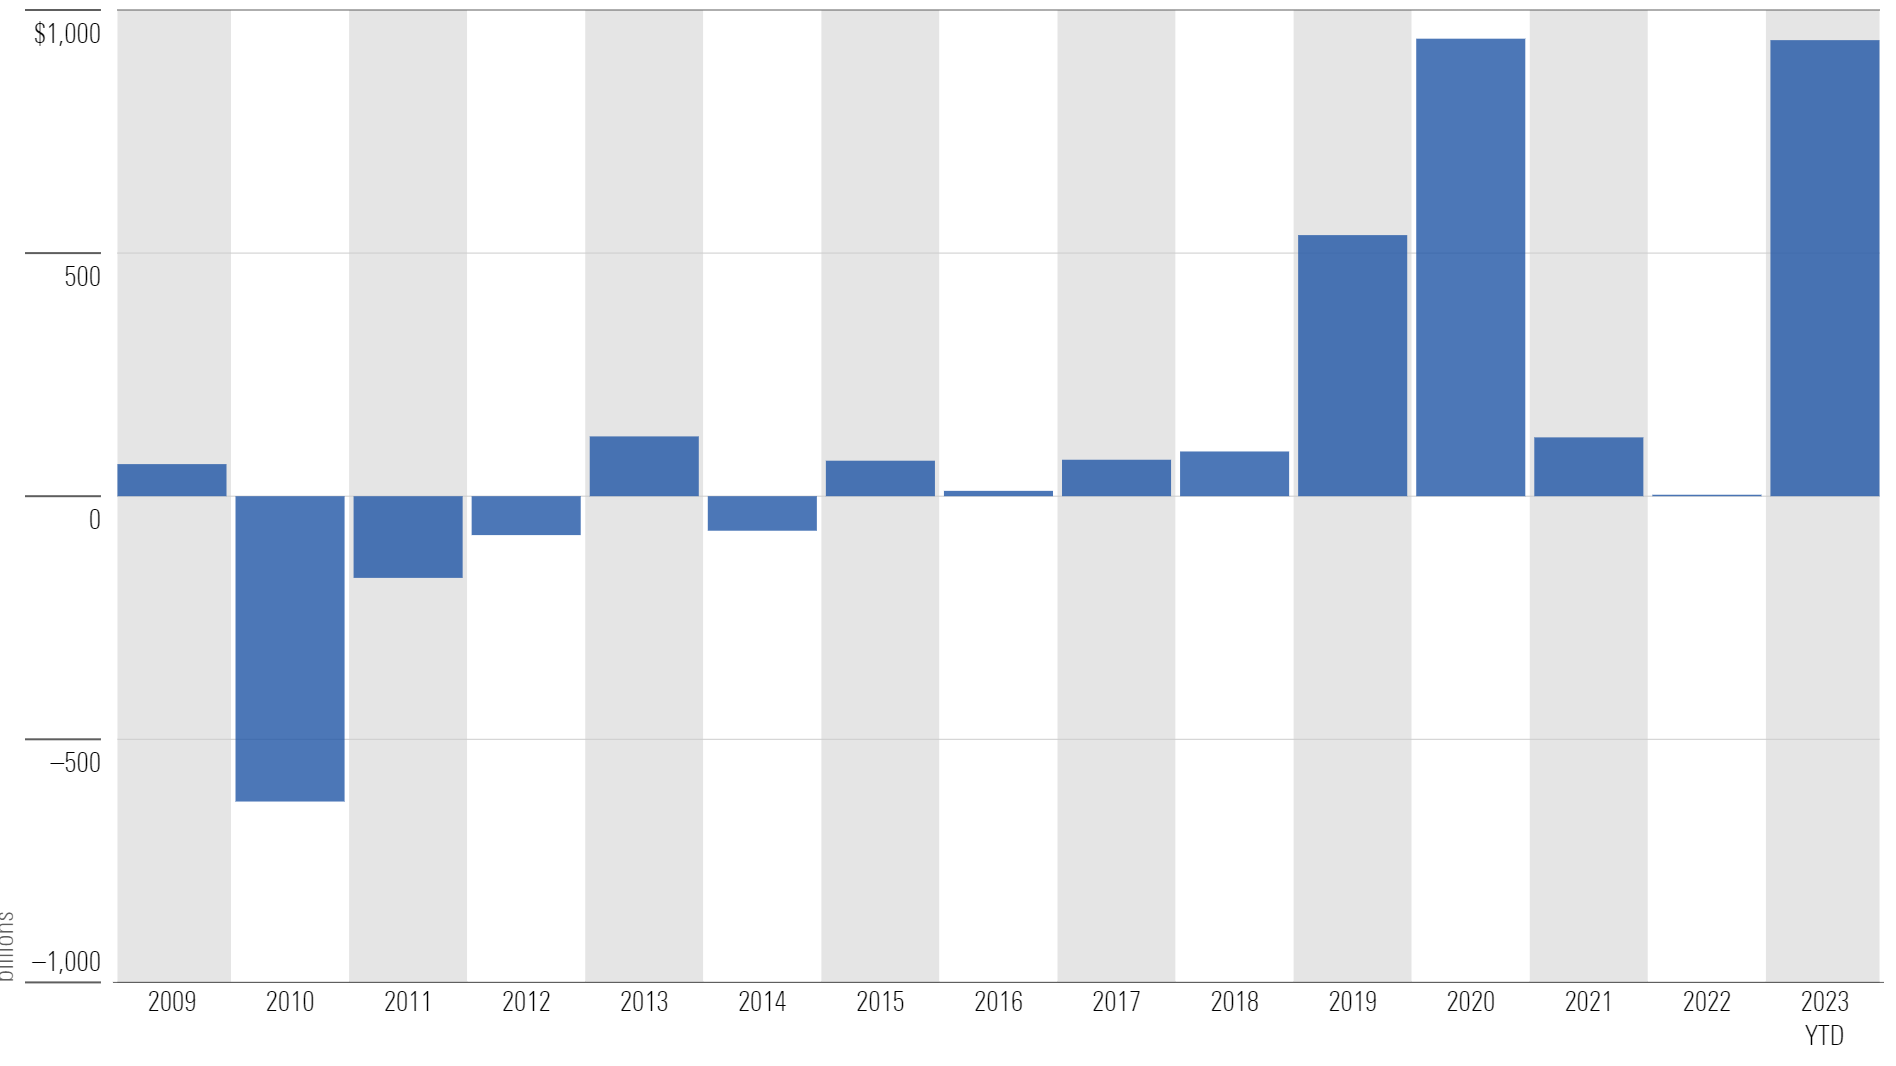
Flows will likely surpass $1 trillion by year-end—eclipsing the high-water mark for any year since 2009—and likely the highest ever.
Aswath Damodaran—NYU finance professor widely regarded for his market views—pointed out the shift in investor mindset related to cash on a recent episode of Invest Like the Best, mentioning:
“There’s been a very specific change. If you asked me three years ago how much cash I had in my brokerage account, I didn’t know, and I didn’t care. After all, what was I going to do with it? If I put it in T-bills, I made nothing. Today, I’m acutely aware of cash when it’s sitting around. Idle cash means losing cash because of 3%-4% inflation—it’s losing value.”
In theory, investors are being paid to wait. They can earn 5% in cash, and judging by how they’re voting with their dollars—they love it.
The money market fund industry has nearly $6 trillion in assets now. It’s hard to differentiate how much of the flows into money markets are coming from checking accounts—where it was earning nothing—and how much was previously invested in stocks but left, searching for yield with less volatility.
It’s probably fair to say it’s some combination of both. But one truth about investing: The comfortable asset is rarely the most rewarding asset.
Clearly, it feels comfortable to earn 5% in cash while carrying a fraction of the equity risk. But there are other items to consider.
The long-term track record of cash versus stocks shows a decisive winner: stocks.
Since 1928, cash has beaten stocks 31% of the time over a one-year period. But as time goes on, the chance of cash beating stocks narrows significantly. In fact, there has never been a 25-year period where cash has outperformed the stock market.
This data isn’t particularly profound. The stock market has historically gone up more often than it has gone down, which is the reason stocks generally outperform cash.
A bigger question is: What is it costing investors by sitting in cash?
In the short term, the opportunity cost is very little. On average, cash only underperforms the stock market by 8% over one-year periods. But the differential increases exponentially over time. Over a five-year period, the difference between stocks and cash is more than 50%. Over 20 years, it’s more than 700%.
Average Underperformance: Cash vs. Stocks (1928-2022)
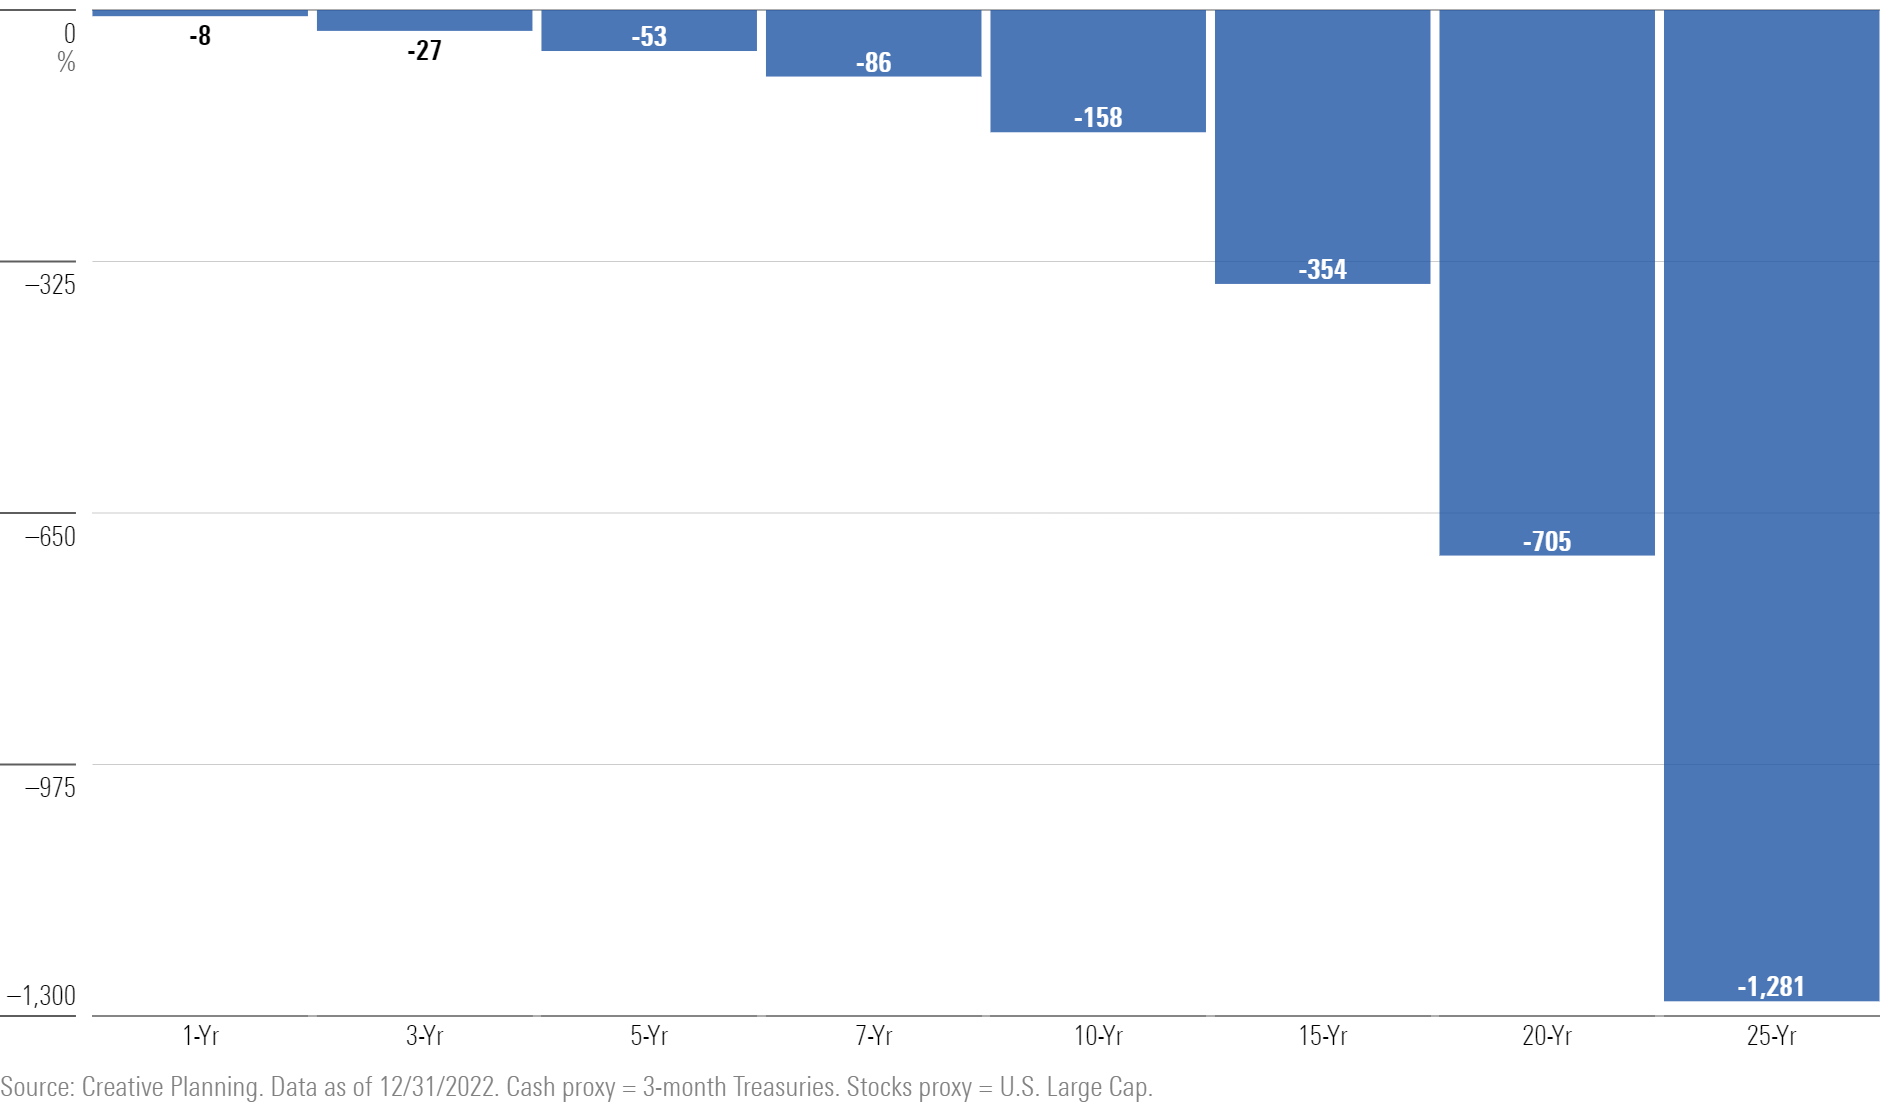
The lesson is clear: Significant historical evidence shows the opportunity cost of sitting in cash is huge and grows over time.
This article is a condensed version of a monthly article from Morningstar Wealth. If interested, a full version of the article can be viewed here.
Morningstar Investment Management LLC is a Registered Investment Advisor and subsidiary of Morningstar, Inc. The Morningstar name and logo are registered marks of Morningstar, Inc. Opinions expressed are as of the date indicated; such opinions are subject to change without notice. Morningstar Investment Management and its affiliates shall not be responsible for any trading decisions, damages, or other losses resulting from, or related to, the information, data, analyses or opinions or their use. This commentary is for informational purposes only. The information data, analyses, and opinions presented herein do not constitute investment advice, are provided solely for informational purposes and therefore are not an offer to buy or sell a security. Before making any investment decision, please consider consulting a financial or tax professional regarding your unique situation.
/cloudfront-us-east-1.images.arcpublishing.com/morningstar/6NPXWNF2RNA7ZGPY5VF7JT4YC4.png)
/cloudfront-us-east-1.images.arcpublishing.com/morningstar/RYIQ2SKRKNCENPDOV5MK5TH5NY.jpg)
/cloudfront-us-east-1.images.arcpublishing.com/morningstar/6ZMXY4RCRNEADPDWYQVTTWALWM.jpg)