
Which Bonds Provide the Biggest Diversification Benefit?
The bond rout in 2022 upended notions about correlations, but high-quality bonds and cash have been solid diversifiers over longer stretches.
/s3.amazonaws.com/arc-authors/morningstar/66112c3a-1edc-4f2a-ad8e-317f22d64dd3.jpg)

As interest rates shot up in early 2022 and continued to increase through most of 2023, bonds’ long-standing pattern of diversifying stock exposure was turned on its head. While most bond types fell less than stocks in 2022, their returns were directionally similar: down. That has heightened bonds’ correlation with stocks, according to Morningstar’s recently released Diversification Landscape report from Amy Arnott, Karen Zaya, and me.
But over the long arc of market history, high-quality bonds have shown an ability to diversify stock exposure. Not only are many equity market shocks characterized by a flight to safety in which Treasury bonds thrive, but in weakening economic conditions, interest rates are often simultaneously declining, boosting bond prices. Lower-quality bonds, meanwhile, have shown much more of a connection to stock-price movements and therefore should be considered third-tier diversifiers for investors’ equity portfolios.
Meanwhile, the virtue of cash as a diversifier has spiked amid recent market action. Even as rising interest rates crimped stock and bond prices in 2022, they’ve been nothing but a boon for cash investors, who don’t experience share-price volatility but get to enjoy higher yields.
Here’s a closer look at the correlations of taxable and municipal bonds relative to a US equity portfolio, both over the past three years as well as longer time frames, and at the implications for investors aiming to build diversified portfolios.
Recent Performance Trends: Taxable Bonds
Owing to rising interest rates, taxable bonds’ correlations relative to US stocks have risen sharply over the past three years. The graph below depicts the correlation of various slices of the taxable-bond market relative to US stocks.
Three-Year Correlation Matrix: Taxable Bonds
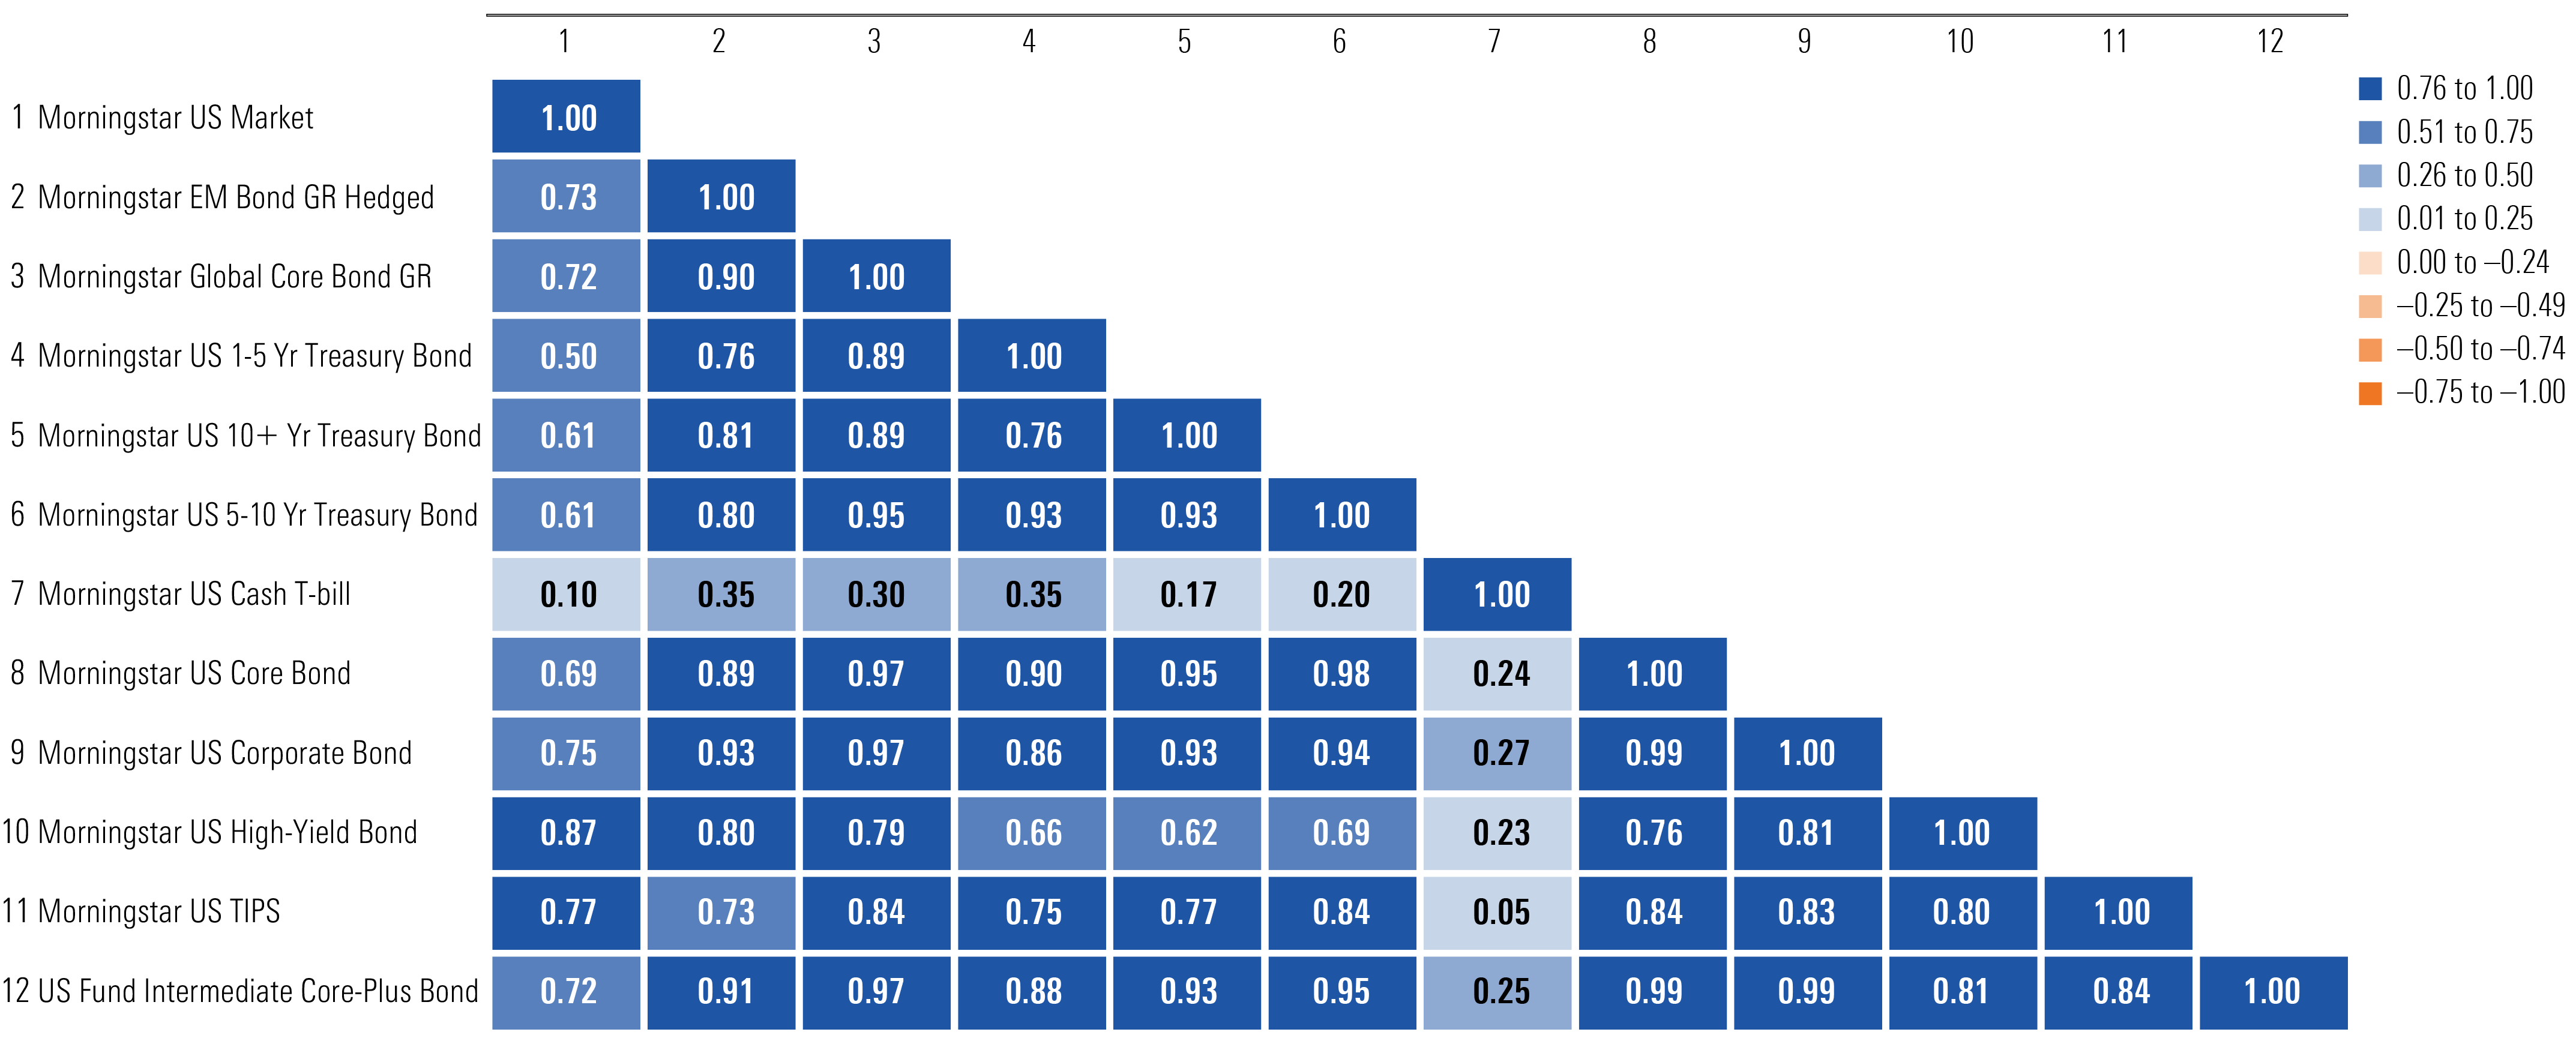
The recently higher correlations owe mainly to rising interest rates in 2022 and 2023. The market exuberance of the recovery from the height of the pandemic, coupled with low interest rates, sparked a sudden uptick in inflation (which had remained stubbornly low following the market interventions in the wake of the global financial crisis). The Federal Reserve took action with 11 interest-rate increases over 2022 and 2023. The benchmark Federal Open Market Committee rate began 2022 at a historic low—a range of 0.25% to 0.50%—but stood at 5.25% to 5.50% by the end of 2023. Bonds were at a disadvantage—particularly the high-quality US Treasury bonds that typically serve as ballast in aggressive equity market downturns. Prices for US Treasuries, which are highly liquid and carry minimal credit risk, fell sharply throughout 2022. Stocks fell at the same time, reflecting concerns that rate hikes would slow the economy.
While both stock and bond prices stabilized in 2023, three-year correlations between stocks and high-quality bonds remain elevated relative to long-term history. Treasury bonds, historically among the best diversifiers for US equities, are now positively correlated with US stocks. Lower-quality bond types like high-yield and emerging markets have never been great diversifiers for stocks, and their correlations remain the highest of all taxable-bond groups. Cash had the lowest correlation with stocks over the past three-year period, in part because it was a rare asset type to exhibit positive returns in 2022. Cash investors’ yields rose at the very time that stock and bond prices were falling.
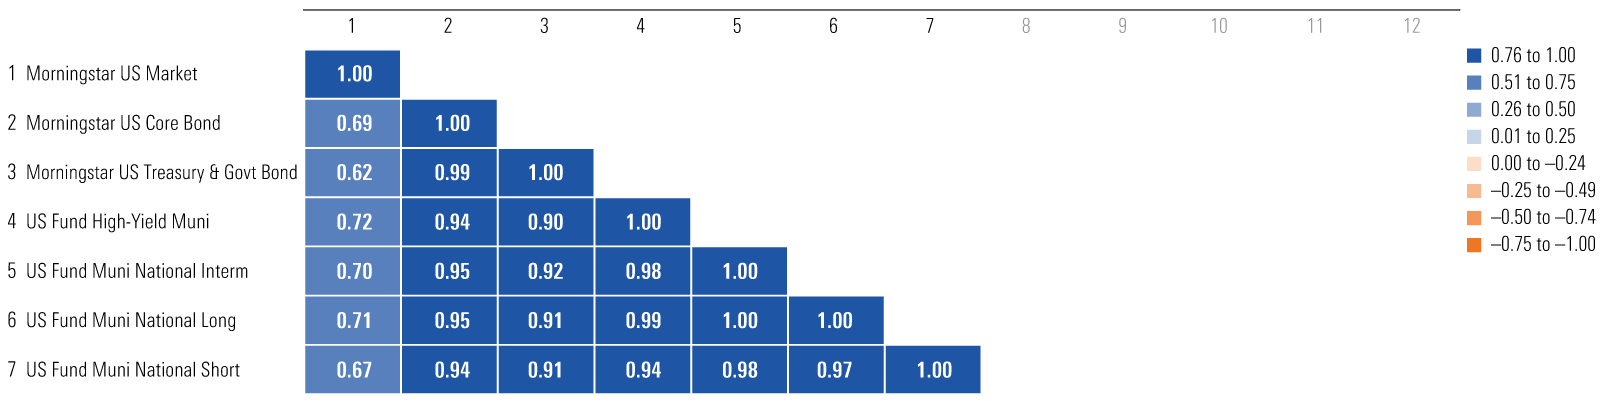
Recent Performance Trends: Municipal Bonds
Municipal bonds’ performance and correlation patterns have been similar to taxable ones. Rolling three-year correlations are often negative with US equities, as they were from January 2016 through February 2020, but the pandemic introduced anxieties around how the economies of state and city municipalities would open and what their revenues would look like in a world reshaped by lockdowns. As a result, correlations relative to equities turned positive and have increased since 2020. The interest-rate increases that began in 2022, sending both stock and bond prices tumbling at once, further boosted equity and fixed-income correlations.
Longer-term and high-yield munis, not surprisingly, exhibited the most equitylike performance, while short-term munis had the lowest correlation relative to US stocks over the past three years. And even as Treasury bonds’ correlations spiked during the three-year period, Treasuries still were better diversifiers relative to stocks than munis were.
Three-Year Correlation Matrix: Municipal Bonds
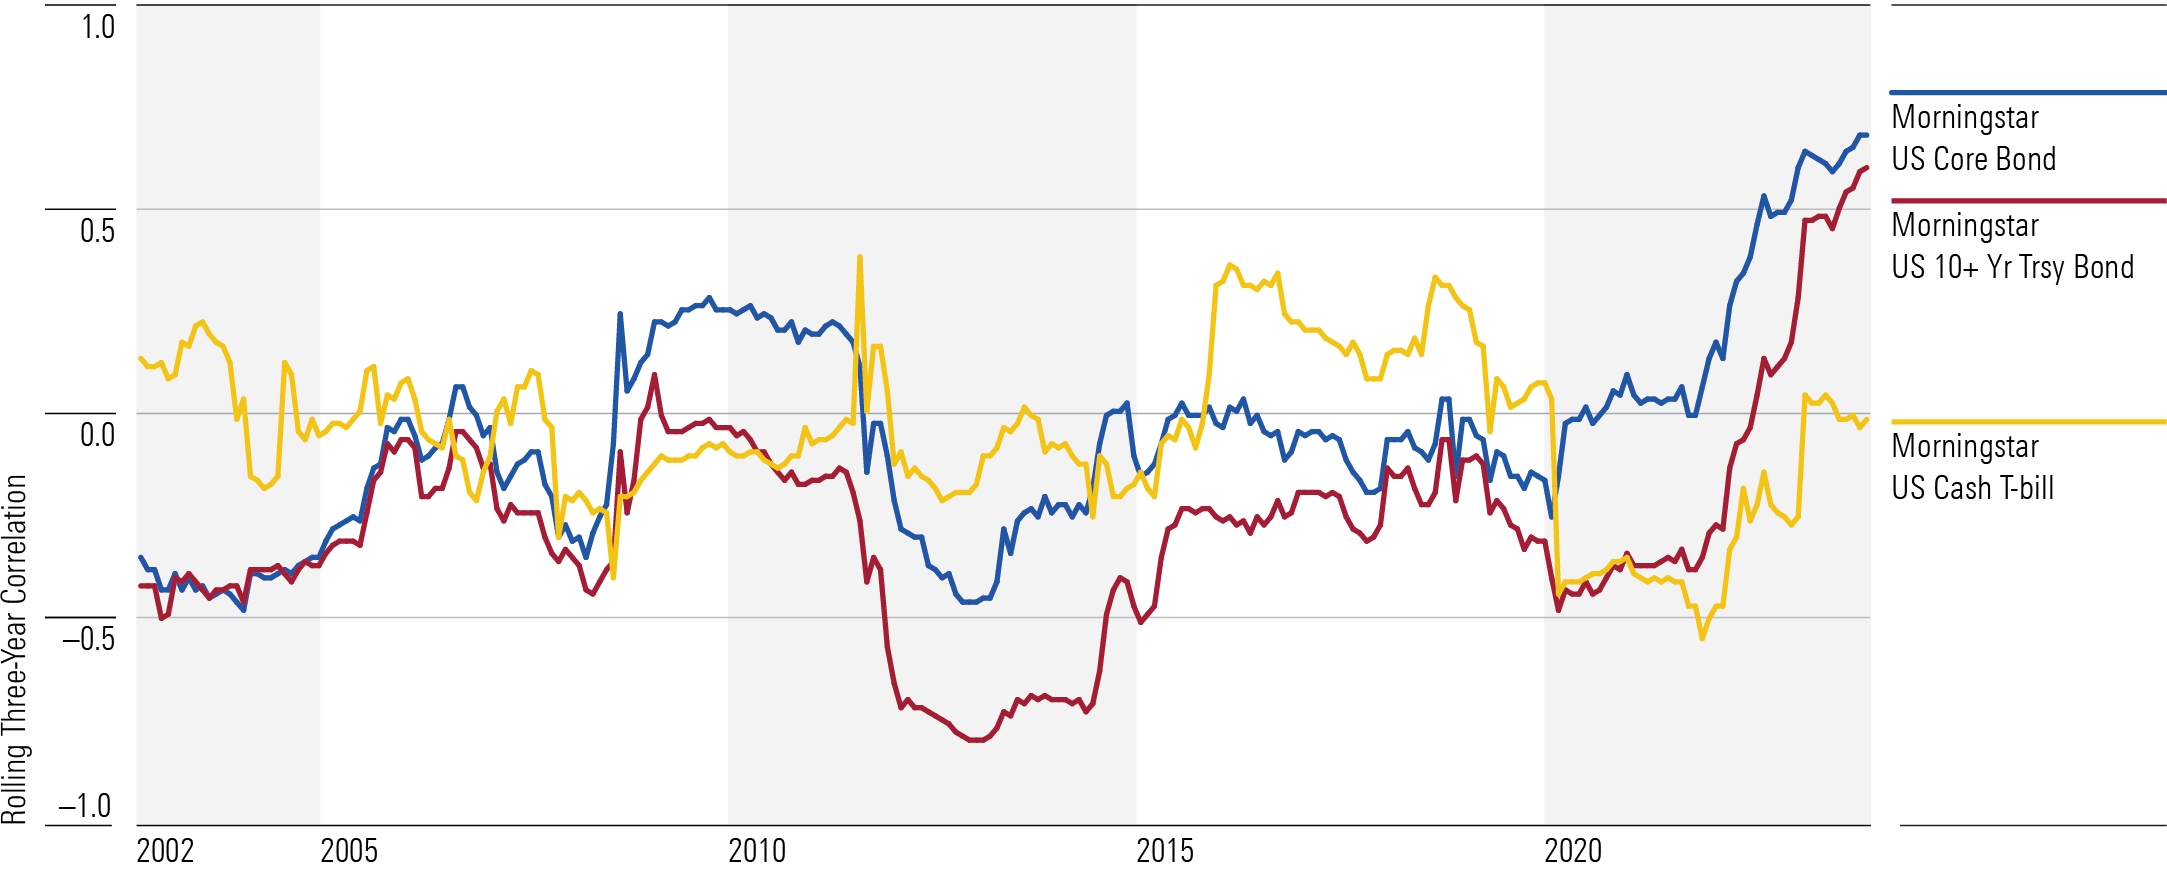
Longer-Term Trends: Taxable Bonds
Recency bias might cause an investor to balk at the usefulness of US Treasuries in a portfolio, as correlations with US stocks have spiked since 2021. But over the long term, US Treasuries and other high-quality government-backed fare, such as agency mortgages, remain some of the most compelling diversifiers for a portfolio over the long term. When interest rates are stable or falling, these bonds provide a modest but reliable return that balances the volatile swings inherent in stocks. Riskier allocations such as high-yield and emerging-markets debt, on the other hand, serve as poor diversifiers relative to equity.
The graphic below depicts how Treasury bonds have been the best diversifiers for US equities over long stretches during the past 20 years. More recently, however, cash was the best diversifier.
Rolling Three-Year Correlations vs. Morningstar US Market Index: Taxable Bonds
Longer-Term Trends: Municipal Bonds
Since 2000, most muni-bond indexes have exhibited a correlation with equities that was higher than that of US Treasuries and other government-backed fare but lower than investment-grade corporate credits. But in periods of equity market volatility driven by a weakening economy, municipal bonds have decoupled from Treasuries and other US government bonds, likely on concerns that higher unemployment and weak business conditions would hurt tax receipts. For example, the correlation between muni yields and US Treasury yields broke heavily in 2020′s turbulent first half of the year.
Rolling Three-Year Correlations vs. Morningstar US Market Index: Municipal Bonds
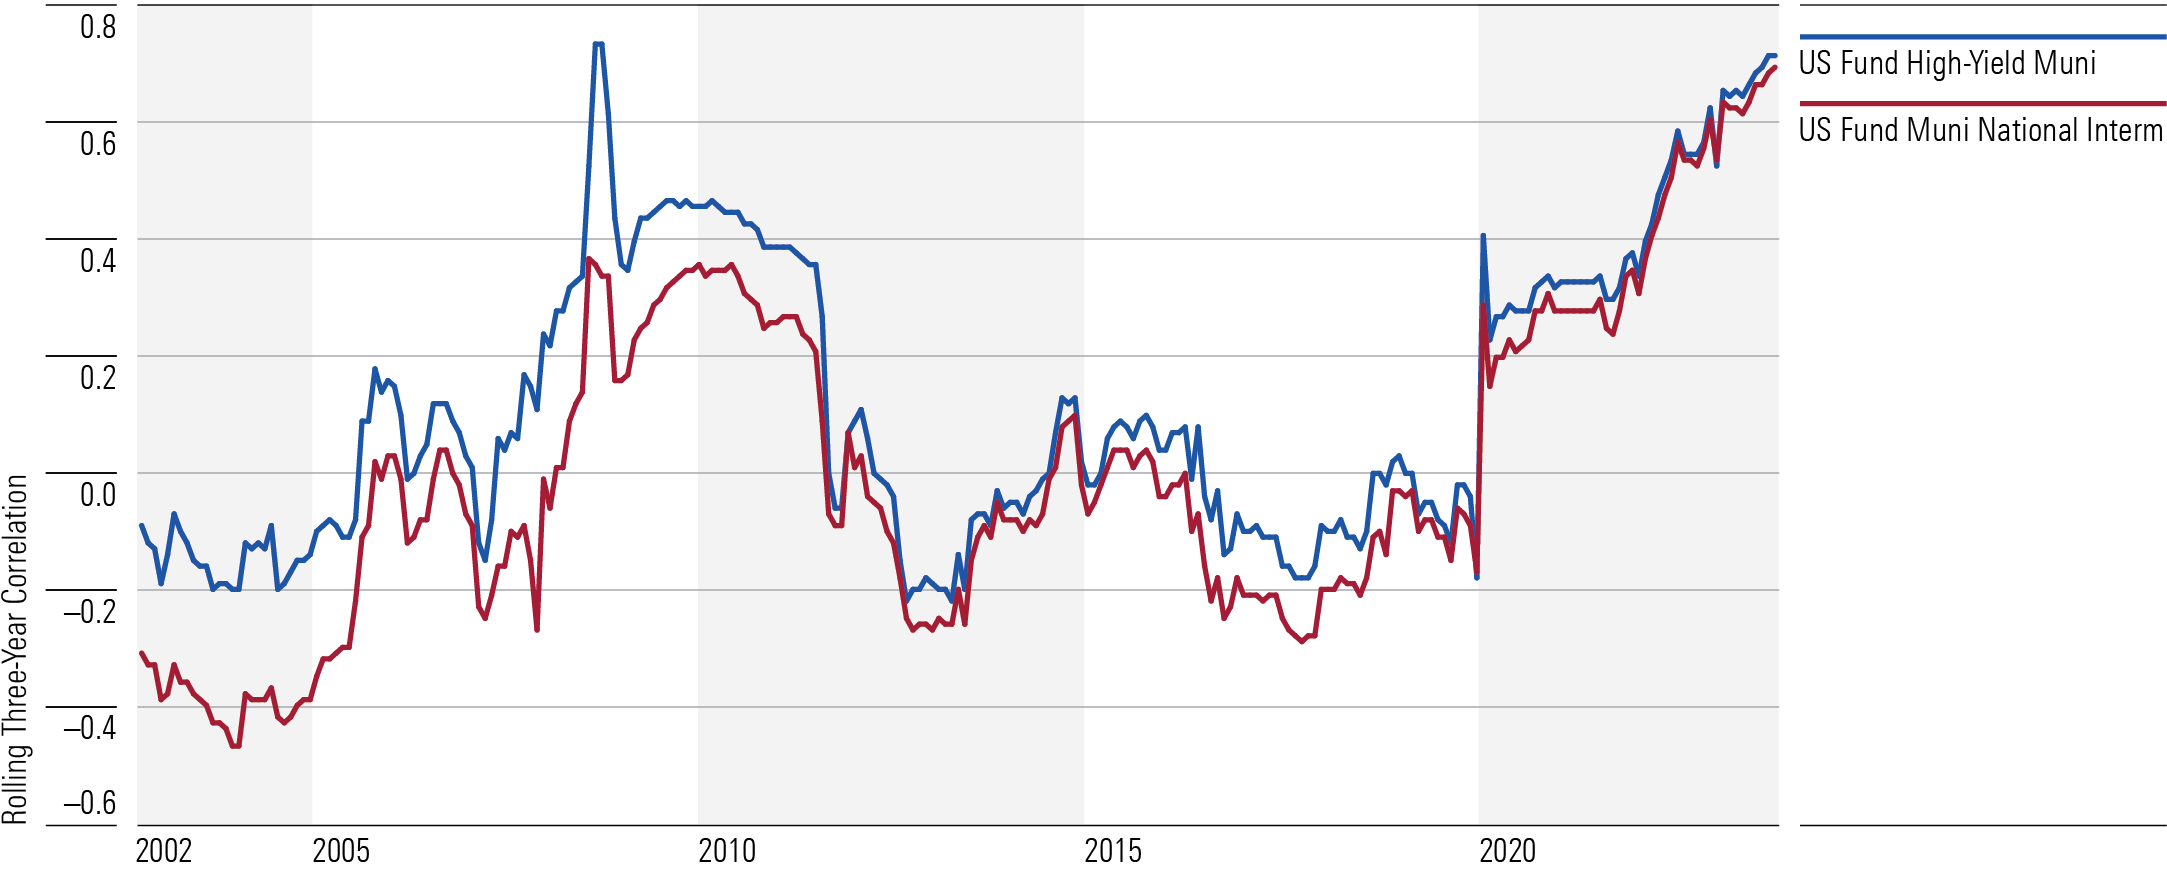
Munis’ correlation with stocks has risen sharply since 2020, as the graph above shows. There are a few reasons for that. One is that nearly all fixed-income assets, including municipal bonds, saw their correlations with stocks jump in 2022. Moreover, the muni market is less liquid than the US Treasury market, and it has often seized up in periods of economic and equity market stress, such as the onset of the pandemic in March 2020. Munis have been less effective diversifiers for equities than US Treasuries or cash. Across all longer-term time frames, high-yield muni funds were the least effective diversifiers for equities of any muni fund group. That is similar to the trend for high-yield taxable bonds, which are much less defensive and more sensitive to economic stress than high-quality bonds.
Portfolio Implications
A portfolio constructed for long-term resilience will be well served by a high-quality government-bond allocation, in particular one with US Treasuries and agency mortgages. During periods of stable or falling interest rates, these fixed-income building blocks may generate only modest yields but provide enough protection during volatile equity markets to result in more-attractive risk-adjusted returns.
Although bonds served as a source of portfolio pain in 2022, over longer periods and more typical interest-rate backdrops, a high-quality US government-bond sleeve improved diversification more often than it detracted from it. And US Treasuries aren’t exclusive in providing this counterbalance. Intermediate-term and short-term maturities of diversified high-quality bonds also provide some refuge when the US equity portion of a portfolio is under duress. Riskier fixed-income subsectors, such as high yield, nonagency mortgages, and emerging-markets debt, are highly correlated with stocks and should be seen as equitylike complements to a portfolio.
The takeaways are similar for municipal bonds. High-quality munis have typically held up much better than stocks during equity market swoons. But over longer periods, munis have exhibited a higher correlation with equities than high-quality taxable-bond indexes, especially US Treasury bonds. That suggests that even investors who value the tax-saving features of muni bonds should consider augmenting them with US government bonds for diversification and ballast during equity market shocks. High-yield munis’ higher correlation with equities, meanwhile, indicates that such bonds are best used alongside higher-quality muni bonds (or high-quality taxable bonds) for investors aiming to diversify equity risk.
Moreover, the 2022 experience illustrates the virtue of cash in a balanced portfolio, particularly for investors who are retired and actively drawing upon their portfolios for living expenses. While cash might not earn much over inflation over long periods of time, a modest allocation can provide both safety and liquidity when stocks and bonds fall simultaneously. (Investors in high tax brackets can use municipal money market funds in that role.)
Correction: In a previous version of this article, the Three-Year Correlation Matrix: Municipal Bonds exhibit incorrectly labeled the Morningstar US Market Index.
The author or authors do not own shares in any securities mentioned in this article. Find out about Morningstar’s editorial policies.
/cloudfront-us-east-1.images.arcpublishing.com/morningstar/6ZMXY4RCRNEADPDWYQVTTWALWM.jpg)
/cloudfront-us-east-1.images.arcpublishing.com/morningstar/URSWZ2VN4JCXXALUUYEFYMOBIE.png)
/cloudfront-us-east-1.images.arcpublishing.com/morningstar/CGEMAKSOGVCKBCSH32YM7X5FWI.png)
:quality(80)/s3.amazonaws.com/arc-authors/morningstar/66112c3a-1edc-4f2a-ad8e-317f22d64dd3.jpg)