
How Index-Tracking Funds Are Trimming Their Trading Costs
These latest index enhancements go one step beyond rules designed to curb turnover.
/s3.amazonaws.com/arc-authors/morningstar/78665e5a-2da4-4dff-bdfd-3d8248d5ae4d.jpg)
Index-tracking funds have grown a lot over the past decade. In many ways, Vanguard Total Stock Market ETF VTI is the poster child of their rise to prominence. The growing popularity of this exchange-traded fund and its mutual fund share classes, combined with a decadelong bull market, has helped it grow from about $200 billion at the end of November 2012 to more than $1.1 trillion just 10 years later.
Size has its advantages, but it can also create some new challenges. Any investment, whether active or passive, requires transacting in real-world markets. Money must be exchanged for stocks, and those trades come with frictions that erode a fund’s total return. These include direct costs, such as brokerage commissions or duties owed to foreign governments, and hidden costs that stem from trading.
Index funds have long employed rules aimed at taming these costs by controlling turnover. Simply not trading is the easiest way to save some money. But as index-tracking funds have grown larger, so too have the size of their trades and the requisite charges. The latest index enhancements go one step beyond rules designed to curb turnover. Some newer indexes have started to borrow tactics used by active traders to further temper trading costs. The measures used by the people overseeing active funds have started to make their way into the index construction process, to the benefit of investors.
The advantage conferred by these accommodations is quite small and difficult to measure. But they’re still a move in the right direction.
The Active Edge
Since its founding, Dimensional Fund Advisors has combined elements of passive and active portfolio management into one package that’s largely replicated across its lineup. Its mutual funds and ETFs look a lot like index-tracking funds, but none of them explicitly track an index. Its researchers intentionally designed many of its investment portfolios this way to control turnover and allow for more-flexible trading. The idea was to give traders some wiggle room to buy and sell when the conditions were more favorable, allowing them to sidestep costly transactions that can eat away at performance.
Among the tools at their disposal, traders aren’t forced to execute any trade. They can substitute a stock with an unfavorable price for another with similar characteristics that’s trading in a more attractive range. And those transactions can be broken up into smaller pieces and spread across several hours or days, making them less likely to move prices around in a disadvantageous way.
Those measures seem reasonable. But the advantage is difficult to measure precisely and isolate from a fund’s total return. DFA US Large Company DFUSX exemplifies the difficulty of that task. It doesn’t replicate the S&P 500. Instead, portfolio managers can deviate slightly from the index to facilitate more cost-effective trades, and its modest tracking error relative to the S&P 500 confirms it has hewed close to that benchmark.
On average, DFA charged about 0.09% annually for this mutual fund over the 10 years through October 2022, and it lagged the S&P 500 by 0.07% per year over the same period. Subtracting that deficit from the net expense ratio means DFA’s managers added about 0.02% in annualized total return before fees.
Sorting out where that 0.02% came from is no trivial task because not all of it came from savvy trading. The fund can also lend out securities to increase income (to the benefit of fund investors), so any attempt at quantifying the trading impact needs to account for that activity.
Attempting to measure the trading advantage gets a lot messier when looking at the before-fee excess return over time. Exhibit 1 shows that it fluctuates year over year, indicating that the combined advantages from trading and securities lending come and go as market conditions change. That observation turns some simple arithmetic into a more arduous exercise in mutual fund accounting.
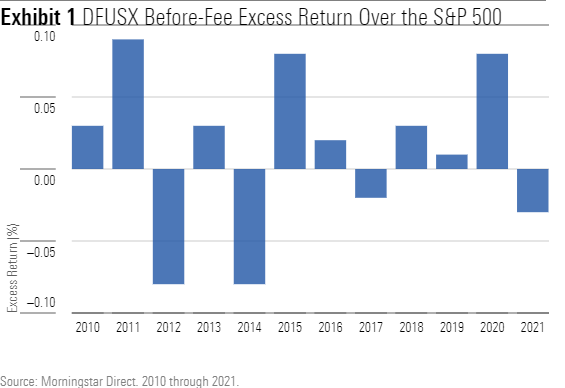
But a deep dive into this fund’s financial statements isn’t necessary to arrive at some important conclusions. First, the advantage conferred by slick trading is quite small. Its magnitude tends to hover around 0.01% per year (if that) for stocks in the S&P 500 when annualized over a 10-year period.
It also doesn’t indicate the effectiveness of the trading effort relative to the opportunities presented. There’s no alternative performance that quantifies how DFA US Large Company would have performed over the same period with slightly different transactions occurring under slightly different circumstances. S&P 500 stocks are among the easiest to trade and usually the least vulnerable to poor execution quality. The benefits of enhancing execution quality most likely come from limiting poor tracking performance as much as generating excess returns.
These critiques don’t mean that careful trading should be ignored. Portfolio managers should take advantage of every opportunity available to gain an edge that benefits their investors. While the advantage doesn’t appear to be noticeable, recent developments on indexes tied to some popular ETFs indicate that it’s something worth pursuing.
Imitation Is the Best Form of Flattery
Index-tracking funds don’t immediately lend themselves well to active trading. They have to trade certain stocks on certain days, as outlined in their rule books, to maintain tight tracking and deliver their target indexes’ performance. That means they usually trade at the market’s closing price, and they must accept whatever the market is asking. It’s unlikely they’ll ever match the advantages provided by active traders. But they can make a dent, even if it’s small. New indexes that launched in the past decade take a slightly different approach to rebalancing their portfolios—those occasions when they add new stocks that meet their criteria and remove those that no longer qualify. Most indexes have historically accounted for these changes on a single day, while the newer breed spreads its rebalancing activity across several days. It’s a small detail that allows the fund to slowly trade its holdings over time while maintaining tight index tracking. The effect is similar to dollar-cost averaging, but over a short time horizon. It also helps relieve some of the pressure that large trades can exert on stock prices.
The CRSP US Total Market Index represents the most prominent example of an index that incorporates some of these new trading provisions. It breaks up its rebalancing trades over five days when it rebuilds its portfolio in March, June, September, and December. VTI began tracking this benchmark in June 2013. The adoption of this feature hasn’t been limited to VTI. While the details vary slightly from one ETF to another, the motivation to curb trading costs is largely the same. Other large index-tracking funds from Vanguard also track CRSP indexes that employ the same rules, including Vanguard Value ETF VTV and Vanguard Small-Cap ETF VB. IShares MSCI USA Momentum Factor ETF MTUM changed its target index in November 2020 to the MSCI USA Momentum SR Variant Index. The only difference between this new bogy and the outgoing one was a provision that spreads its rebalancing trades across three days. Likewise, Schwab Fundamental U.S. Large Company ETF FNDX rebalances a different 25% of its portfolio every three months.
Executing trades in a cost-effective way is inherently a good idea. Trading almost always comes with costs, and taking steps to minimize those costs should only benefit investors. It’s the latest way indexes are adjusting their rules to improve performance, though the effect is barely noticeable.
Nor should it be. The primary objective of these funds is still to track their target index, not outperform it. The advantages often boil down to lower trading costs, which lurk within a fund’s historical track record and are difficult to extract.
These advantages are best likened to the cherry on top of a sundae rather than the ice cream. None of them are the main reason for choosing one ETF or mutual fund over another, but they’re nice to have. The underlying investment strategy, its diversification potential and fit within a broader investment portfolio, and its fees are still the main items that investors should spend their time scrutinizing.
The author or authors do not own shares in any securities mentioned in this article. Find out about Morningstar’s editorial policies.
/cloudfront-us-east-1.images.arcpublishing.com/morningstar/BNHBFLSEHBBGBEEQAWGAG6FHLQ.png)
/d10o6nnig0wrdw.cloudfront.net/05-02-2024/t_60269a175acd4eab92f9c4856587bd74_name_file_960x540_1600_v4_.jpg)
/cloudfront-us-east-1.images.arcpublishing.com/morningstar/5WSHPTEQ6BADZPVPXVVDYIKL5M.png)
:quality(80)/s3.amazonaws.com/arc-authors/morningstar/78665e5a-2da4-4dff-bdfd-3d8248d5ae4d.jpg)