
Are Dividend Funds Overvalued?
Despite their popularity, the average dividend-focused fund isn’t trading at a premium relative to the broad market.
/s3.amazonaws.com/arc-authors/morningstar/64dafa24-41b3-4a5e-aade-5d471358063f.jpg)
It’s easy to understand the surge in demand for dividend-oriented strategies we’ve witnessed in recent years. As baby boomers age, they generally desire less volatility and higher yields. And bonds aren’t providing the levels of income that they used to. The 10-year U.S. Treasury yielded 2.3% as of Nov. 28, 2016. It yielded 4.5% and 6.1% at the end of November 2006 and November 1996, respectively. Fund families have responded to investor demand. Over the trailing 10 years, around 100 funds offering investors exposure to dividend-oriented strategies have been launched, nearly doubling the number of such funds available to investors. But has the increased demand for dividend-oriented strategies driven the valuations for dividend-paying stocks too high?
Dividend-oriented funds come in two main flavors. There are those that prioritize dividend growth and quality over high current yields and those that prioritize high current dividend yields over dividend growth. The latter often come with greater risk. High-yielding stocks pay out a larger portion of their earnings and have less of a cushion to cover their dividend if their business deteriorates compared with their lower-yielding counterparts. Higher yields may also indicate that a business has poor prospects.
Because dividend-growth and dividend-yield-focused funds have distinct goals, their portfolio characteristics naturally differ. For an apples-to-apples comparison, I evaluated both groups’ relative valuations separately. The dividend-growth group I’ve analyzed consists of 72 funds representing $192 billion in assets. The dividend-yield group consists of 148 funds with a collective $484 billion in assets. All the data in this examination runs through the end of September 2016, and these funds represent nearly all dividend-oriented mutual funds, exchange-traded funds, and closed-end funds. Because funds that seek out stocks sporting high current dividend yields have a natural value orientation, I chose the Russell 1000 Value Index as the benchmark for the group. Meanwhile, I compared the dividend growth funds’ valuations with the Russell 1000 Index because their portfolio characteristics better match those of large-cap-blend strategies.
To evaluate each groups’ relative valuation, I formed a composite of a few different valuation metrics. I then compared these composite figures for both groups with their respective benchmarks. This composite is an equal-weighted average of four valuation metrics: price/earnings, price/book, price/sales, and price/cash flow. I divided this figure for each group by the same composite figure I derived for their respective benchmarks in order assess their relative valuation. A ratio greater than 1.0 indicates that the dividend-growth or high-yield group is relatively overvalued versus its benchmark, while a value less than 1.0 indicates that either cohort is undervalued relative to its benchmark.
Exhibit 1 shows the time series of this ratio for the high-yield group from October 2006 through September 2016. At the end of September 2016, the ratio was 1.15, meaning that the average yield-focused, dividend-oriented strategy was trading at a 15% premium to a market-capitalization-weighted basket of large-cap-value stocks market. This ratio has been steady over time. It averaged 1.2 over the trailing 10 years. Since the bottom of the bear market in March 2009, the lowest this ratio has dipped was 1.12--a level reached on four separate occasions. The ratio peaked at 1.32 in February 2010. Indeed, at the end of September, the ratio’s level ranked in the 29th percentile, meaning that it was lower than 71% of the monthly measurements taken over the trailing decade. This suggests that the average yield-focused fund was not meaningfully overvalued relative to the Russell 1000 Value Index.
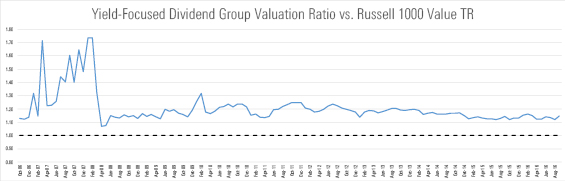
- source:
Morningstar Direct, Analyst Calculations
The story is much the same for dividend-growth focused strategies. Exhibit 2 plots the same ratio for dividend growth funds over the trailing 10-year period through September 2016. Over the past 10 years, dividend-growth funds’ valuations have generally been in line with their benchmark, with some episodic exceptions that centered around the financial crisis. As of September 2016, the group’s composite valuation ratio was 1.04 times the index’s. The ratio has dipped just below 1.0 nine times since the market’s nadir in March 2009. Again, values less than 1.0 indicate that the average dividend-growth fund is relatively undervalued versus the index. This ratio peaked at 1.11 in February 2010 (the same month that the ratio for yield-focused strategies peaked). Over the 10-year period through September 2016, the ratio has averaged 1.05. So, at the end of September, it was trading in line with historical values. Like the high-yield group, it seems that the dividend-growth funds aren’t--on the whole--relatively overvalued.
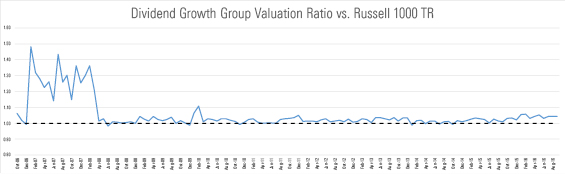
- source:
Morningstar Direct, Analyst Calculations
Each group’s dividend yield ratios have also been consistent compared with their respective indexes. The ratio of the high-yield-focused group’s average indicated annual dividend yield to the yield of the Russell 1000 Value Index was 1.23 at the end of September 2016, in line with its 10-year average of 1.25. Similarly, the ratio of the dividend growth funds’ average indicated annual yield to the yield of the Russell 1000 Index was 1.19. Its 10-year dividend ratio has averaged 1.13. In both cases, these ratios are roughly in line with their 10-year average.
Bring on the Dividends
Dividend-growth and high-yield strategies do not appear overvalued on average, but investors can’t invest these averages. When it comes to selecting funds from either group, fees and process are always important considerations.
VIG tracks the Nasdaq U.S. Dividend Achievers Select Index, which includes stocks that have increased their dividend for at least 10 consecutive years but excludes REITs and other companies that have low potential for dividend growth. Unsurprisingly, the fund has seen a drop in its energy exposure as oil prices have slid, from almost 10% of assets in March 2014 to 1% in August 2016.
The fund focuses on firms that are healthy enough to grow their payouts, favoring highly profitable companies with durable competitive advantages. Relative to the S&P 500, the fund’s portfolio features stocks sporting higher average returns on equity, assets, and invested capital. Furthermore, its quality tilt has helped it shine during market downturns. For example, it held up better than the S&P 500 and landed in the top decile of the large-blend Morningstar Category in the rocky market environments of 2008 and 2011.
For a higher-yielding tilt, VYM offers an attractive dividend yield without taking excessive risk. While it doesn’t screen for dividend sustainability like VIG, the fund’s broad market-cap-weighted portfolio effectively diversifies risk and promotes low turnover. Its sizable cost advantage gives it a durable edge against its peers.
The fund starts with all U.S. dividend payers (excluding REITs and smaller stocks), targets those representing the higher-yielding half, and weights them by market cap. This creates a portfolio of more than 400 names that leans toward mature giants such as
High-yielding stocks tend to pay out a larger share of their earnings than average, leaving a smaller buffer to preserve dividend payments should earnings fall. And some of them may carry high business risk. Indeed, the fund has invested in some stocks that have cut their dividends, like
Given each fund’s differing goals, it’s not surprising that VIG’s SEC yield is 2.2% while VYM’s is 3.2% (as of Nov. 28, 2016). At the end of November 2016, both funds were trading close to fair value, based on Morningstar equity analysts’ assessments of their underlying holdings. This is consistent with the valuation analysis provided above and may provide some level of comfort to investors eyeing dividend-oriented funds.

Disclosure: Morningstar, Inc. licenses indexes to financial institutions as the tracking indexes for investable products, such as exchange-traded funds, sponsored by the financial institution. The license fee for such use is paid by the sponsoring financial institution based mainly on the total assets of the investable product. Please click here for a list of investable products that track or have tracked a Morningstar index. Neither Morningstar, Inc. nor its investment management division markets, sells, or makes any representations regarding the advisability of investing in any investable product that tracks a Morningstar index.
/d10o6nnig0wrdw.cloudfront.net/05-31-2024/t_68607a5db29e471d8bf1a155ea356f7c_name_file_960x540_1600_v4_.jpg)
/cloudfront-us-east-1.images.arcpublishing.com/morningstar/HDPMMDGUA5CUHI254MRUHYEFWU.png)
/cloudfront-us-east-1.images.arcpublishing.com/morningstar/3WXR46JX6VF2HMOMAWQGCO67DM.jpg)
:quality(80)/s3.amazonaws.com/arc-authors/morningstar/64dafa24-41b3-4a5e-aade-5d471358063f.jpg)