
A Different Way to Frame Fees
Investors know what they are paying in fees, but more should be asking if they are getting what they pay for.
/s3.amazonaws.com/arc-authors/morningstar/a90ba90e-1da2-48a4-98bf-a476620dbff0.jpg)
A version of this article was published in the March 2017 issue of Morningstar ETFInvestor. Download a complimentary copy of ETFInvestor here.
Fund fees command a lot of attention, and rightfully so. They are, after all, the most reliable estimator of a fund’s return prospects. As Vanguard founder Jack Bogle has said time and again, “In investing, you get what you don’t pay for.” But that doesn’t mean investors should select funds based solely on fees. There are numerous factors that should be taken into account when choosing funds. These include the skills, experience, and structure of the fund’s management team, the process they employ (which is largely dictated by an index methodology in the case of most index funds and exchange-traded funds), and whether the fund’s sponsor is a sound steward of shareholders’ capital, amongst others. It can also be useful to take a more holistic approach to assessing fees. Here, I will explore a different approach to framing fund fees, one that looks not just at how much you’re paying, but also what you’re getting.
A Brief Detour Through Active Share Active share was first introduced in a 2009 research paper that claimed the measure could be used to predict fund performance.[1] Specifically, the authors found that funds with higher active share outperformed those with lower active share. Roughly speaking, active share is a measure of the amount of active management in a portfolio. The less a fund looks like its index (by way of holding nonindex stocks, omitting index stocks, or having over- or underweightings relative to the index), the higher its active share. An index fund that perfectly replicates its bogy would have an active share of zero. A fund that owns half the stocks in its benchmark in their corresponding weightings would have an active share of 50%. A fund that looks nothing (and I mean nothing) like its benchmark would have an active share of 100%. Funds with low active share are often labeled "index-huggers" or "closet indexers." Funds with high active share are deemed more desirable.
Asset managers, consultants, and fund selectors immediately latched onto active share. A new predictor of fund performance that isn’t fees? Yes, please! The measure was quickly introduced into the popular lexicon, and there was no looking back. But then...
A number of researchers subsequently threw cold water on the concept.[2][3] As it turns out, the funds with the highest active shares tended to be small-cap funds. Small-cap managers benchmarked to the Russell 2000 Index (lots of stocks, smaller weightings), are far more likely to have a greater active share than large-cap managers measured against the S&P 500 (fewer stocks, larger weightings). In essence, the real finding of the original active share paper was that small-cap funds had better odds of beating their benchmark than large-cap funds. This is hardly groundbreaking news.
Is active share meaningless? In my opinion, the answer is a resounding no. But its value to investors is descriptive rather than prescriptive. It does exactly what it sets out to accomplish: It measures the magnitude of active management present in a portfolio. It's a useful complement to other measures of the degree of active management, such as tracking error. But these measures are not predictive. Remember, there is a certain degree of symmetry to the outcomes of taking active risk. For every high-active-share manager in a given universe that beats “the market,” there is another high-active-share manager on the other side of the distribution licking their wounds.
Back to Fees Active share can also be helpful in scaling fees. No one wants to pay active-management fees to an index-hugger. Using active share to reframe fees can help investors understand how much bang (active share) they are getting for their buck. In a 2015 study, Martjin Cremers and Curtis Quinn expanded on the active share concept, introducing a measure they refer to as active fee, which is measured as follows[4]:
Active Fee = [ER - (1 - AS)*PF] / AS
Where: AS = Active Share; ER = Expense Ratio; and PF = Passive Fee.
So, for example, a fund with an active share of 50%, a 1% expense ratio, and a comparable passive peer charging 0.05% would have an active fee of 1.95%—not a compelling proposition. If the fund’s active share were 90%, its active fee would be 1.11%—a far better value.
For those interested, Cremers has built a handy tool, which you'll find at www.activeshare.info, that allows you to look at current and historical active share for individual funds. It also allows you to calculate funds' active fees.
Hijacking Active Fee This same basic concept can be applied to strategic-beta exchange-traded products. We can reframe these products' fees to better understand how much active risk we are getting for our money. But first, I need to adapt Cremers and Quinn's active fee measurement a bit to better suit our circumstances. For purposes of this analysis, I've calculated what I'll call the value-for-money, or VFM, proposition as follows:
VFM = (ER - PF)/TE
Where ER = Expense Ratio, PF = Passive Fee; and TE = Tracking Error.
I've opted to use tracking error in lieu of active share in my calculation for two main reasons:
- It's easier to calculate.
- As covered in Cremers and Petajisto, it is likely a better proxy for factor bets (the type these funds are designed to make) than active share.
The accompanying exhibits show the VFM values for non-market-cap-weighted strategic-beta ETPs in the large-, mid-, and small-value Morningstar Categories. In each case, I've used a style-appropriate Vanguard ETF (
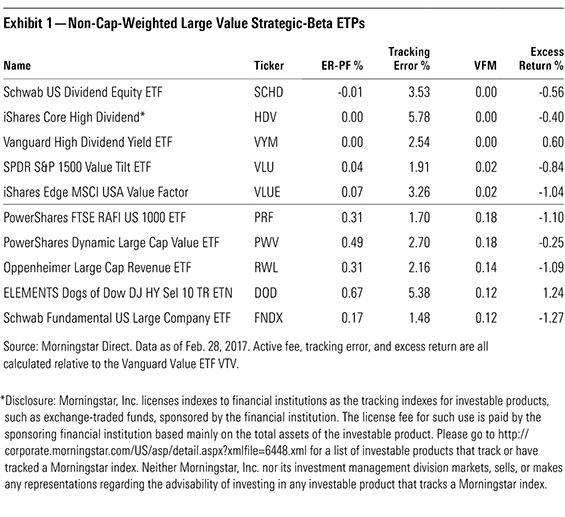
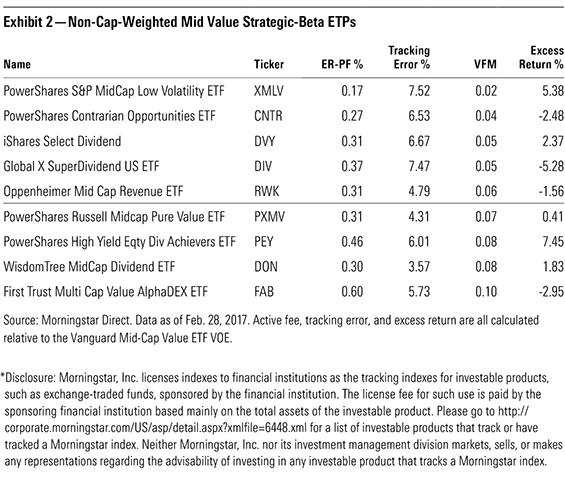
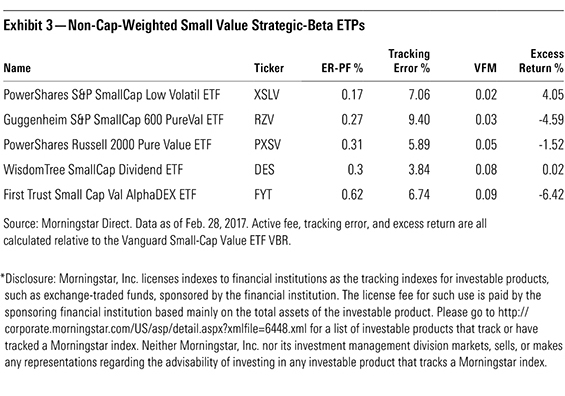
ETPs with lower VFM values represent better values as they measure the price paid in excess of the cost of a purely passive alternative per unit of active risk (as measured by tracking error). The first table contains data for the five best and worst values based on this metric within the large-value category. The top five are effectively a free bet on market-beating performance. The bottom five come at a price. The second and third tables contain data for all of the mid- and small-cap value funds that met my criteria and had a three-year track record. Again, the least expensive of them as measured by VFM offer a compelling proposition.
Searching for Meaning I think this is an interesting way to reframe fees. But, like any other measure, it is not a silver bullet. As you can see in Exhibits 1-3, there is no relationship between active risk (as measured by tracking error) and excess returns. Granted, this is a small sample and only a three-year look back, but others have shown that it holds over bigger samples and longer periods.[5]
I believe the active fee concept or some Frankenstein-monster version thereof, such as the VFM measure I've concocted here, are most useful in assessing the fees charged by honest-to-goodness active managers. In the context of a traditional actively managed fund, there are real and measurable costs to taking active risk. Fund firms must pay portfolio managers and analysts to kick tires and look under hoods in an attempt to get an edge over other market participants. They must also pay up for the tools and information these teams need to conduct their research and implement their views. These are all recurring costs. In the context of traditional active management, active risk is the product of countless decisions that are made daily.
Strategic-beta ETPs are a different beast. Their active bets are largely a product of the research that goes into developing the methodology of their underyling indexes. Once an index is born, the ongoing costs of calculating and maintaining it are low compared with traditional active funds. This explains why these funds' fees are, on average, lower relative to traditional active funds. However, if the cost of taking active risk in this manner on an ongoing basis isn't susbtantially different than the cost of maintaining a plain-vanilla cap-weighted fund (though there are greater turnover costs to consider), it's not clear why many strategic-beta ETPs charge fees that are many multiples greater than those levied by their more commonplace passive peers. We've seen evidence of fee pressure spilling over into strategic-beta ETPs in recent years. Having reframed these funds' fees, it's clear there is room for them to fall further in the future.
[1] Cremers, M., & Petajisto, A. 2009. "How Active Is Your Fund Manager? A New Measure that Predicts Performance." Review of Financial Studies, Vol. 22, No. 9, P. 3329.
[2] Cohen, T., Leite, B., & Nelson, D. 2014. "Active Share: A Misunderstood Measure in Manager Selection." https://www.fidelity.com/bin-public/060_ www_fidelity_com/documents/leadership-series_active-share.pdf
[3] Frazzini, A., Friedman, J., & Pomorski, L. 2016. "Deactivating Active Share." Financial Analysts Journal, Vol. 72, No. 2, P. 14.
[4] Cremers, M., & Curtis, Q. 2015. "Do Mutual Fund Investors Get What They Pay For? The Legal Consequences of Closet Index Funds." https://ssrn.com/ abstract=2695133
[5] Schlanger, T., Philips, C.B., & Peterson LaBarge, K. 2012. "The Search for Outperformance: Evaluating 'Active Share.'" https://institutional.vanguard. com/iam/pdf/VIPS_outperformance.pdf

Disclosure: Morningstar, Inc. licenses indexes to financial institutions as the tracking indexes for investable products, such as exchange-traded funds, sponsored by the financial institution. The license fee for such use is paid by the sponsoring financial institution based mainly on the total assets of the investable product. Please click here for a list of investable products that track or have tracked a Morningstar index. Neither Morningstar, Inc. nor its investment management division markets, sells, or makes any representations regarding the advisability of investing in any investable product that tracks a Morningstar index.
/cloudfront-us-east-1.images.arcpublishing.com/morningstar/EC7LK4HAG4BRKAYRRDWZ2NF3TY.jpg)
/cloudfront-us-east-1.images.arcpublishing.com/morningstar/T2LGZCEHBZBJJPPKHO7Y4EEKSM.png)
/d10o6nnig0wrdw.cloudfront.net/05-07-2024/t_9dca62d6f7b3444d90619b3637ec379b_name_file_960x540_1600_v4_.jpg)
:quality(80)/s3.amazonaws.com/arc-authors/morningstar/a90ba90e-1da2-48a4-98bf-a476620dbff0.jpg)