
Q3 2022 Market Trends in 8 Charts
The pros and cons of a strong U.S. dollar, headwinds facing the housing market, and more.
/s3.amazonaws.com/arc-authors/morningstar/a659ddb3-1d6f-4405-a4c4-9c325330c2da.jpg)
Inflation has been at the forefront of investors’ and policymakers’ minds this quarter. The U.S. Federal Reserve raised interest rates twice in the past three months by 75 basis points each--in July and September--to combat the surging inflation. As yields rose, investors began to pour money into short-term government-bond exchange-traded funds.
Both equity and fixed-income markets experienced another brutal quarter. Typically during periods of distress, investors reach for bonds to diversify their portfolio. Although, as of late, bonds have shown a higher correlation to the stock market than over the past five years, leaving investors with no place to hide.
The U.S. dollar strengthened against other currencies, but what may appear like a silver lining in the U.S. is actually distressing news for the rest of the world. Countries now also have to contend with the weakened purchasing power of their currencies globally when they’re already fighting soaring inflation of their own.
Every quarter, Morningstar’s quantitative research team reviews the most recent U.S. market trends and evaluates the performance of individual asset classes. We then share our findings in the Morningstar Markets Observer, a publication that draws on careful research and market insights. (Morningstar Direct and Office clients can download the report here.)
Here are some of the findings from our latest quarterly market review.
High Correlations, Widespread Losses
The performance of nearly all asset classes has shown unusually high correlations to the S&P 500 in 2022. With the S&P 500 down around 5% in the third quarter and over 20% year to date, even well-diversified investors have been struggling to find safety in their portfolios.
Rapid interest-rate increases have afflicted bonds and equities alike, as U.S. Treasury bonds were correlated 25% to the S&P 500 in the third quarter (compared with a negative 24% correlation over the trailing five years).
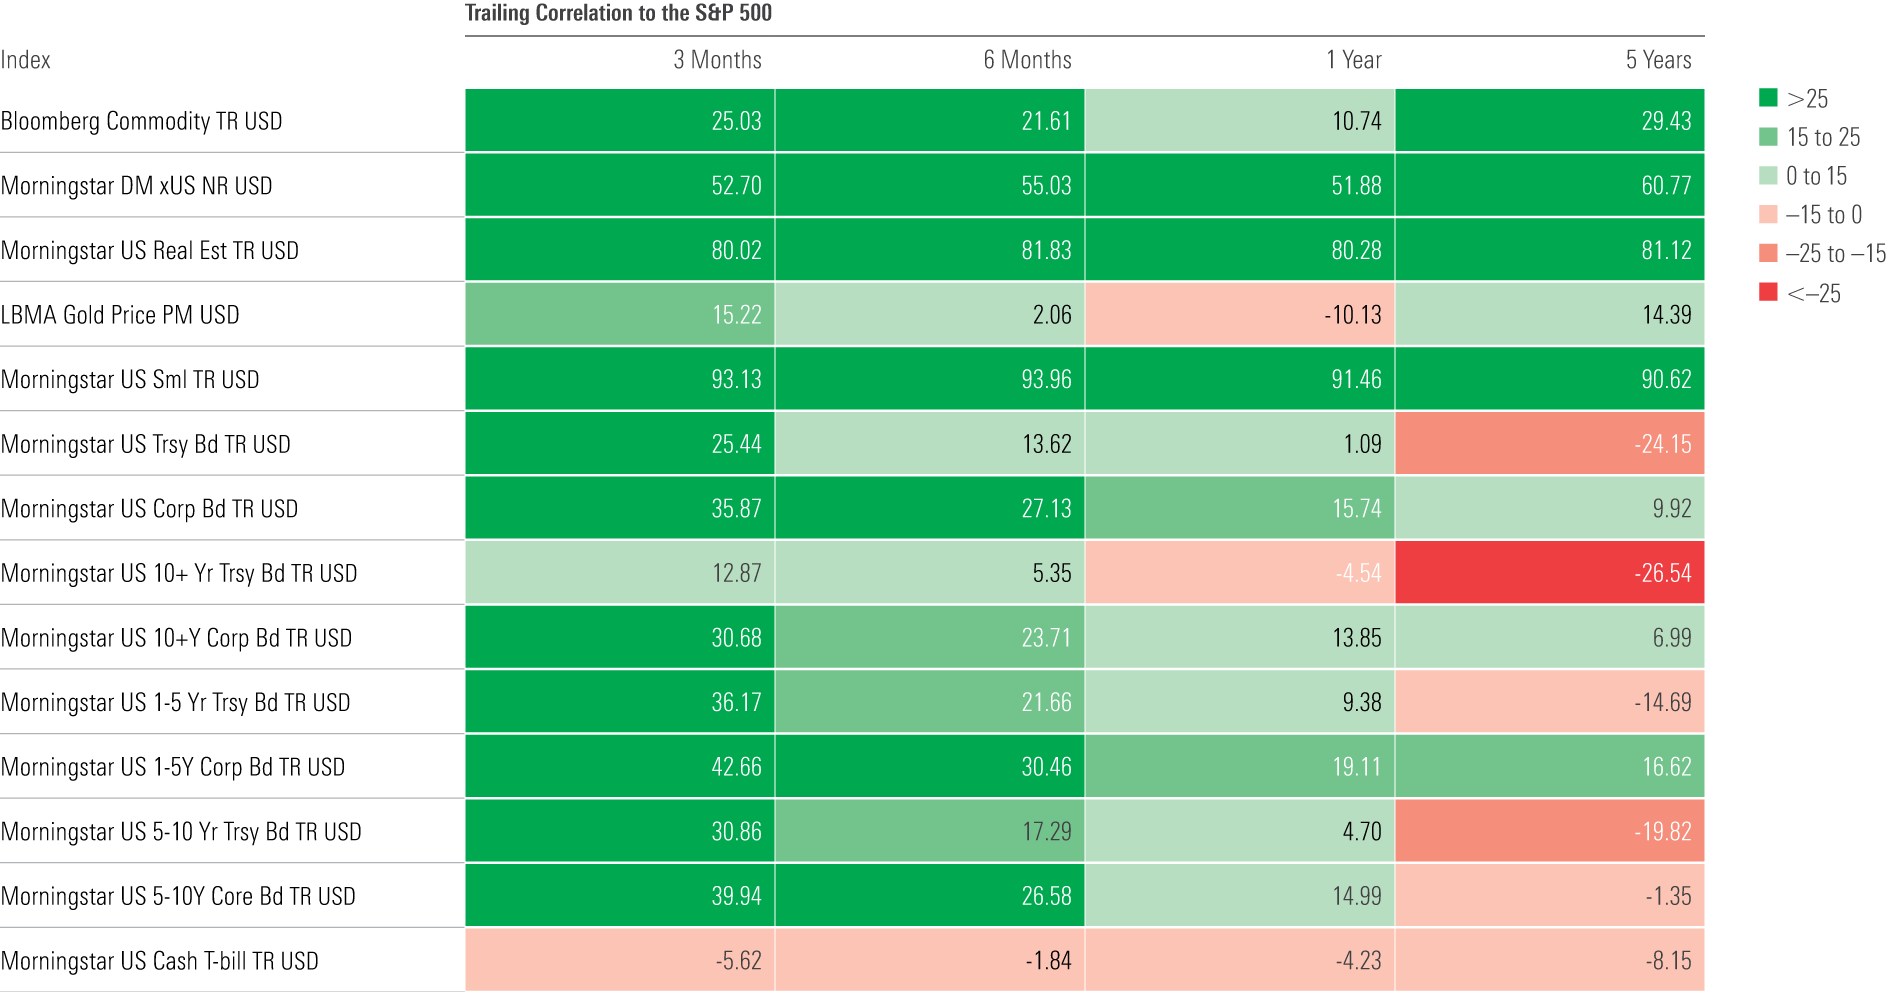
Source: Morningstar Direct. Data as of Sept. 30, 2022.
The Fed Is Targeting Actual Inflation, Not Inflation Expectations
Long-term inflation expectations (represented by the 5y/5y forward inflation expectation rate) peaked in April, then came down substantially over the summer, prompting calls for the Fed to slow its pace of tightening from some corners of the market. Good thing it didn’t; inflation remained elevated and inflation expectations bounced back accordingly. The Fed certainly cares about expectations but is expected to continue tightening until a significant slowdown in realized inflation takes place.
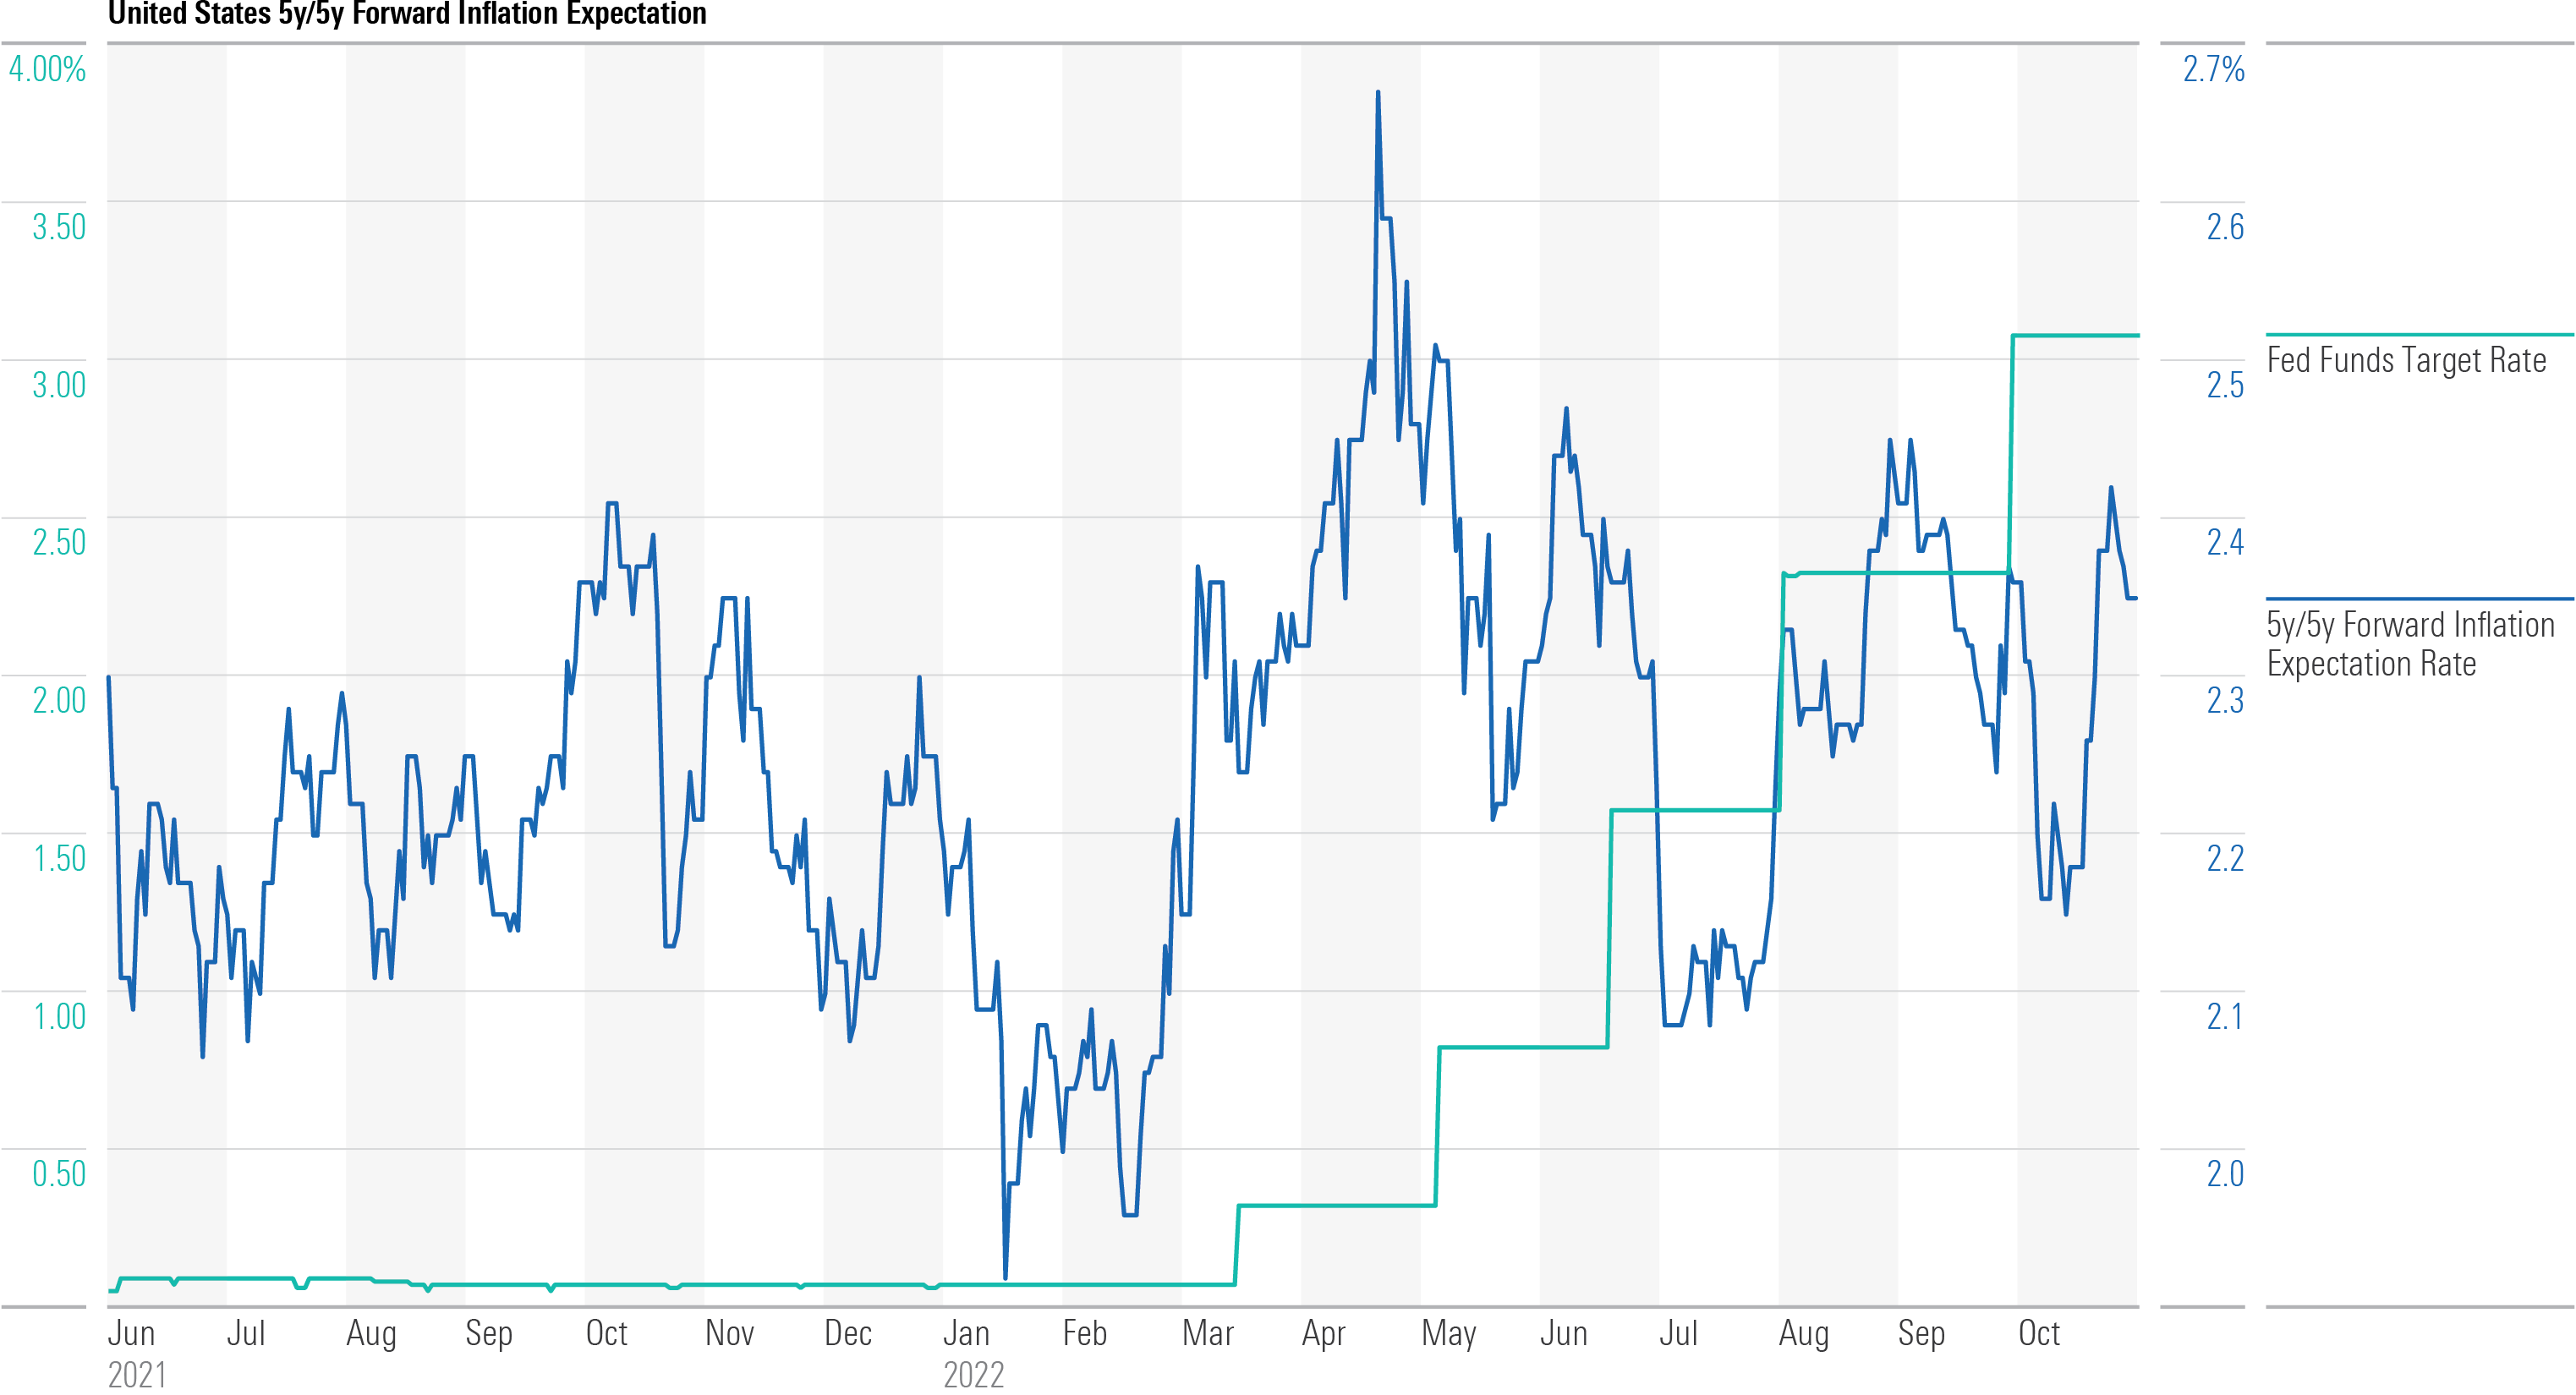
Source: MacroBond. Data as of Sept. 30, 2022.
Futures Markets Sharply Reprice Expectations for Policy Tightening Over the Next Nine Months
As of Oct. 13, the market was pricing a Fed funds rate of 4.85% by the end of June 2023, up from about 3.3% at the end of the second quarter—a roughly 150-basis-point increase. The repricing of Bank of England, or BoE, expectations has been even more pronounced, with the bank rate priced to reach 5.5% next June compared with previous expectations of around 3% (a 250-basis-point jump). The ECB expected rate was also revised to be higher but still remains the lowest of the three.
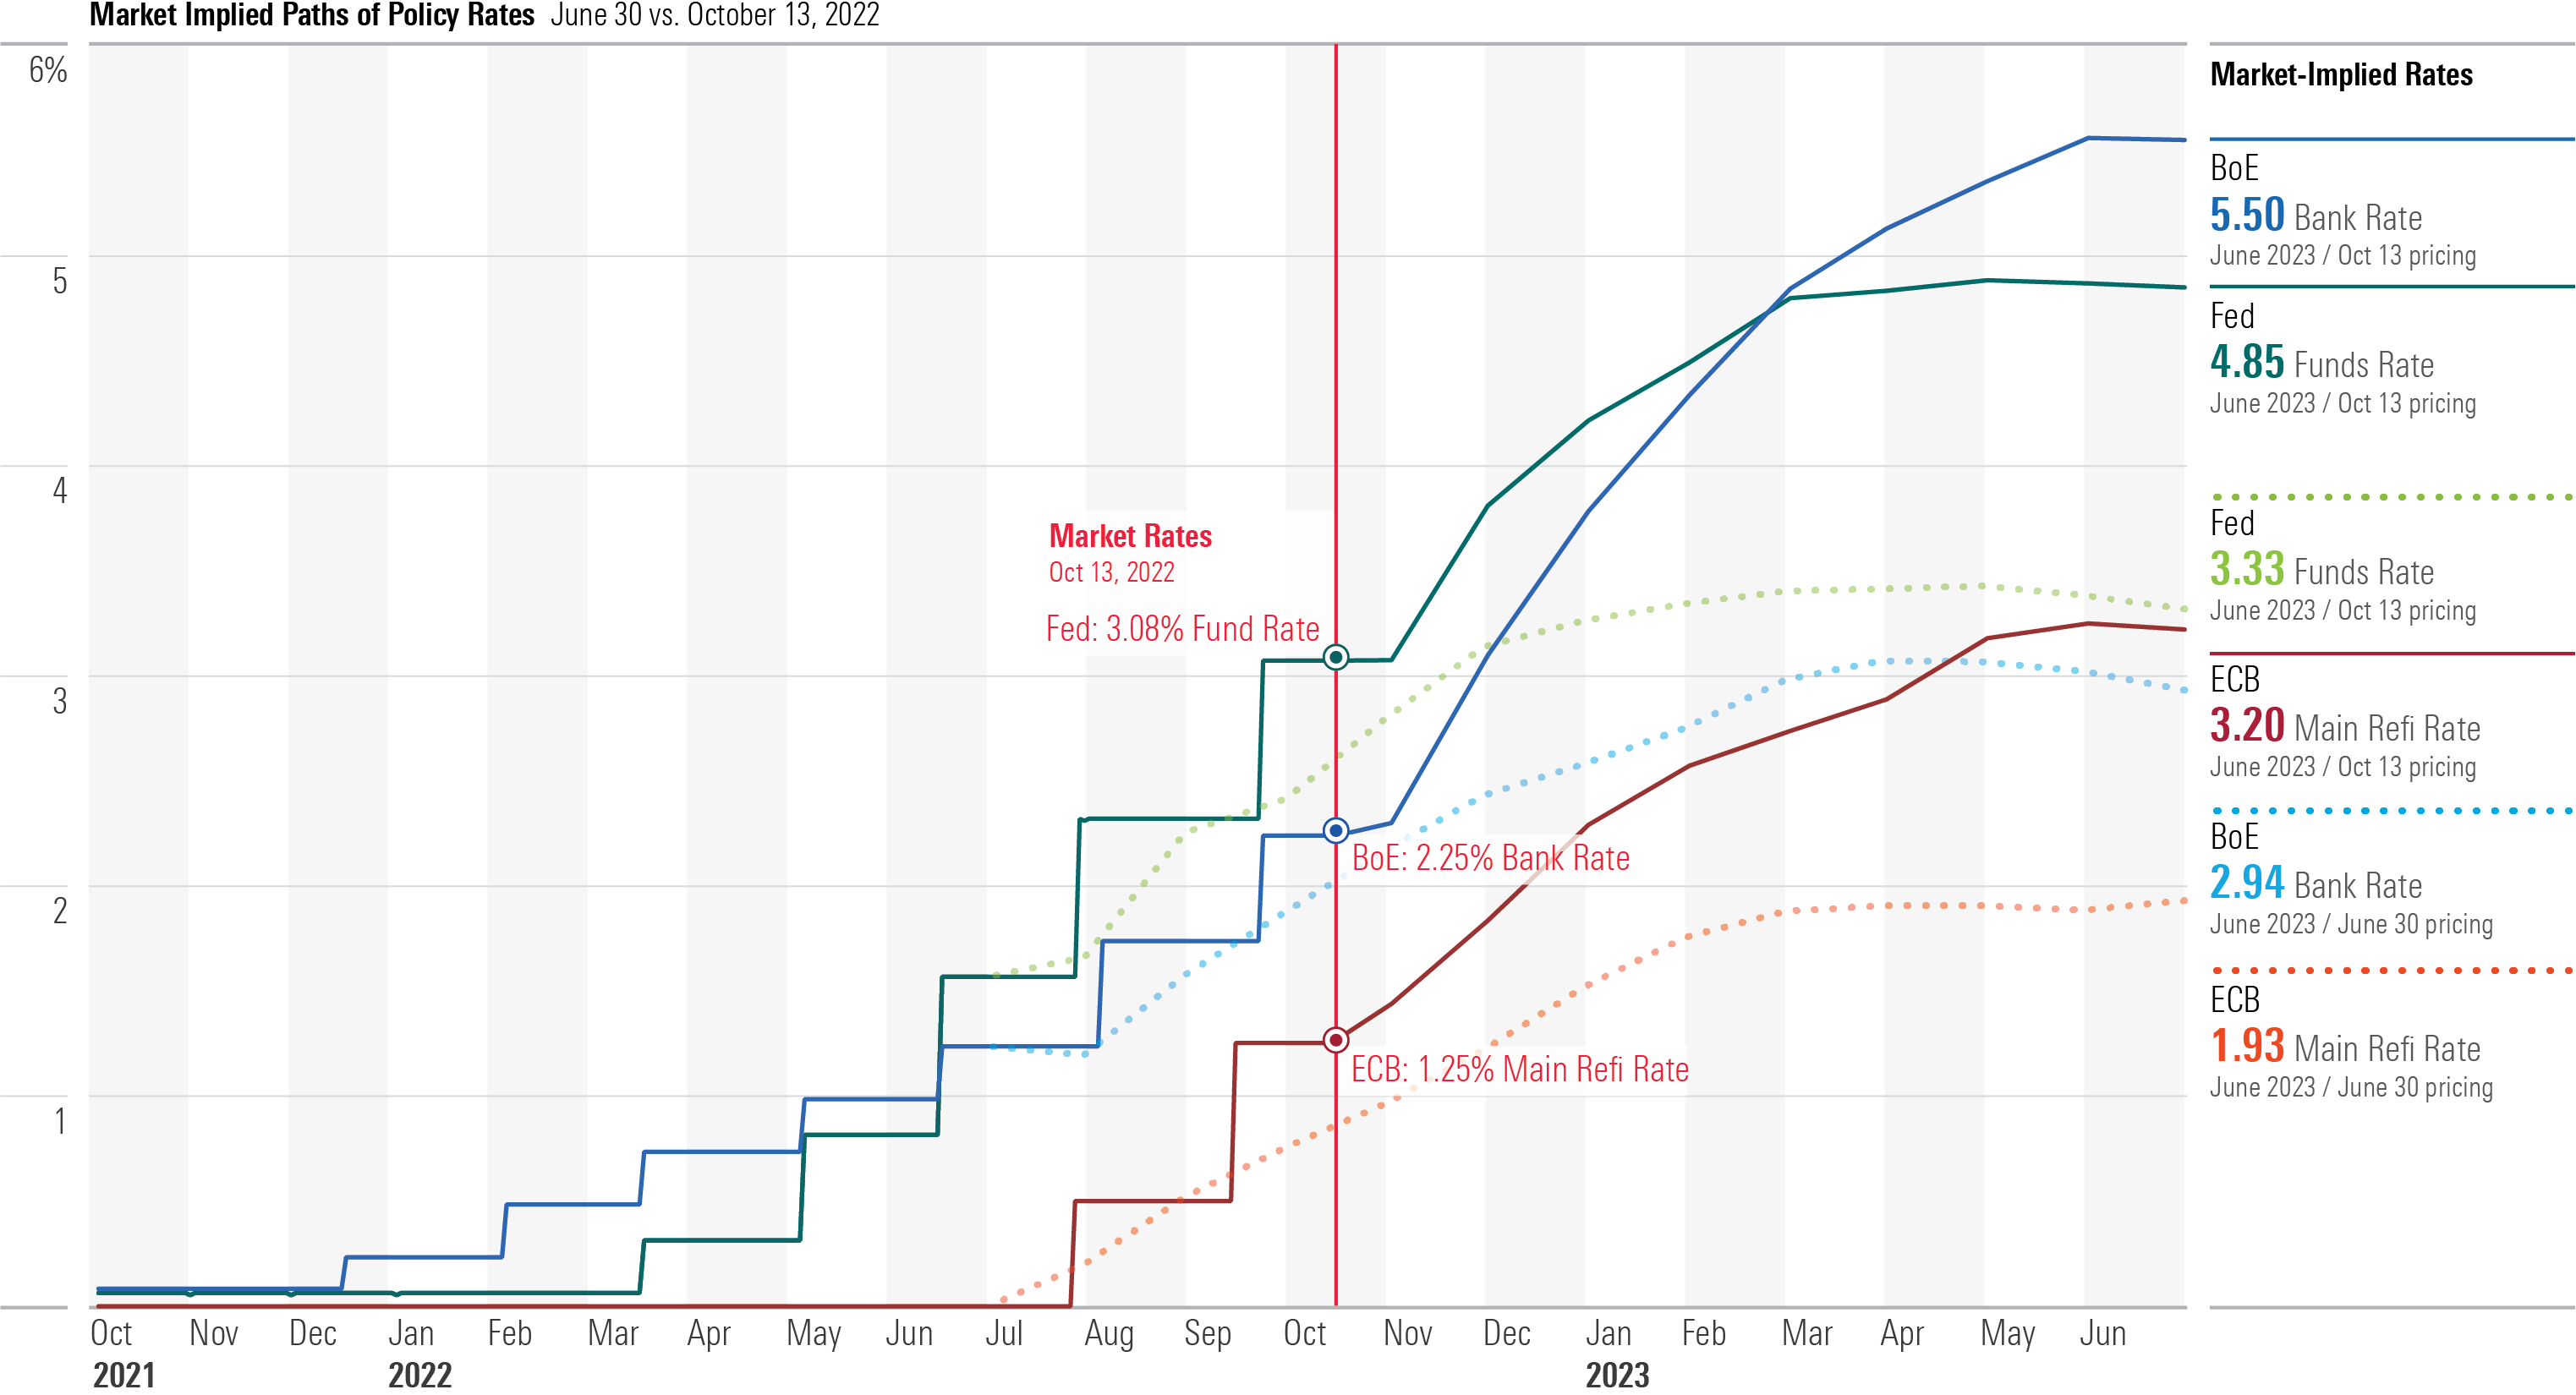
Source: MacroBond. Data as of Oct. 13, 2022.
Investors Turn to Government-Bond ETFs as Yields Rise
Investors have been pouring money into exchange-traded government-bond funds amid a rapid rise in interest rates. Since the beginning of 2021, the two-year yield has risen to 4.2% from 0.1% in September 2022. Although long-duration bond funds have taken in more flows for the year to date relative to their short-duration peers, September marked a sharp reversal in this trend.
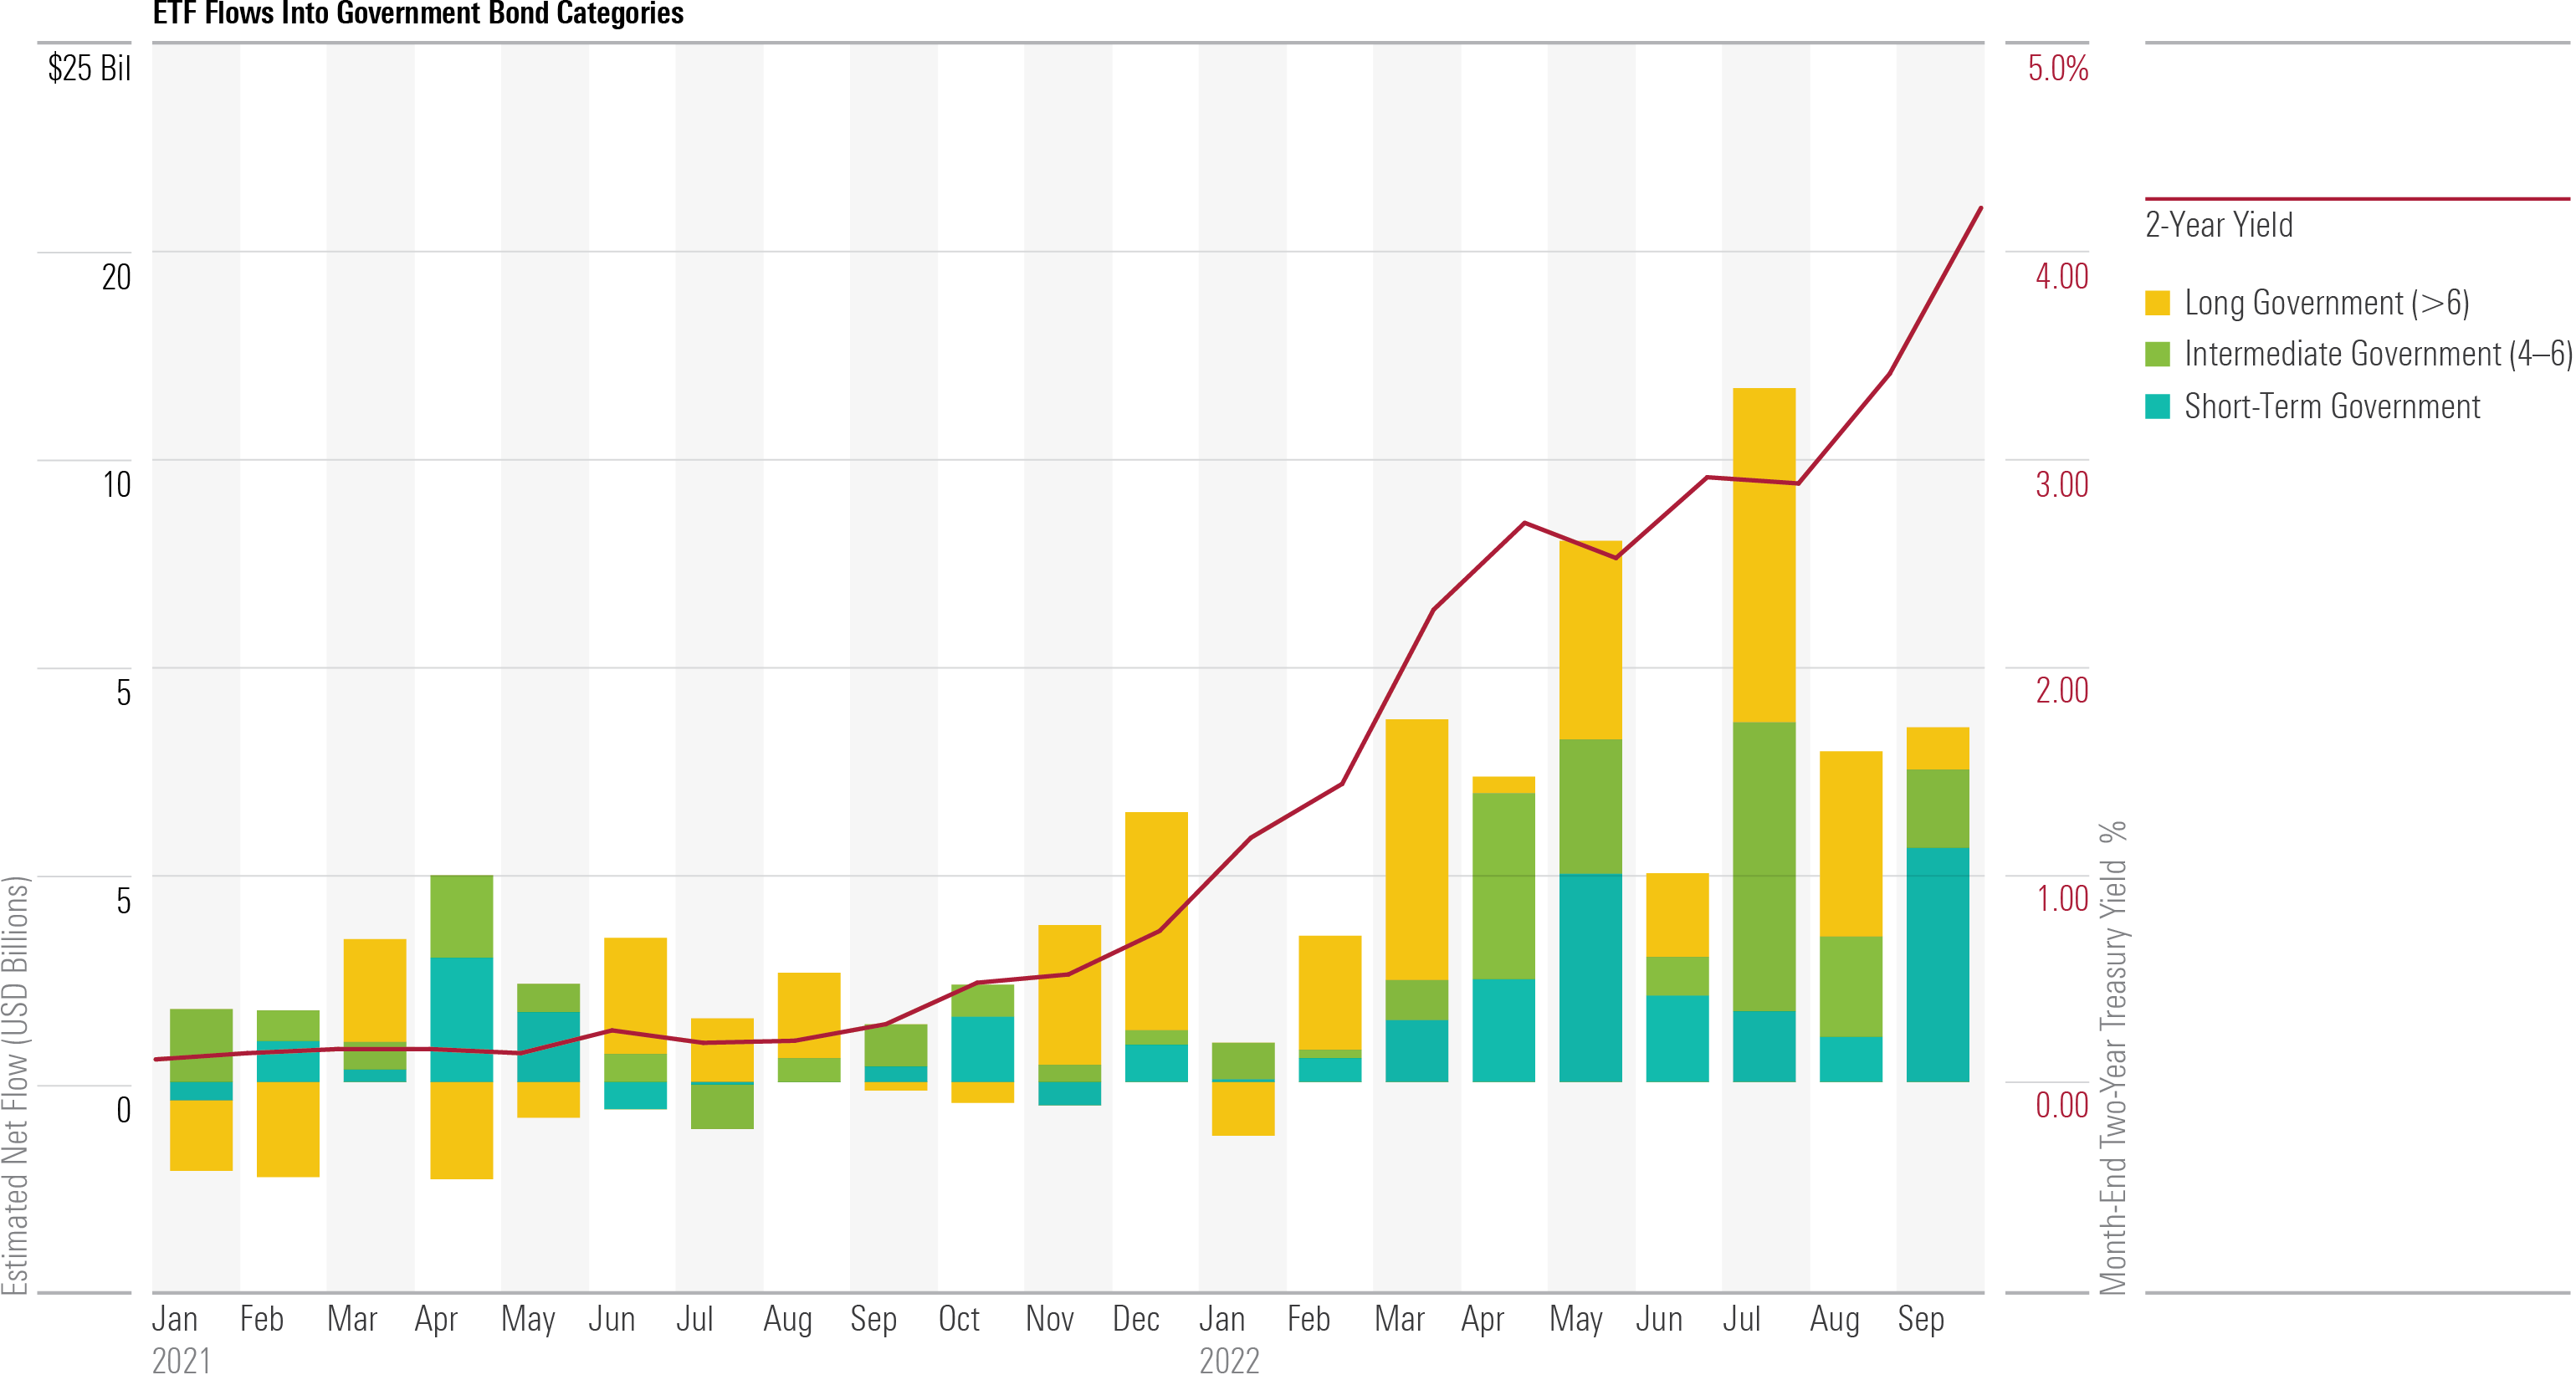
Source: Morningstar Direct, U.S. Treasury. Data as of Sept. 30, 2022.
Private Investors Not Deterred
The pandemic barely dented fundraising momentum across private equity and venture capital funds. The pace has kept up in 2022 so far. Much of these commitments come from recycling 2021′s record distributions, and those new fund closings will add to the record dry powder levels estimated at the start of 2022. Less certain are fund net asset values. Limited partners should be asking if values reported will be realized.
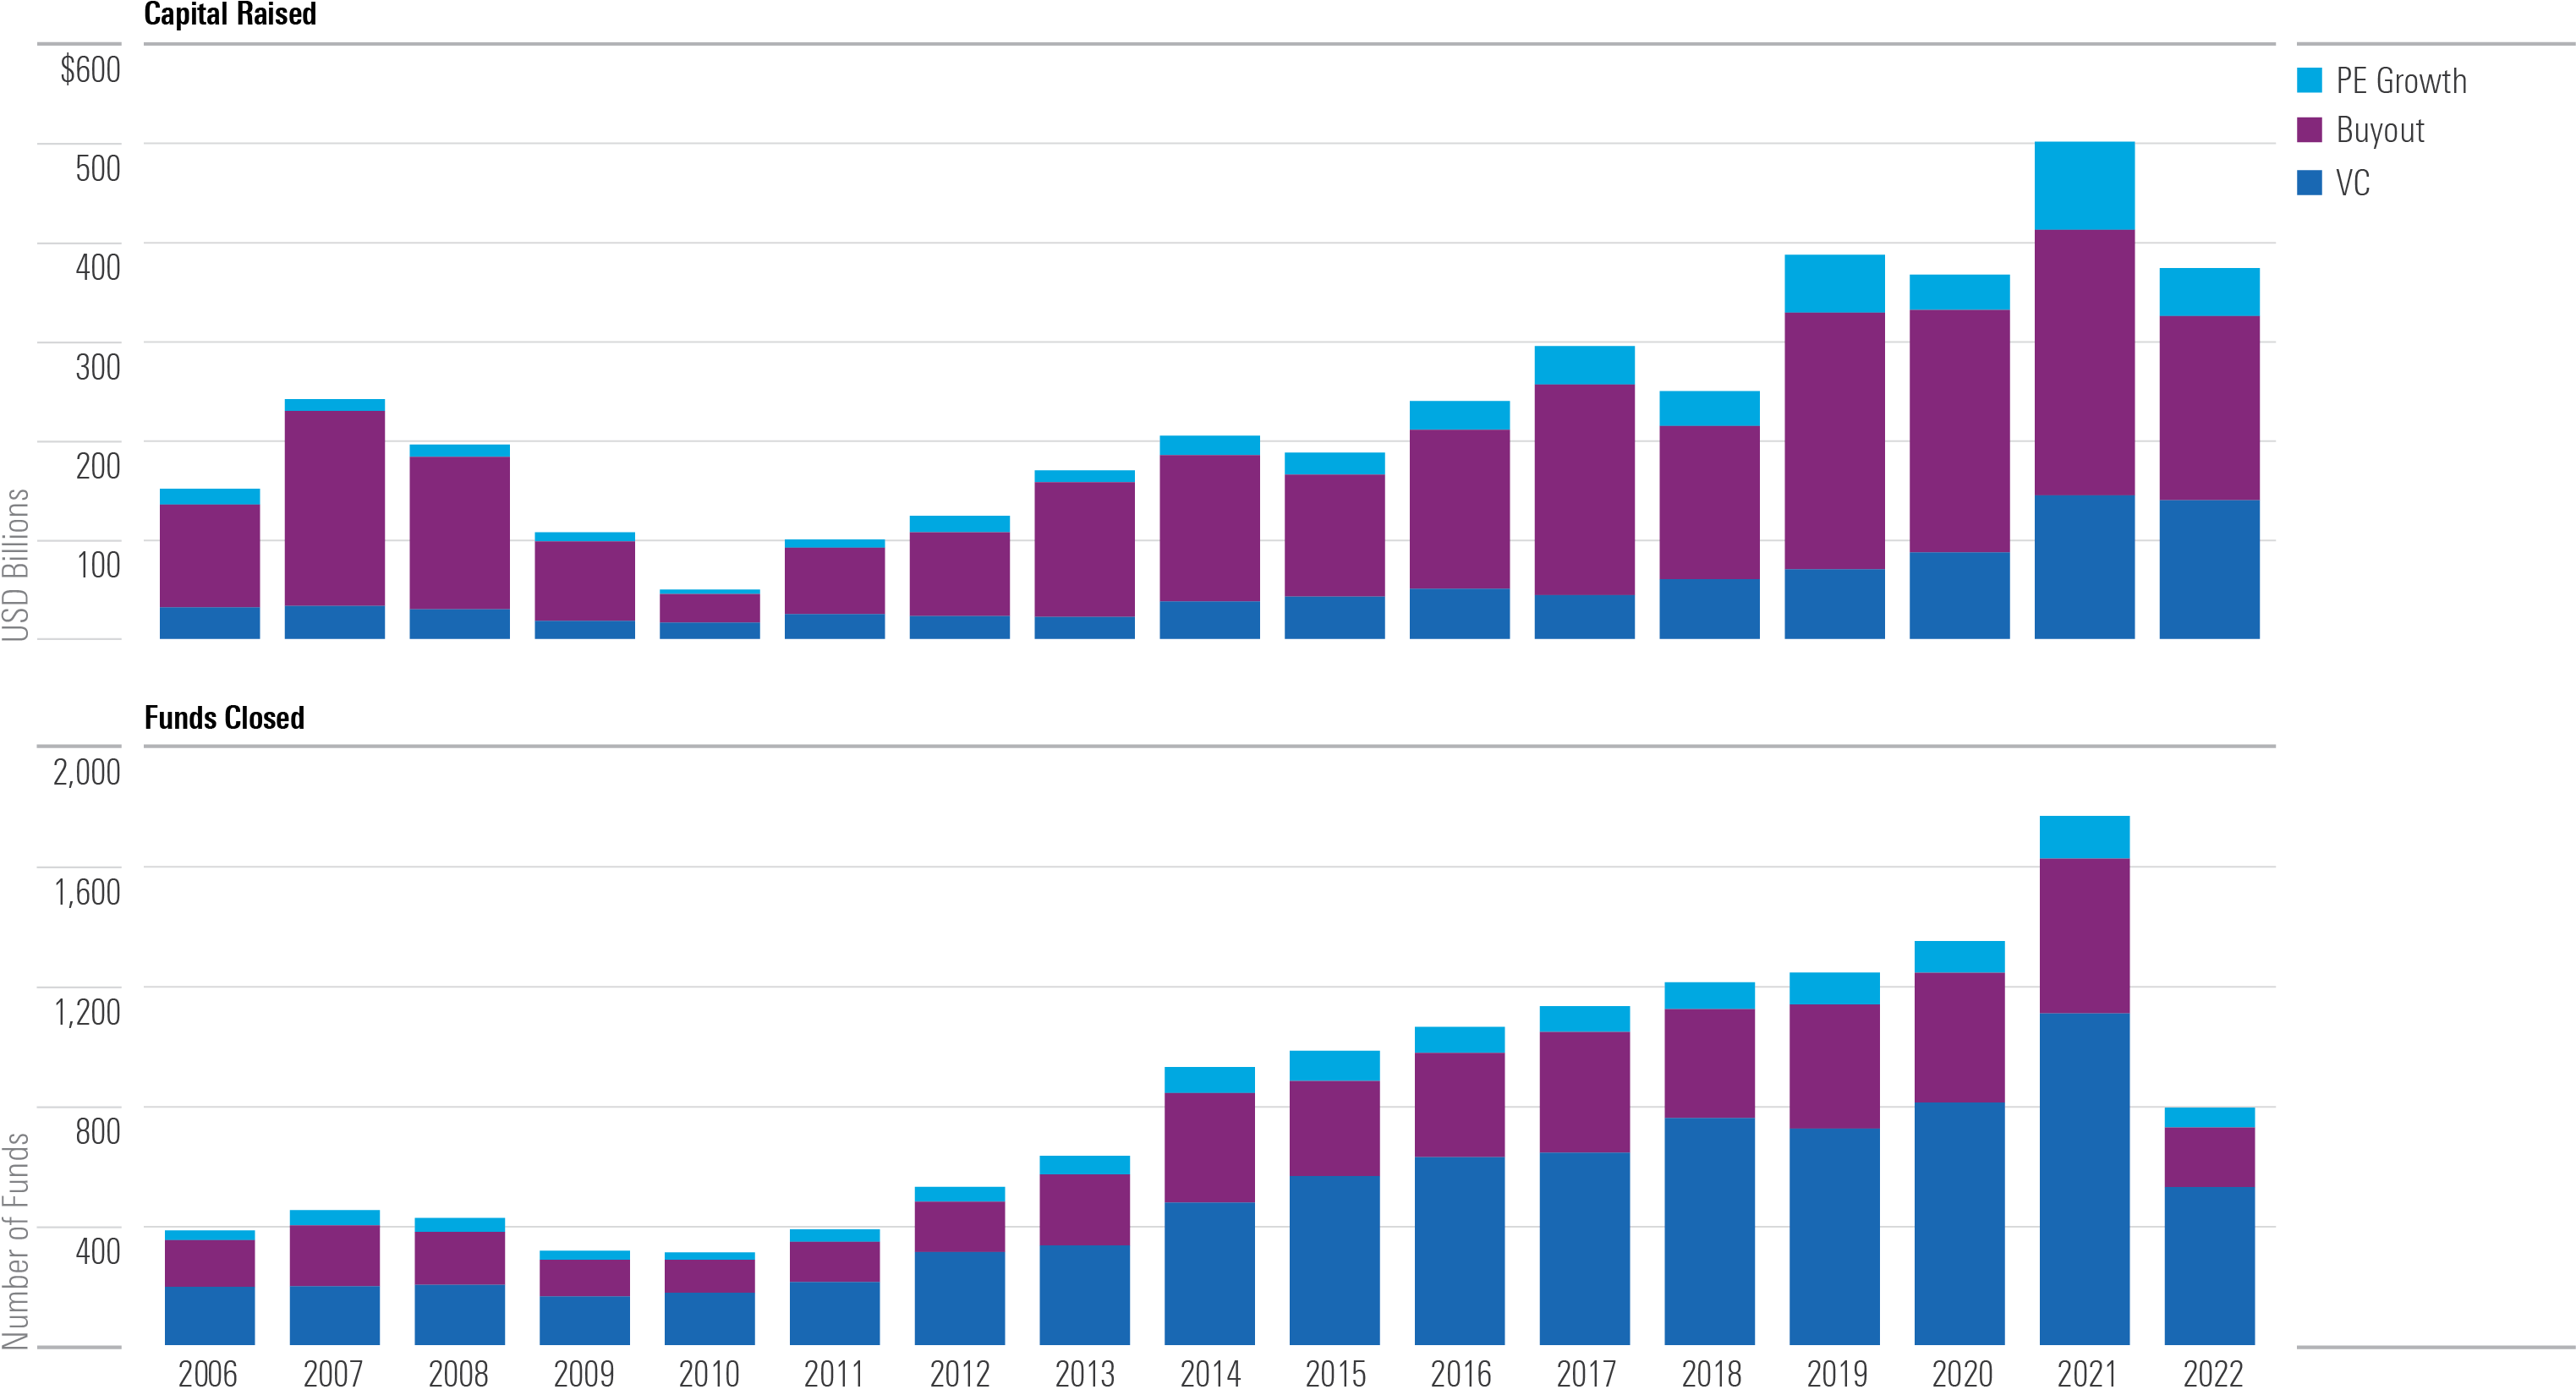
Source: Pitchbook. Data as of Sept. 30, 2022.
U.S. Housing Market Faces Affordability Headwinds; Delinquencies Remain Subdued
The ratio of principal and interest payments to disposable income, a measure of housing (un)affordability, returned to 2007 levels in the third quarter of 2022. Deteriorating affordability amid higher rates was a contributing factor in the subprime crisis of the late 2000s, but most housing market observers do not expect the current environment to trigger a wave of mortgage defaults. After a sharp jump at the height of the pandemic, delinquencies are currently at a 40-year low.
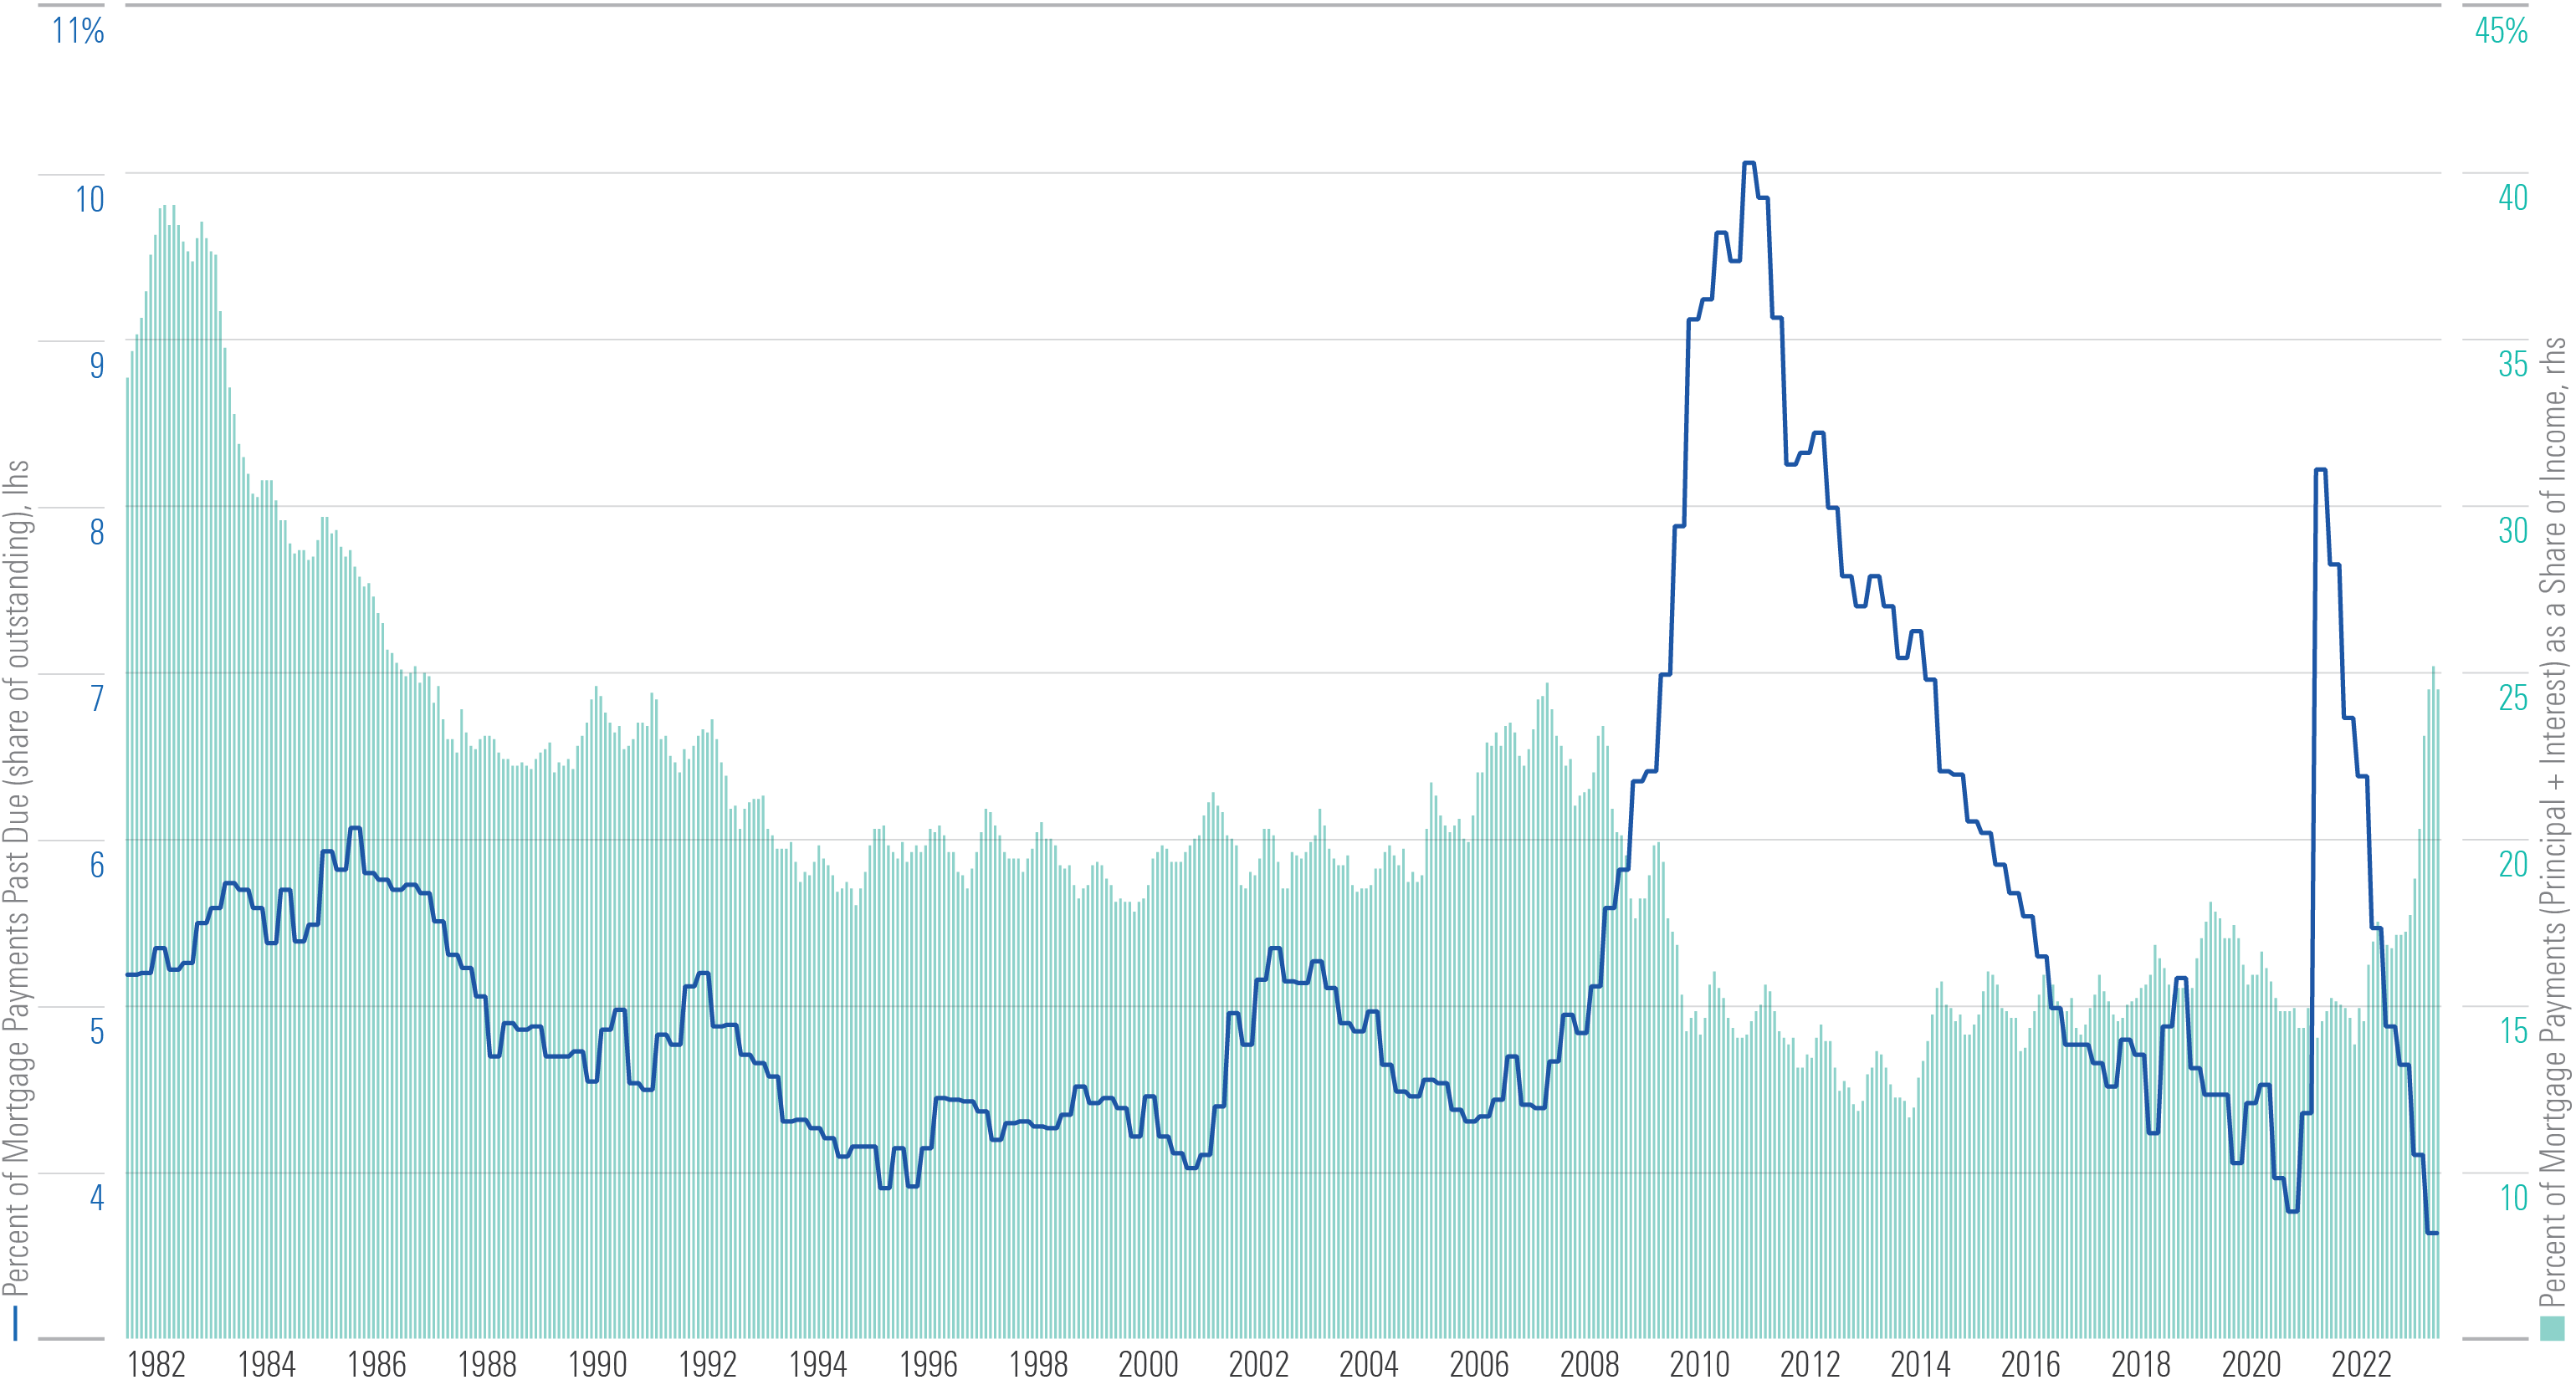
Source: Source: National Association of Realtors, Mortgage Bankers Association. Data as of Sept. 30, 2022.
International Stock Market Performance
Global stock market losses continued in the third quarter, with only a few lonely outliers. As noted in the Q2 2022 Markets Observer, improving fundamentals and a boost from commodities this year facilitated Latin America’s recent positive returns.
Eastern Europe’s struggles continued as the prolonged conflict between Russia and Ukraine dragged down the region’s equities by almost 80% in the last year. Foreign returns in U.S. dollars looked even worse across the board given the currency’s strength.
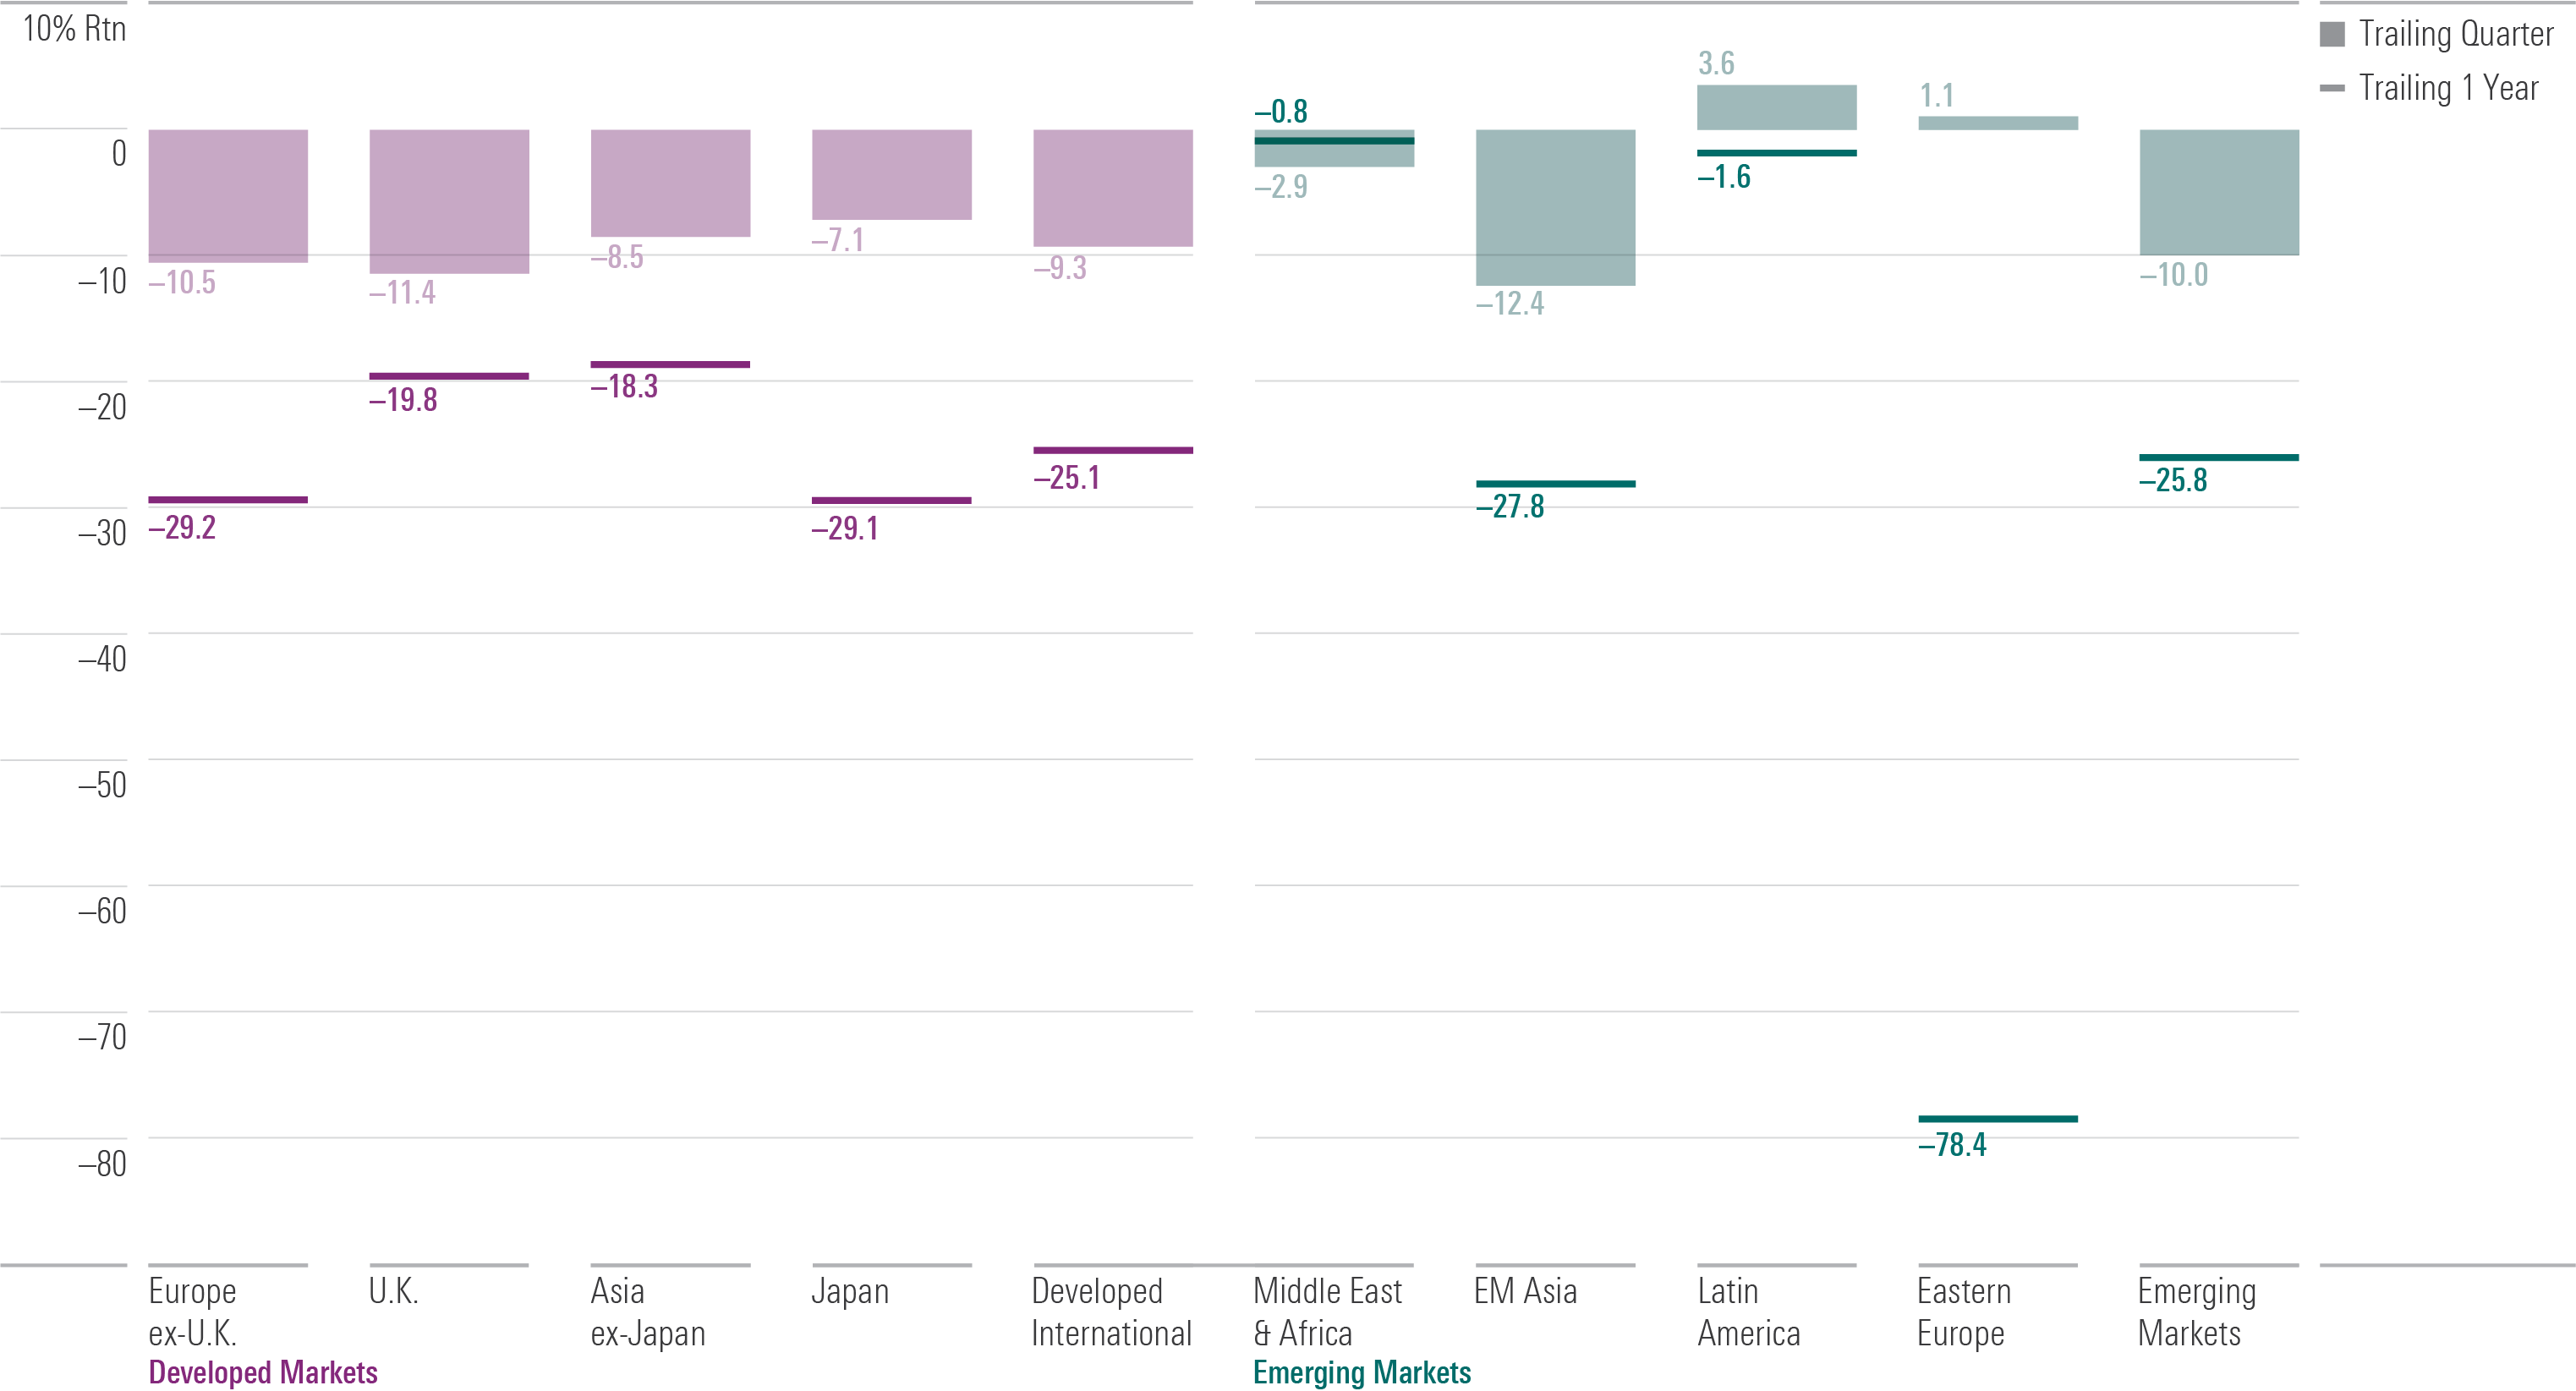
Source: Morningstar Indexes. All returns are calculated in U.S. dollars. Data as of Sept. 30, 2022.
Are Earnings Margins of Global Public Equity Squeezed Yet?
Surging inflation coupled with rate hikes is considered to be doubly detrimental to corporate earnings margins, because rising interest rates increase financing cost immediately while revenue is relatively slow to respond. However, compared with the beginning of the year, earnings margins actually expanded in many countries in Latin America and the Middle East, such as Colombia, Chile, and United Arab Emirates.
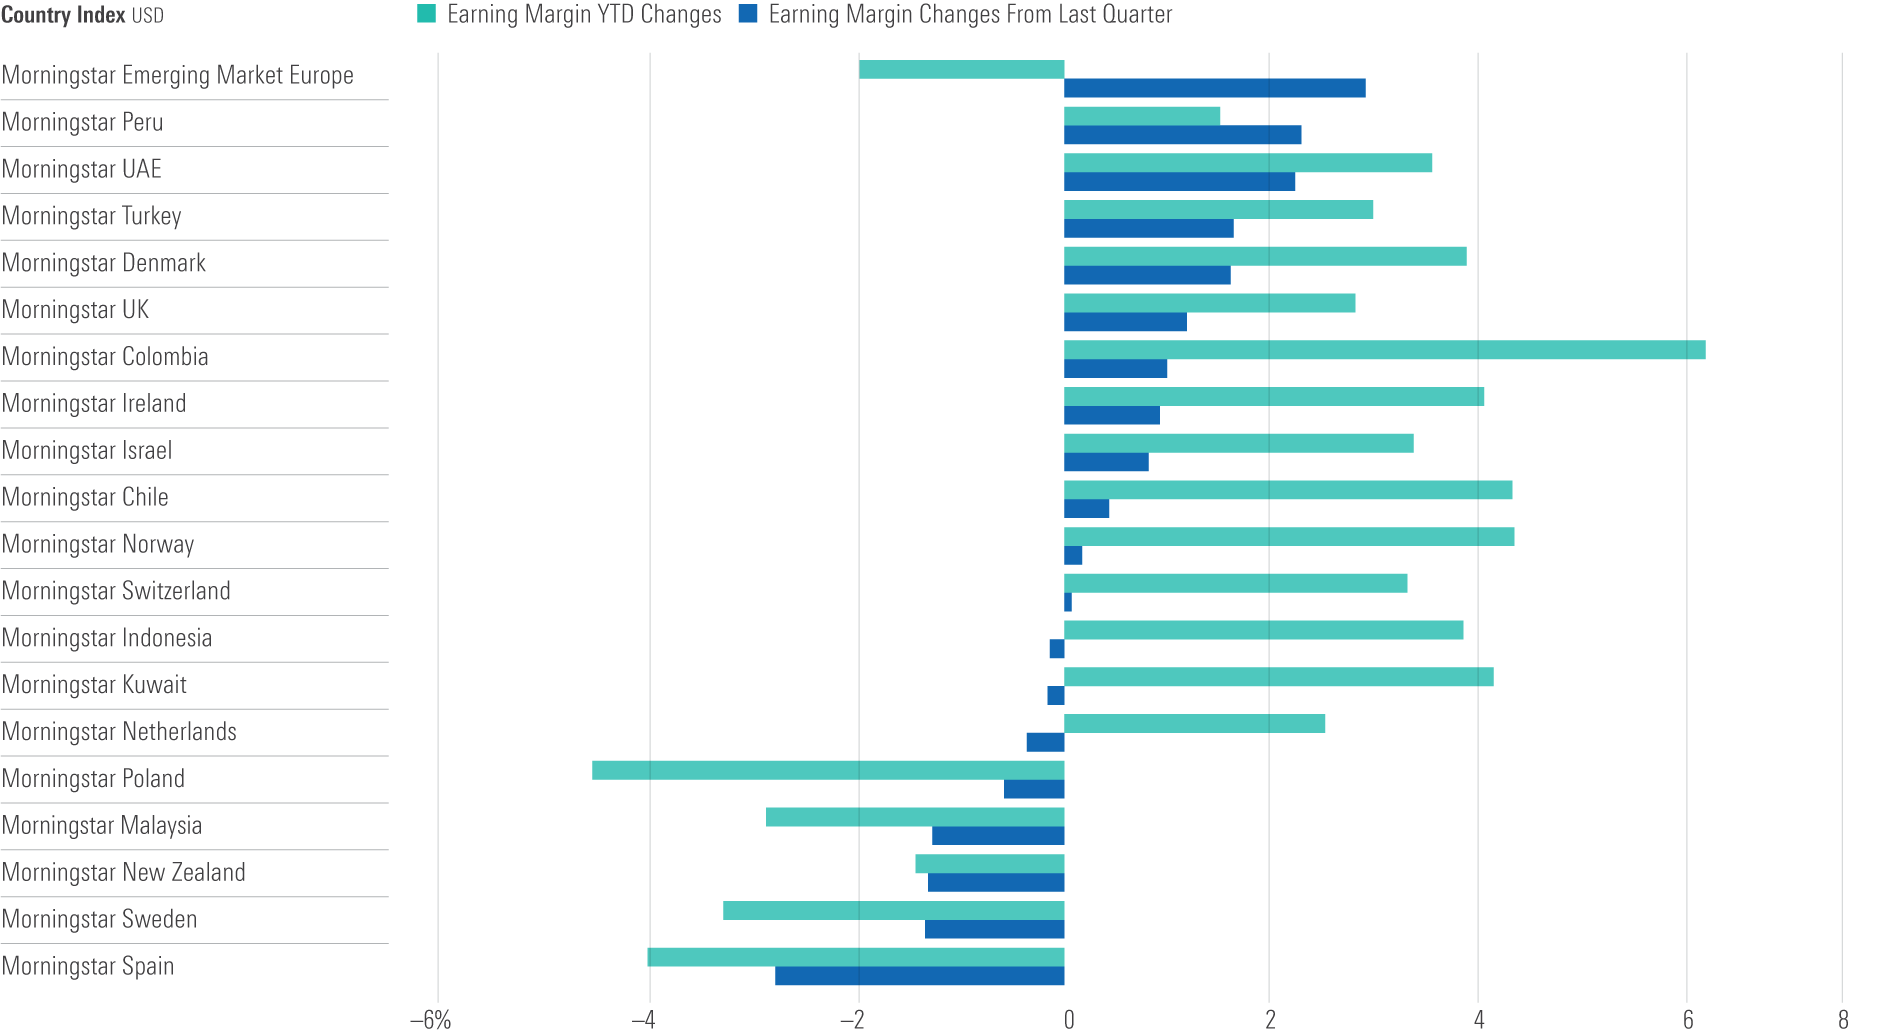
Source: Morningstar Data, Data as of Sept. 30, 2022.
The author or authors do not own shares in any securities mentioned in this article. Find out about Morningstar’s editorial policies.
/cloudfront-us-east-1.images.arcpublishing.com/morningstar/KIQMCCUZ2RGWZKSCKM2Z4ZULFU.png)
/cloudfront-us-east-1.images.arcpublishing.com/morningstar/MGEDEFIRZJFHTAFNLDHG46SDXI.png)
/cloudfront-us-east-1.images.arcpublishing.com/morningstar/6HLXVGQ6DFCQDC3WHBZC6TLS2U.png)
:quality(80)/s3.amazonaws.com/arc-authors/morningstar/a659ddb3-1d6f-4405-a4c4-9c325330c2da.jpg)