
The Advantage of Low Stock Market Expectations
Small caps are unloved, but that could make them a good opportunity for investors.


The market rarely tries to discern “good” or “bad”; rather, its primary focus tends to be “better” or “worse.”
Recent financial results from FedEx FDX and Lululemon LULU illustrate this idea well.
Last month, FedEx reported that sales declined by 2% versus the prior year, making it six consecutive quarters of sales declines. Lululemon released results the same day and reported sales growth of 16%.
How did the stocks react? Probably not the way you would expect.
Stock Price Reaction After Earnings Announcement
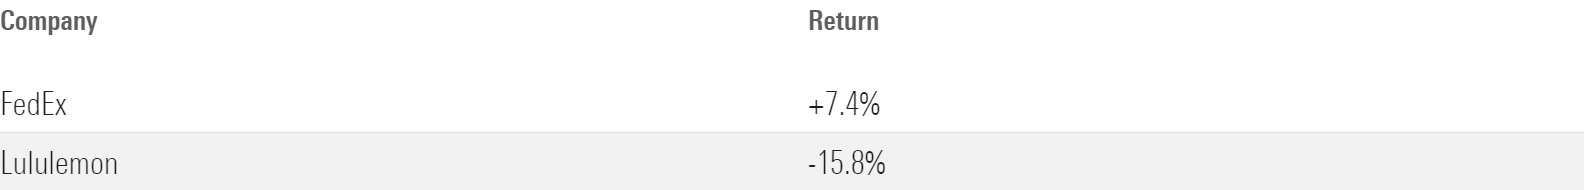
FedEx shares were up more than 7% on the day, while Lululemon shares fell nearly 16%.
The lesson? Starting points matter.
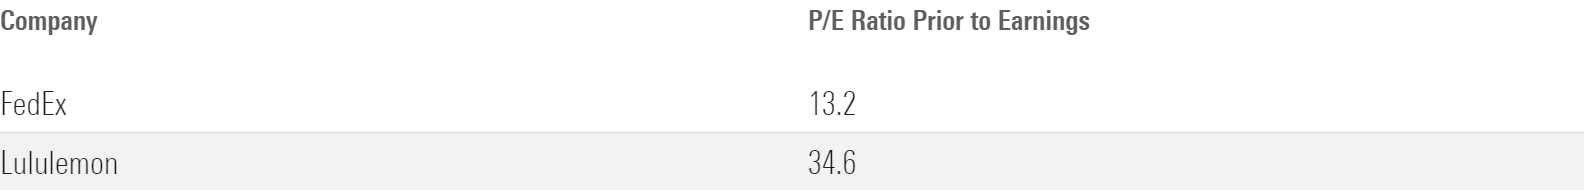
FedEx traded at 13.2 times earnings prior to those results, while Lululemon traded at 34.6 times earnings.
Forward Price/Earnings Ratio Prior to Earnings
The market’s expectations for each company were very different. Lululemon’s higher valuation came with greater expectations, and when they were not met, the market punished them.
Put simply, FedEx was able to step over a two-foot bar, while Lululemon bumped its knee trying to clear 10 feet.
Investment researcher Michael Mauboussin has written extensively on this concept, once mentioning:
“Perhaps the single greatest error in the investment business is a failure to distinguish between the knowledge of a company’s fundamentals and the expectations implied by the market price.”
This idea forms the beating heart of Morningstar Wealth’s investment philosophy: trying to identify gaps between price and value across stocks, sectors, and asset classes.
Assessing where expectations might be highest prompts a check-in on the “Magnificent Seven” (Alphabet GOOGL, Amazon.com AMZN, Apple AAPL, Meta Platforms META, Microsoft MSFT, Nvidia NVDA, and Tesla TSLA).
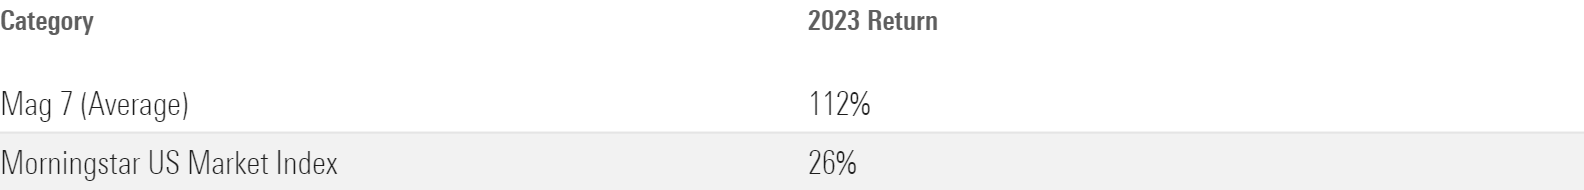
Magnificent Seven Update
The Magnificent Seven defied gravity last year. Or at least something close to it. Collectively, that group of stocks was up 112% last year, on average, while the Morningstar US Market Index was only up 26%.
2023 Magnificent Seven Performance Recap
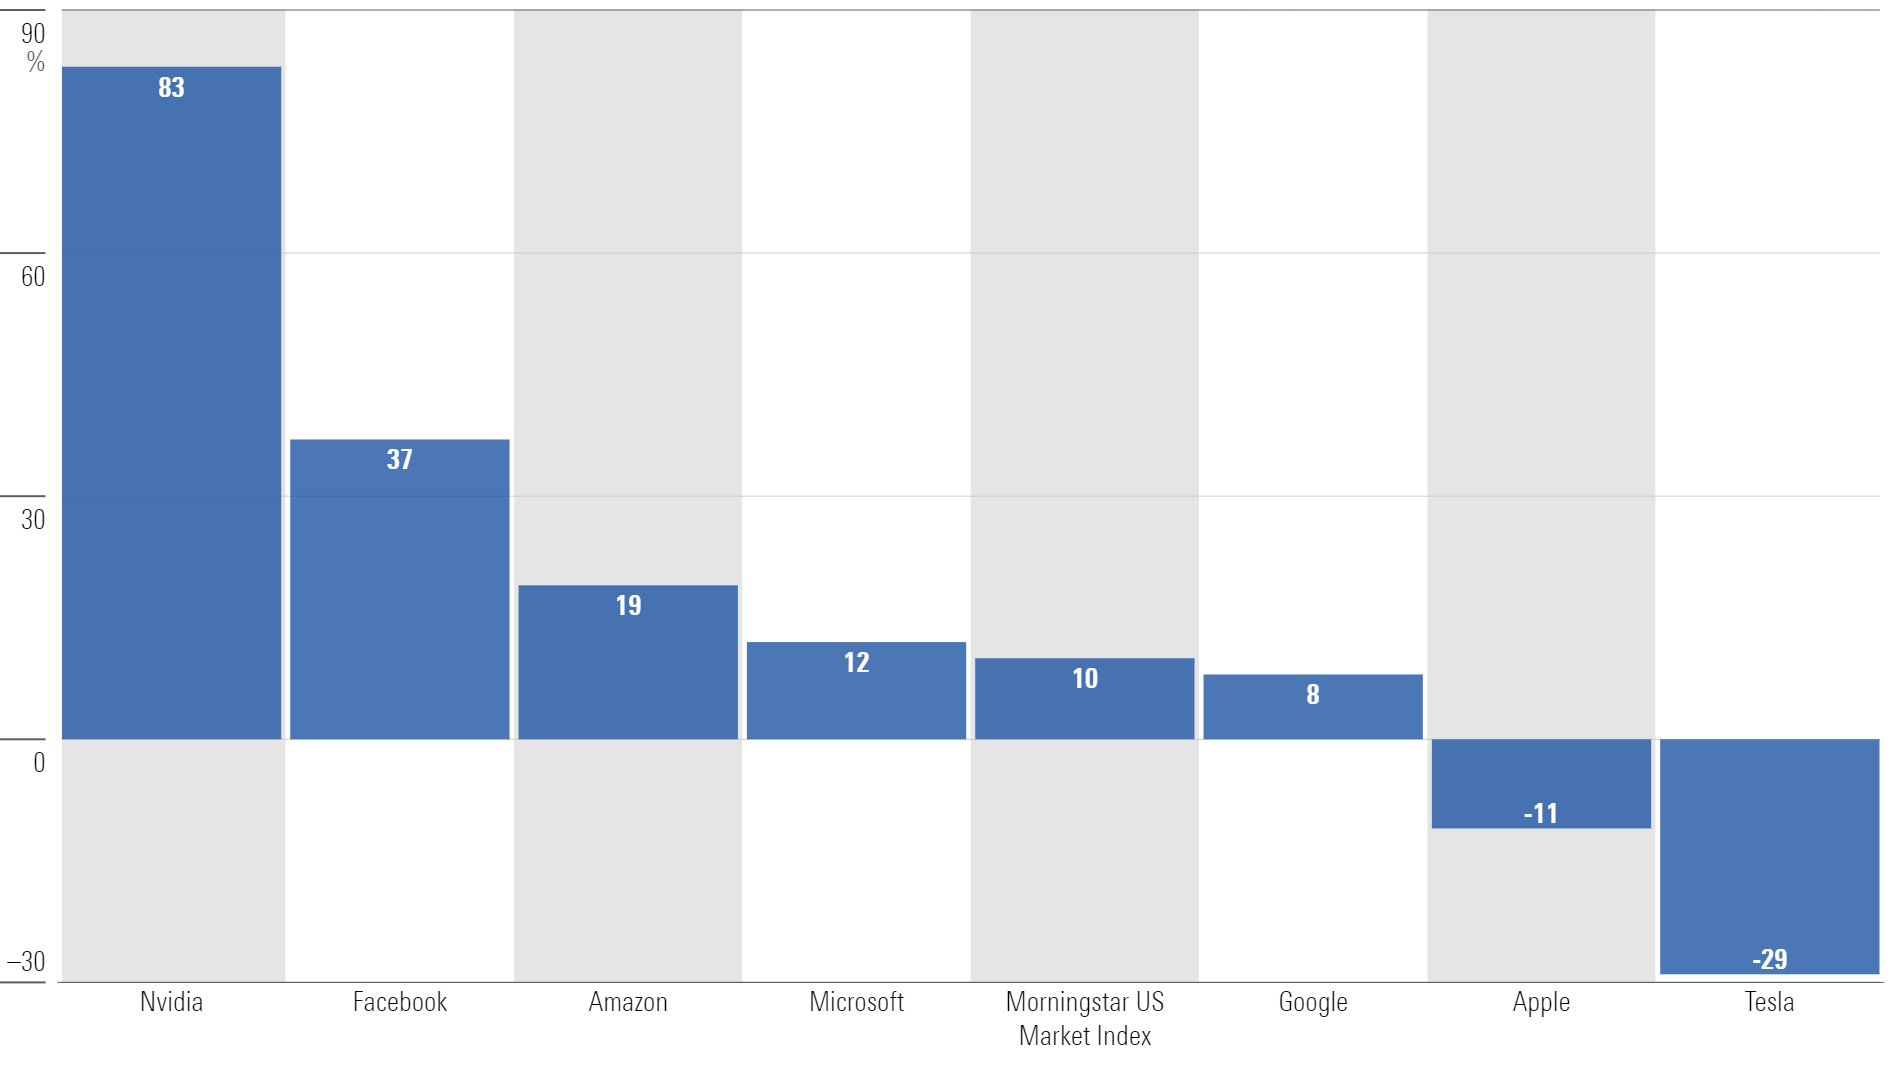
Needless to say, the Magnificent Seven was the predominant source of 2023′s market returns. But through one quarter this year, the results are less pronounced. While Nvidia’s performance continues to be relentless—up 82% in the quarter—subtle cracks are starting to emerge across the rest.
For example, Tesla was the worst performing stock in the entire large-cap index during the quarter, down 29%. Even Boeing—a company making headlines every day for the wrong reasons—was able to edge it out.
Apple was also negative for the quarter, down 11%. And Alphabet, who returned 8%, trailed the index’s quarterly return.
First-Quarter 2024 Returns
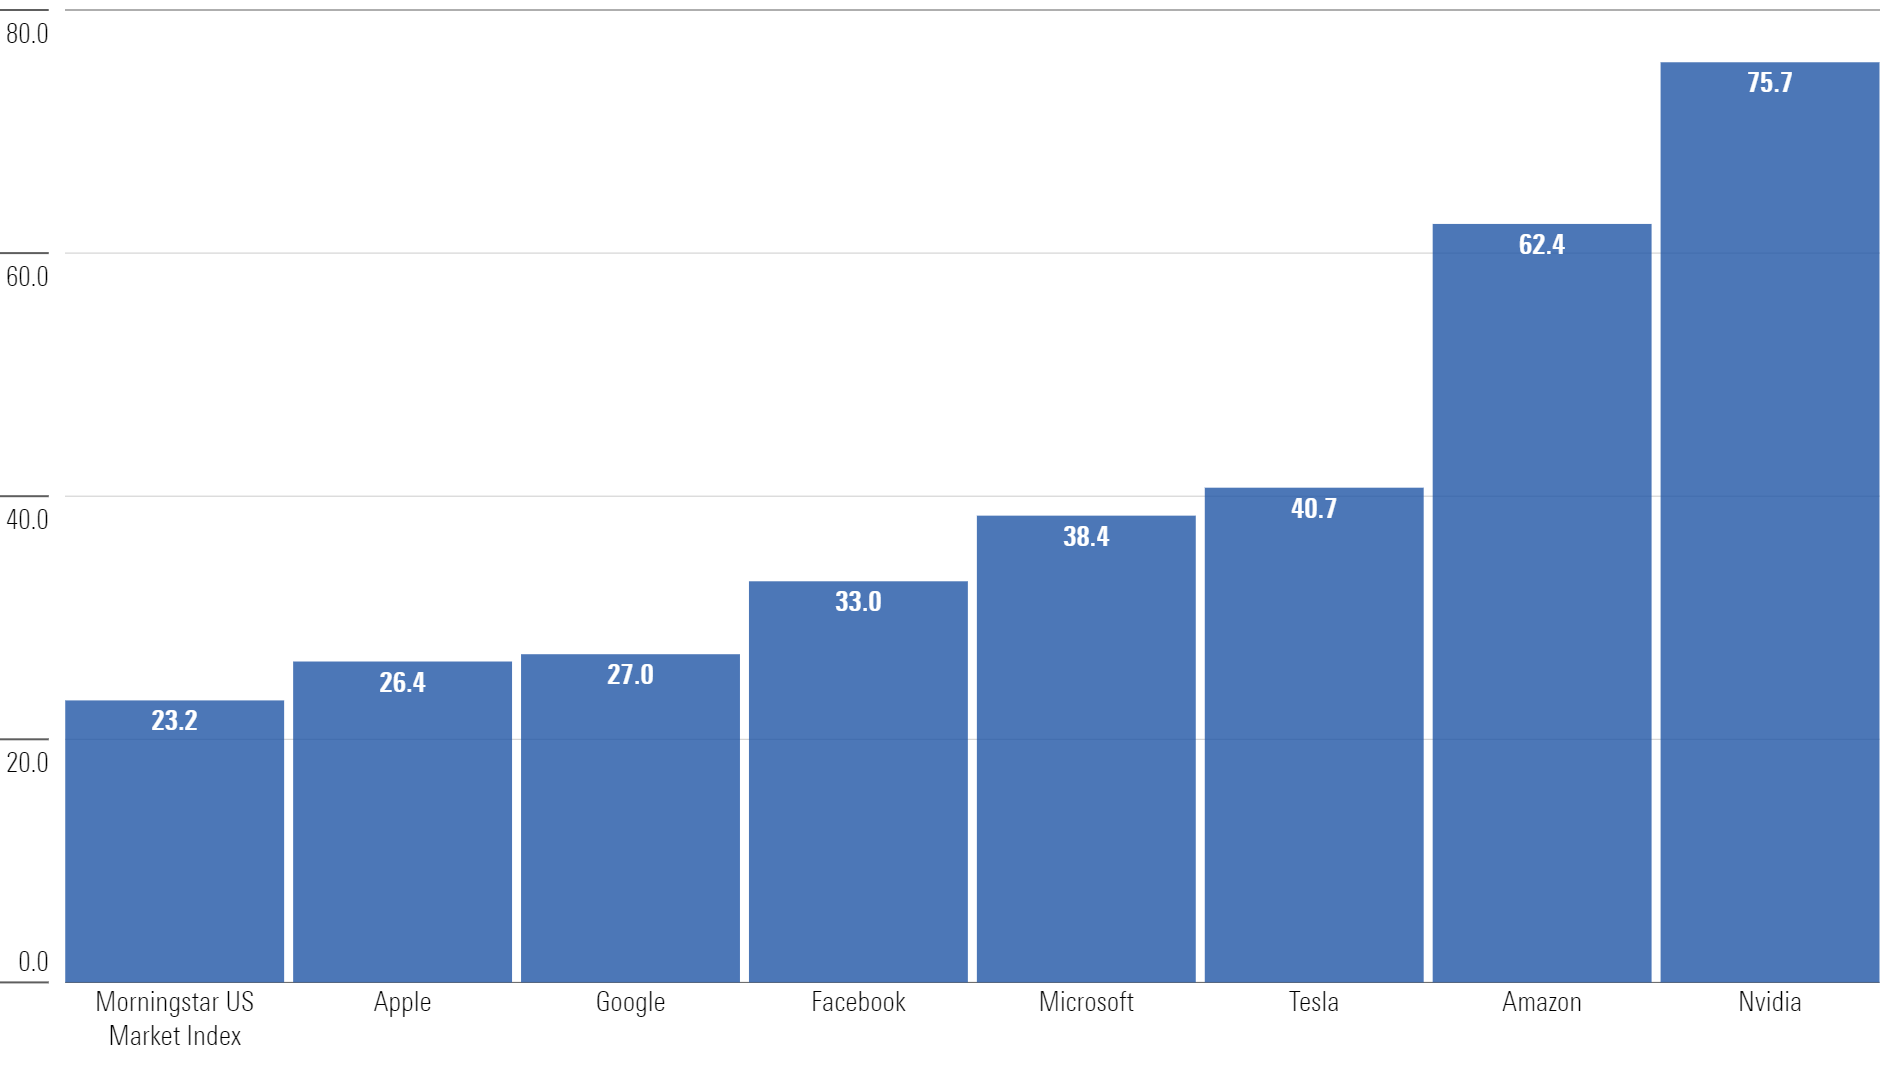
Across the group, prices remain elevated—all seven have valuations above the index.
Valuations (Current Price/Earnings Ratio)
While these companies command the investment world’s attention, it might be prudent to explore diversification opportunities elsewhere.
Morningstar Senior Portfolio Manager John Owens recently wrote:
“While the ‘Magnificent Seven’ get the lion’s share of media coverage and attention, we see more opportunities outside of this group, including stocks of companies which get scant attention from the press and Wall Street.”
One of the areas that gets less attention—and expectations are likely lower—might be small caps.
Small Caps and the Three U’s
Contrarian investment decisions typically follow the path of “Three U’s”: unloved, underperforming, and undervalued.
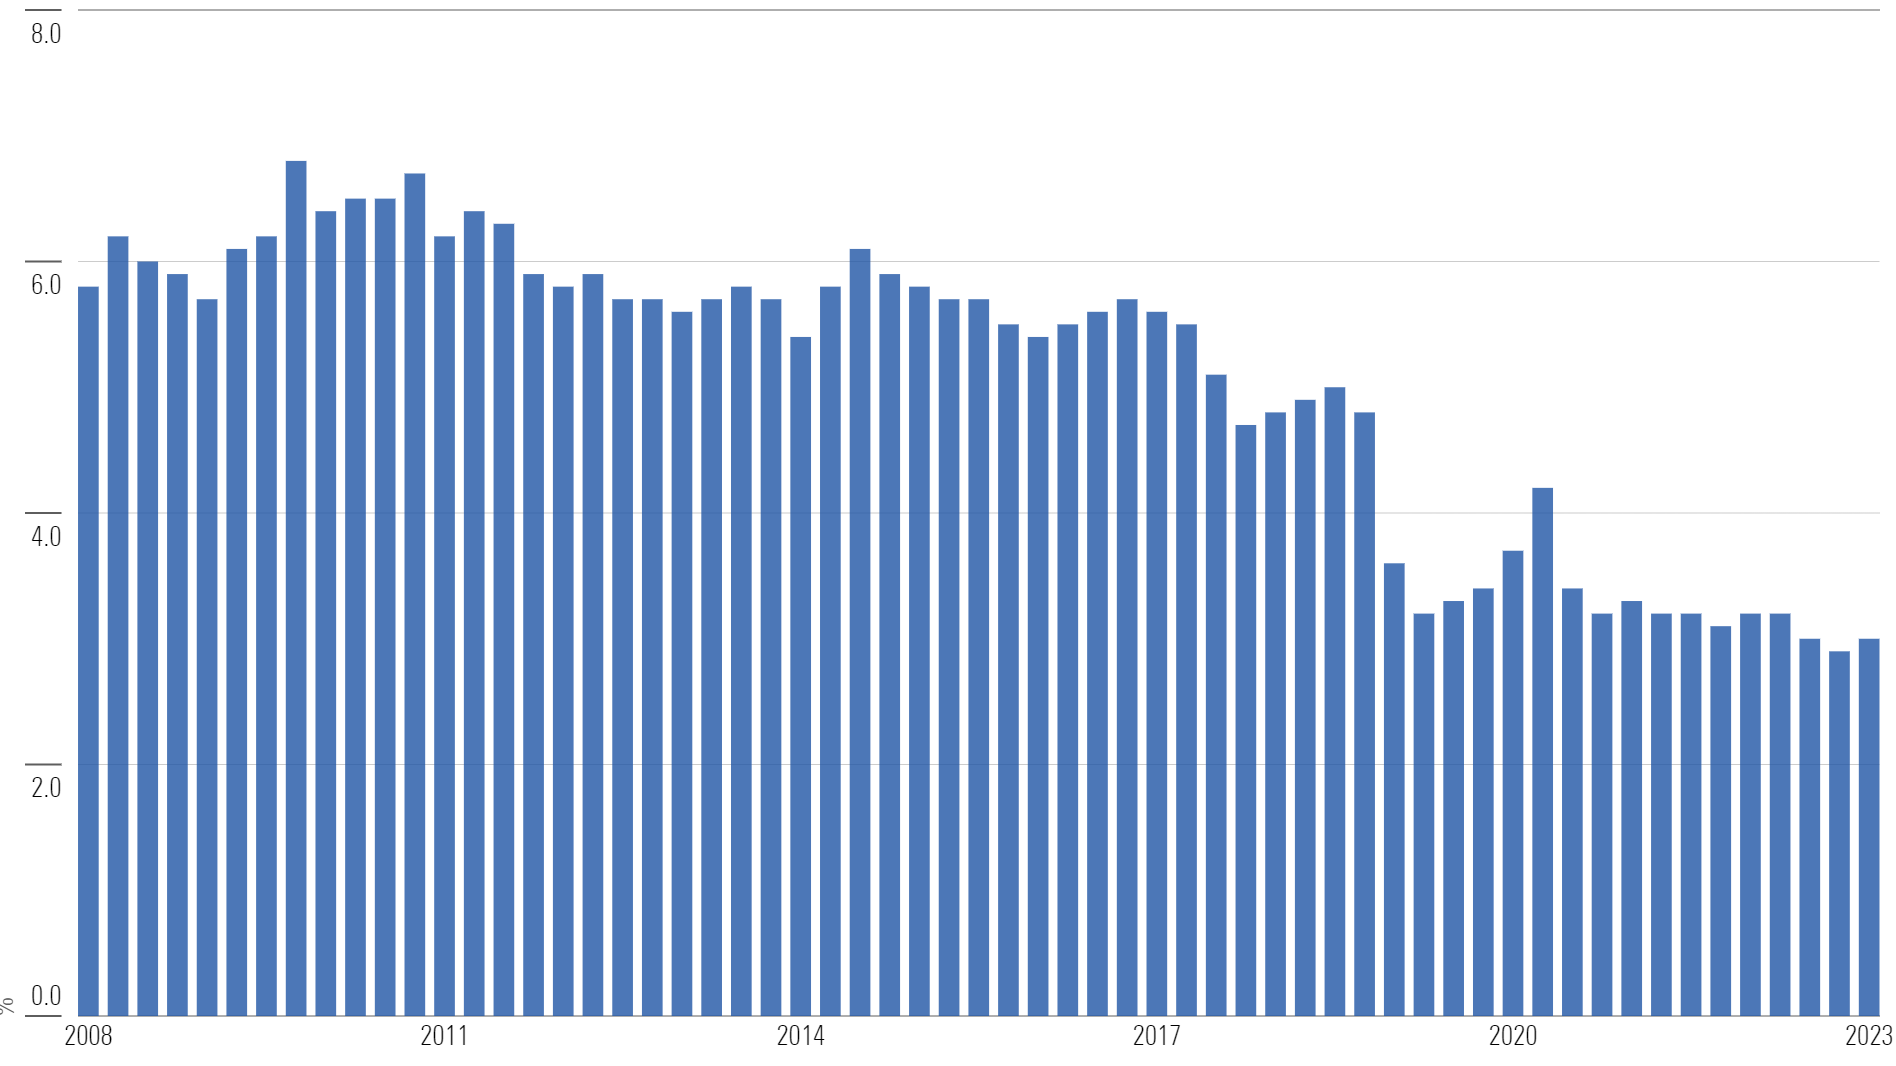
Small caps are certainly unloved—interest from active managers appears to be in a perpetual state of decline. Per Bank of America research, small caps represent only 3% of active portfolios, which is half the weight versus a decade ago.
Small-Cap Weighting as % of Total Holdings for Multi-Cap Core Managers
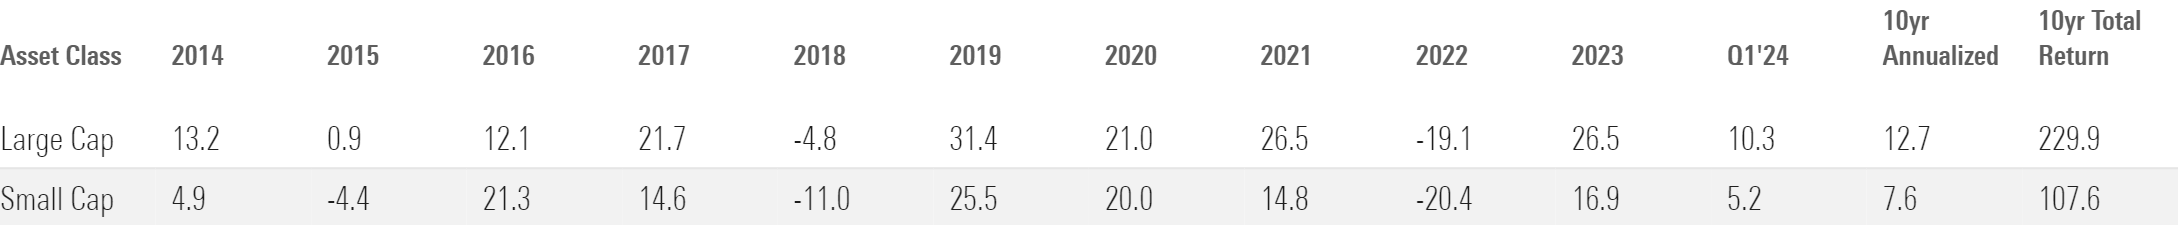
The underperformance has been well documented. Large caps have trounced small caps, beating them in nine of the last 10 calendar years. Over the last 10 years, the total return for large caps beats small caps by greater than 120%.
Small-Cap vs. Large-Cap Performance Comparison
When you combine apathy and poor returns, it creates a potent cocktail for an asset to become undervalued.
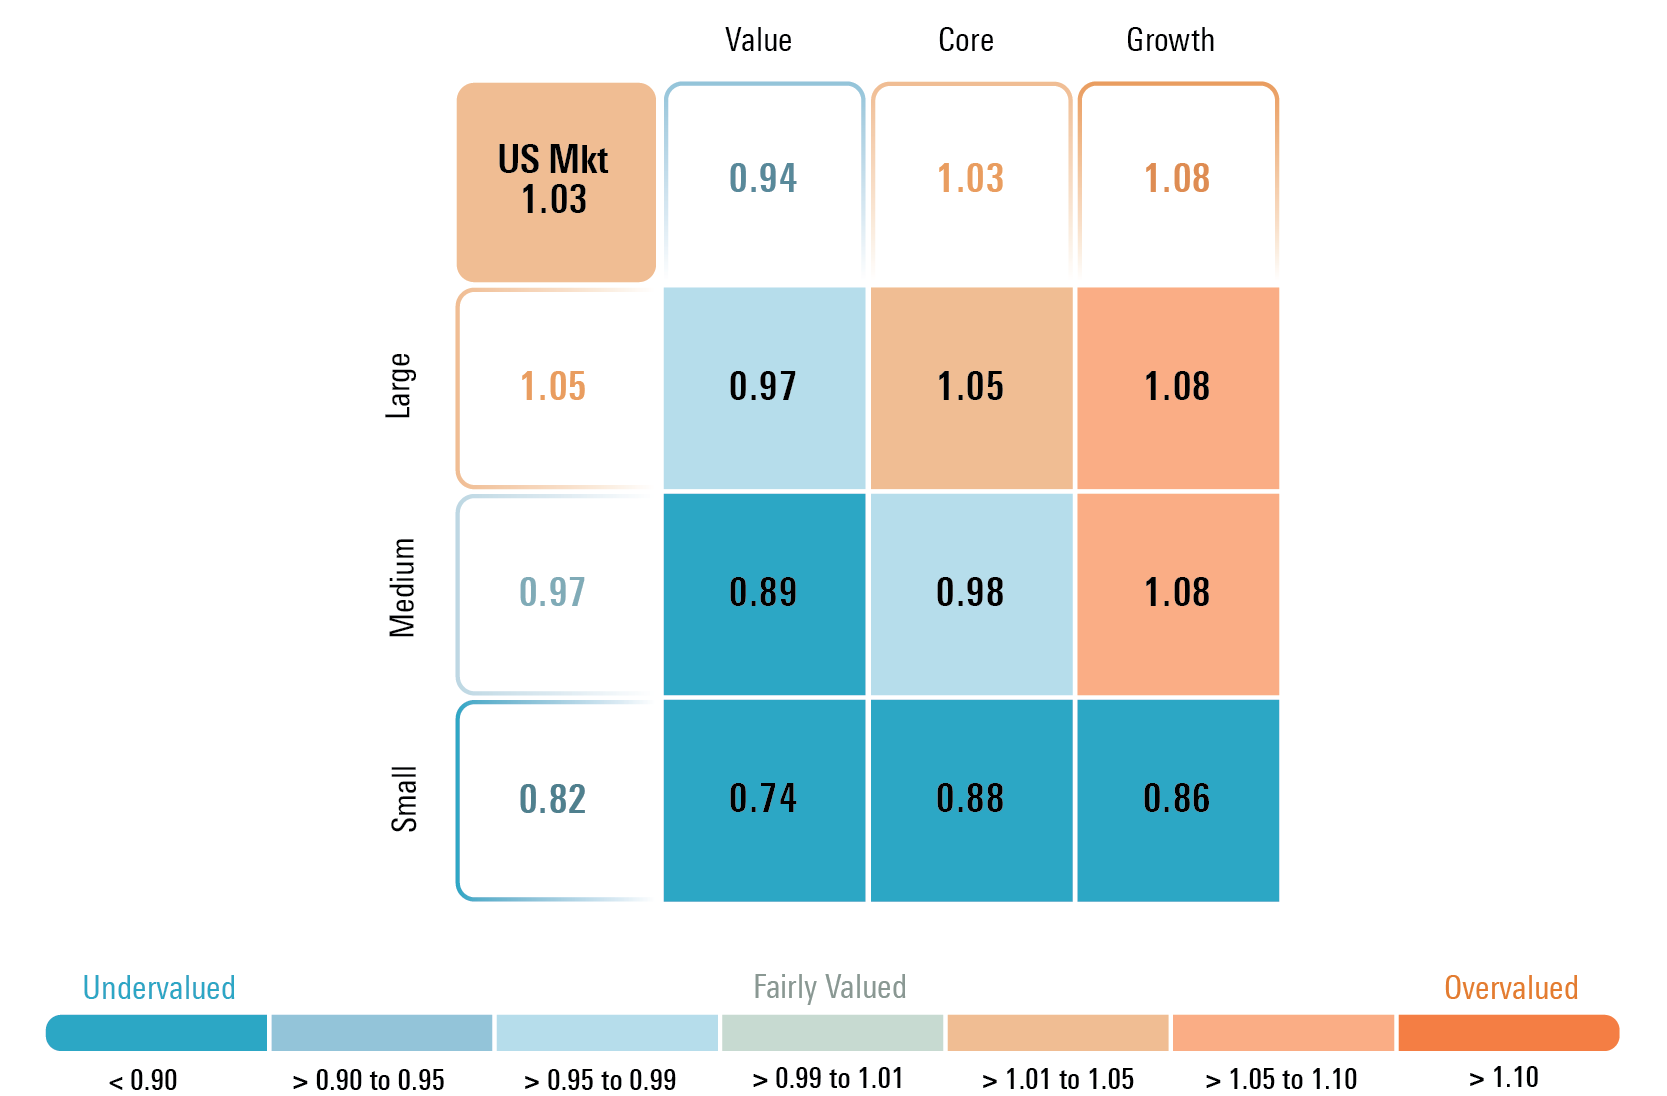
According to Morningstar Senior US Market Strategist Dave Sekera, small-cap stocks trade at an 18% discount to fair value, making them the cheapest US asset class across the Morningstar Style Box.
Price/Fair Value by Morningstar Style Box Category
While many investors might dismiss small caps, the setup looks increasingly compelling.
Despite not performing as well as large caps, it might be flying under the radar that small caps broke out to new 52-week highs at the end of March.
As we’ve written previously, all-time highs are nothing to fear. In fact, quite the opposite.
And while we recognize that the direction of the economy has a significant impact on small caps, we see an opportunity to employ a quality filter within this segment.
For example, nearly 25% of the broad small-cap index is unprofitable companies. If you adjust the index for growth companies, the number of unprofitable companies is closer to 30%.
Attempting to own the higher-quality, more-profitable part of the asset class potentially allows for a more resilient portfolio of small-cap companies than simply buying the index might allow.
A Quick Trip Down Memory Lane
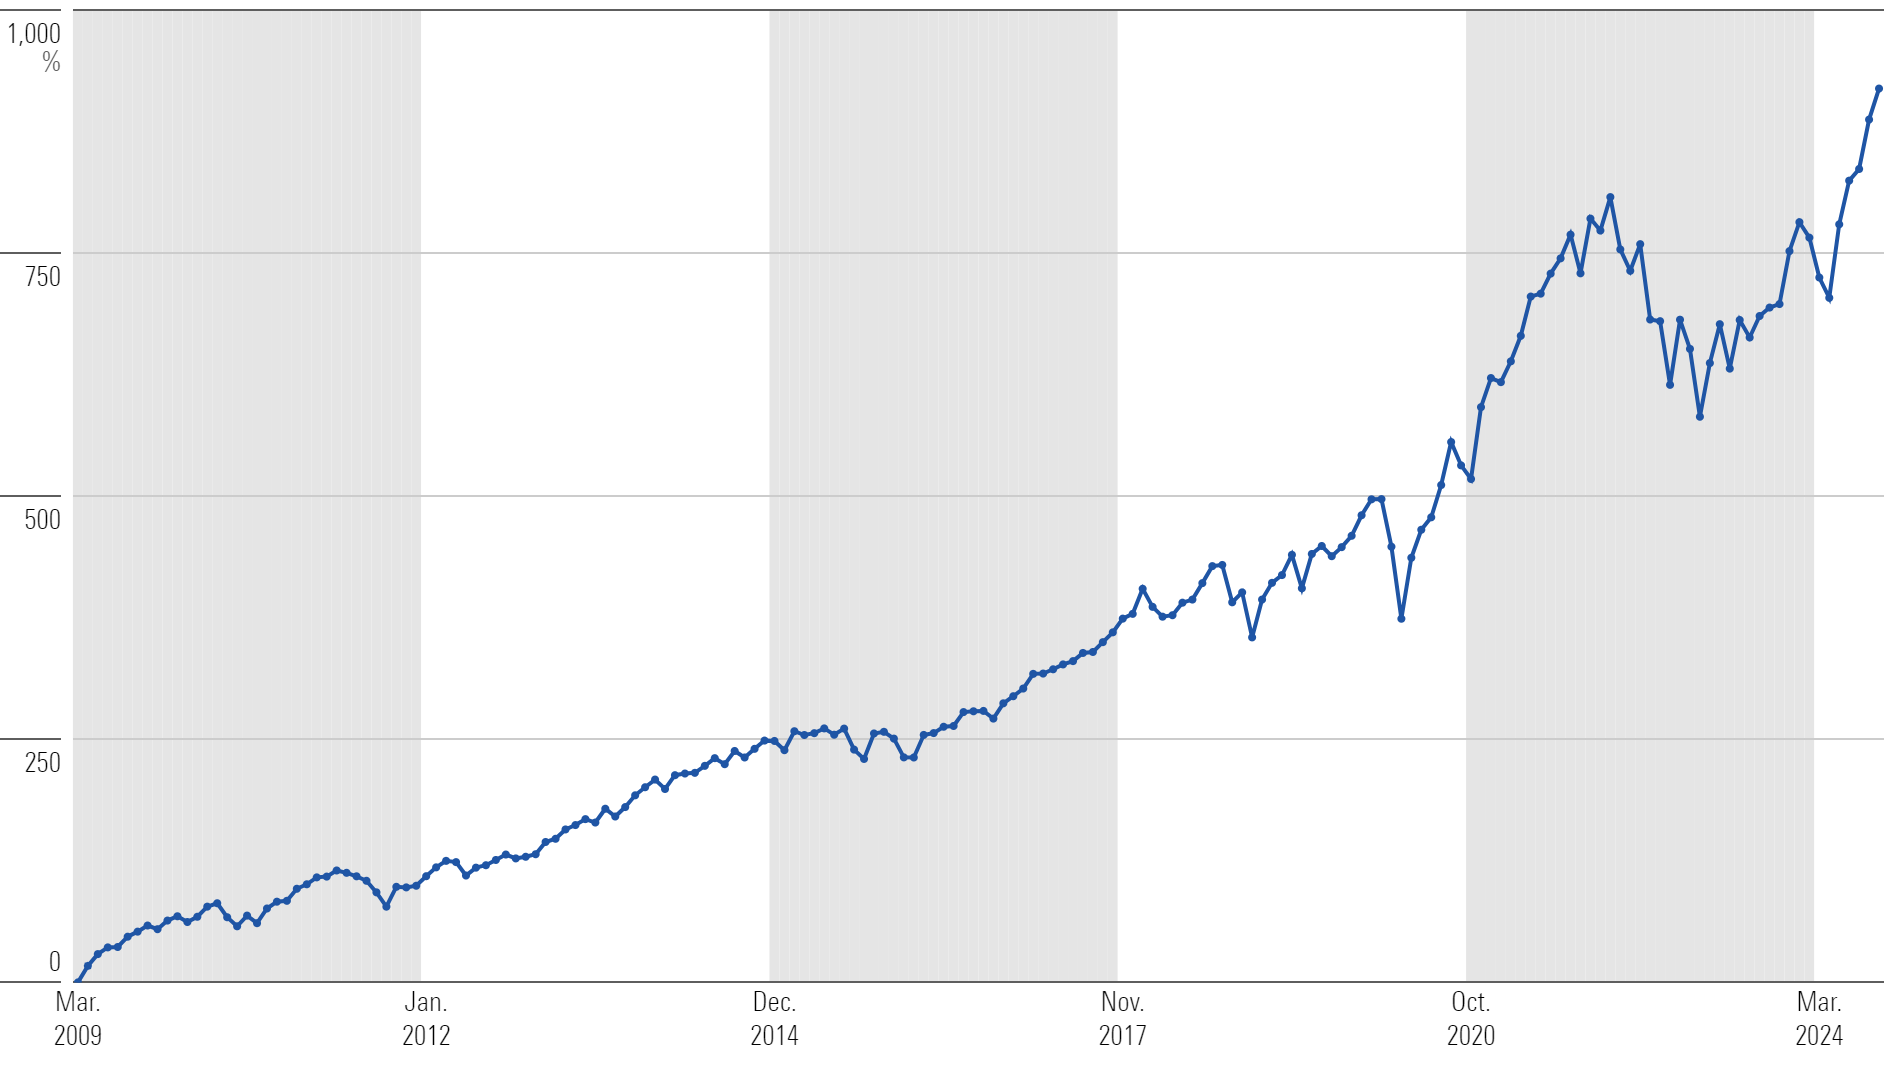
Last month commemorated the 15-year anniversary since the market hit its low point following the global financial crisis. The official trough came on March 9, 2009.
Through last-month end, the Morningstar US Market Index has returned 916% since that low.
Morningstar US Market Index Total Return Since Global Financial Crisis Bottom
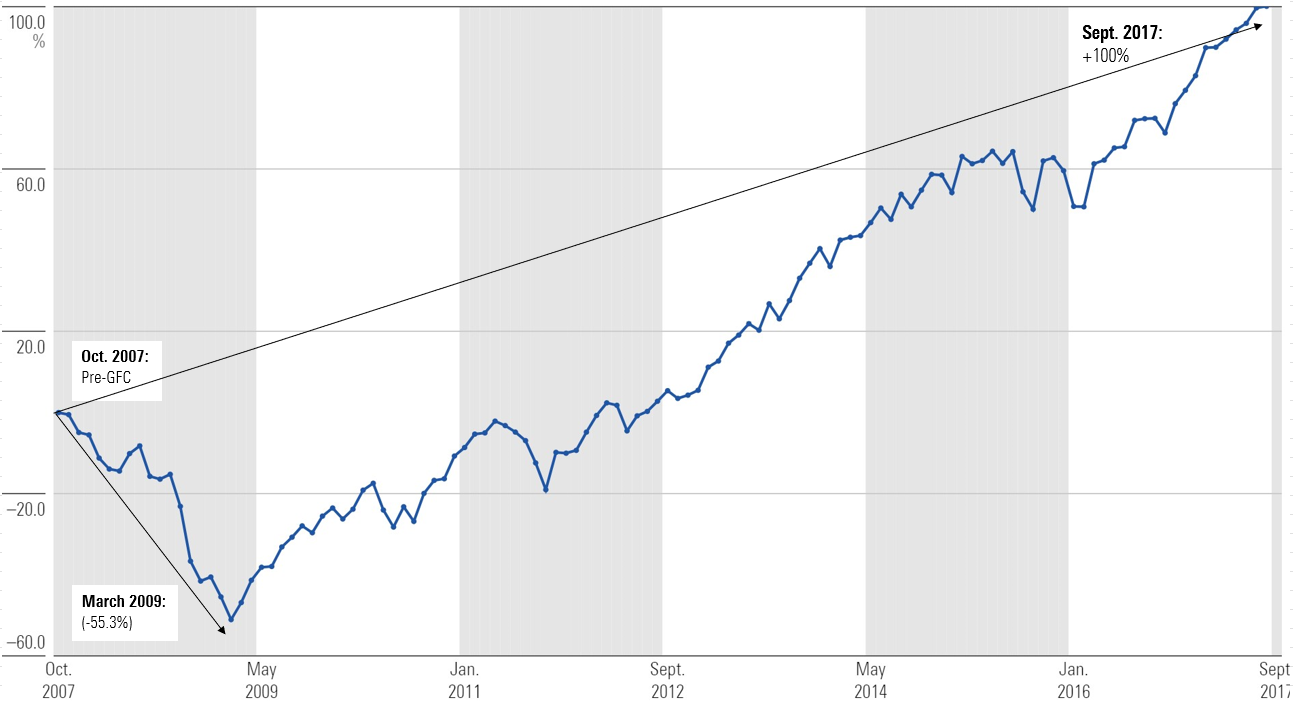
If you had invested in the index when the market peaked in October 2007, that investment would have been more than cut in half by March 2009, a total drawdown of 55.3%.
However, by September 2017—within 10 years—you wouldn’t just have recouped your initial investment but doubled it!
Morningstar US Market Index: October 2007 (Precrisis High)—September 2017
It’s a great reminder that time heals. But the intent is not to pick a market trough, and then glorify the large returns that followed. There are additional lessons we can tease out. For example, many investors who experienced that 50% drawdown likely capitulated along the way, selling as the market declined. It’s human nature—the pain of losses is often greater than the rewards that come from gains.
In effect, many didn’t experience the full impact of the subsequent decade-plus recovery.
Peter Mallouk—founder of Creative Planning—recently pointed out on Morningstar’s The Long View podcast that achieving financial goals is a function of many things, one of which is “making sure you don’t blow up along the way.”
Think about that phrase—blowing up. We often associate it with an investment that goes to zero or loses a substantial amount. However, Mallouk pointed out that the S&P 500 returned 0% for the period from January 2000 to December 2009.
If the S&P was your only investment and it returned zero for 10 years, that’s not a good way to achieve your financial goals, either. Essentially, another avenue for blowing up potentially comes from poor asset-allocation decisions.
Nobody had perfect sight in January 2000 how the market would perform over the next 10 years. And the same is true in April 2024. The best remedy we have is diversification. It can be used as a form of risk reduction, allowing investors to spread risk around, across a number of asset classes, rather than just US large-cap stocks.
The 15-year milestone came and went without much conversation. But it’s a stark reminder of the resilience of markets, the benefits of diversification, and the rewards potentially available to long-term investors.
Morningstar Investment Management LLC is a Registered Investment Advisor and subsidiary of Morningstar, Inc. The Morningstar name and logo are registered marks of Morningstar, Inc. Opinions expressed are as of the date indicated; such opinions are subject to change without notice. Morningstar Investment Management and its affiliates shall not be responsible for any trading decisions, damages, or other losses resulting from, or related to, the information, data, analyses or opinions or their use. This commentary is for informational purposes only. The information data, analyses, and opinions presented herein do not constitute investment advice, are provided solely for informational purposes and therefore are not an offer to buy or sell a security. Before making any investment decision, please consider consulting a financial or tax professional regarding your unique situation.
The author or authors own shares in one or more securities mentioned in this article. Find out about Morningstar’s editorial policies.
/cloudfront-us-east-1.images.arcpublishing.com/morningstar/ZHBXSNJYDNAY7HDFQK47HGBDXY.png)
/cloudfront-us-east-1.images.arcpublishing.com/morningstar/2TT3THVKOJAKBFGHCCRTVPNEQ4.png)
/cloudfront-us-east-1.images.arcpublishing.com/morningstar/6NPXWNF2RNA7ZGPY5VF7JT4YC4.png)