
Why a Portfolio With Low ESG Risk Can Better Withstand a Market Crisis
The power of ESG: higher returns and lower volatility in your portfolio.


Sustainable investing is at a crossroads: As a result of the backlash to ESG, sustainable funds had their first annual net outflows in 2023, in both the US and Europe.
Even so, we still believe that ESG is here to stay. People care about environmental, social, and governance issues, and the research is showing the benefits of incorporating ESG factors into your investments.
To make sense of these conflicting developments, Morningstar Sustainalytics partnered with Natixis Investment Managers Solutions on a three-part series report, where they analyzed the return- and risk-related benefits of the ESG Risk Ratings (see the methodology at the bottom of the page).
In short: Portfolios with low ESG risk typically display better raw and risk-adjusted returns than portfolios with high ESG risk—and they have a better ability to withstand financial crises.
ESG Offers Downside Protection During Market Crises
“What would happen to my portfolio if markets suffered some well-known historical events?”
To answer this question, Morningstar Sustainalytics’ analysts used the Morningstar Direct Scenario Analysis tool, which shows how one or more funds or portfolios would perform if conditions from a past market event were to recur.
They used the tool to run a series of stress tests on ESG-constructed portfolios during three past crises: the 2007-09 subprime crisis, the 2010 Greek crisis, and the 2011 US debt ceiling. This included retrieving historical data, constructing portfolios, generating risk and performance attribution analyses, and running historical simulation tests.
By running the latest portfolios through the scenario analysis, the analysts subtracted the high ESG risk portfolio return from the low ESG risk portfolio return. (So, a negative return spread indicates the low ESG risk portfolio had higher returns than the high ESG risk portfolio, and vice versa.)
This results in the return difference shown below:
Scenario Analysis by Region - Crises
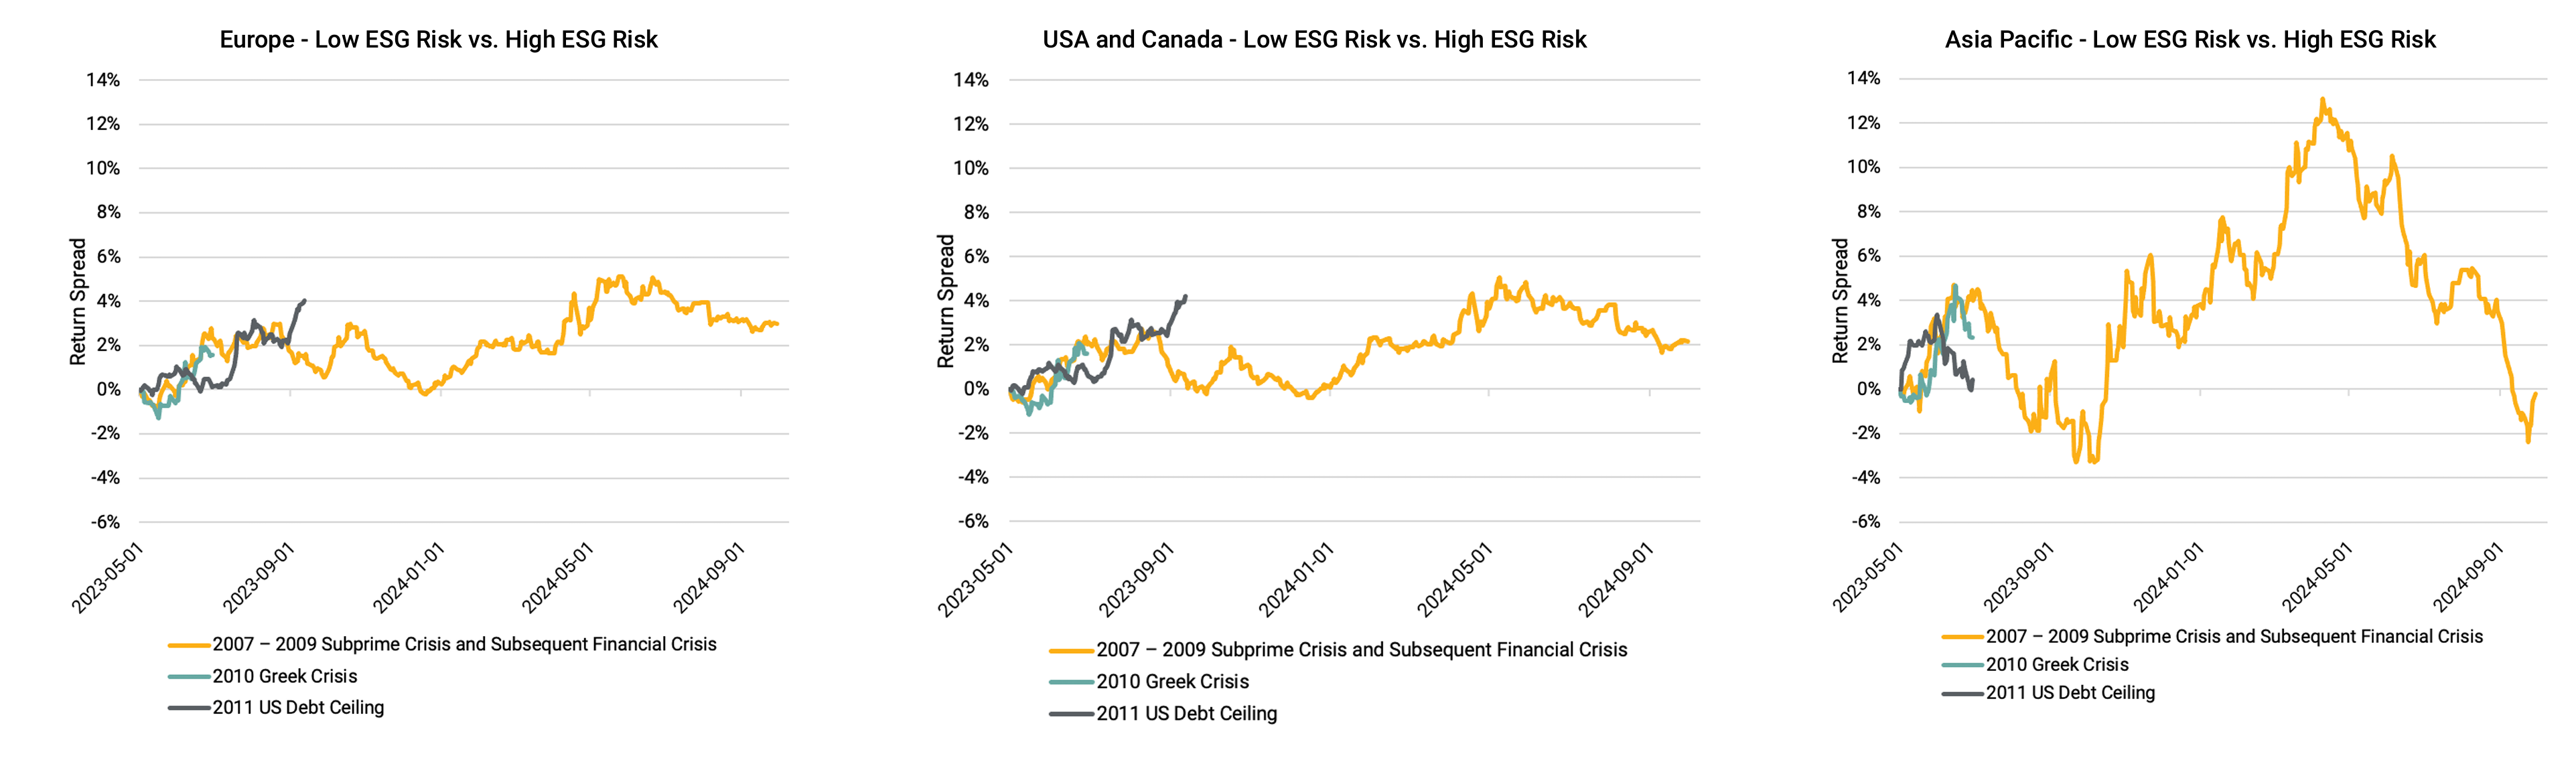
We can see that in all regions, the lower ESG risk portfolios commonly had better return performance in the subprime crisis, the Greek crisis, and the US debt-ceiling crisis.
This is likely because the factors common to the lower ESG risk portfolios regarding volatility, financial health, valuation uncertainty, and economic moat generate downside protection under these more negative economic scenarios—suggesting that low ESG risk portfolios have a better ability to withstand financial crises.
Low ESG Risk Generates Better Risk-Adjusted Performance in the Long Run
In addition to functioning as a parachute during times of market turbulence, ESG approaches also seem to yield better results in the long run.
Overall, the study shows that reducing ESG risk is beneficial for performance and risk mitigation. Factors associated with lower ESG risk include lower volatility, greater valuation certainty, stronger economic moats and financial health, and higher valuations.
Averaging returns over the period examined (December 2014–April 2023), the findings show that lower ESG risk portfolios outperform their respective regional high ESG risk portfolios in all three regions on returns.
Average Annualized Returns Across Regions
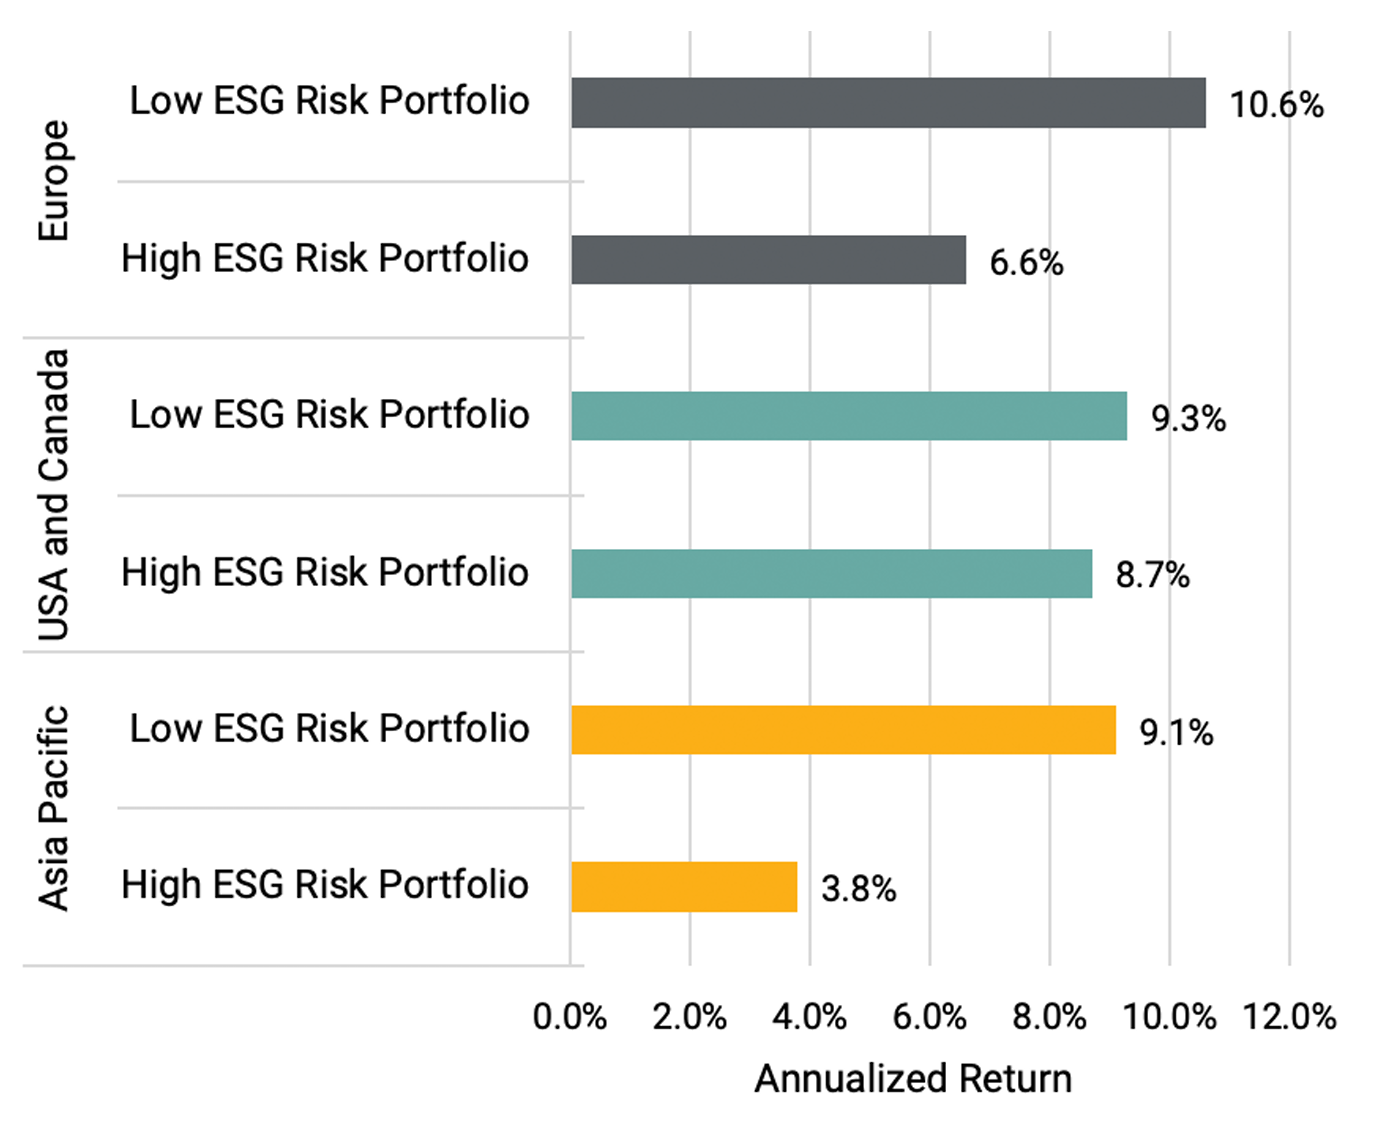
To take a closer look at these returns by region:
- Europe has been the most consistently outperforming region for low ESG risk portfolios since January 2015. The spread between the low and high ESG risk portfolios continued a daily year-over-year expansion for nearly five years straight, apart from a slight decline between November 2016 and January 2017.
- In North America, the two portfolios appear to trade very closely in line with one another. Significant outperformance for the low ESG risk portfolio occurred when the market declined in 2015, but the gap narrowed shortly thereafter and even turned negative for a period as the market rose in 2018.
- For the Asia-Pacific region, the ESG risk premium was strong in 2015, allowing it to continue compounding returns into other years. Much like Europe, the strategy slowed from December 2017 to January 2018 but regained momentum until the covid-19 selloff rebound in March 2020.
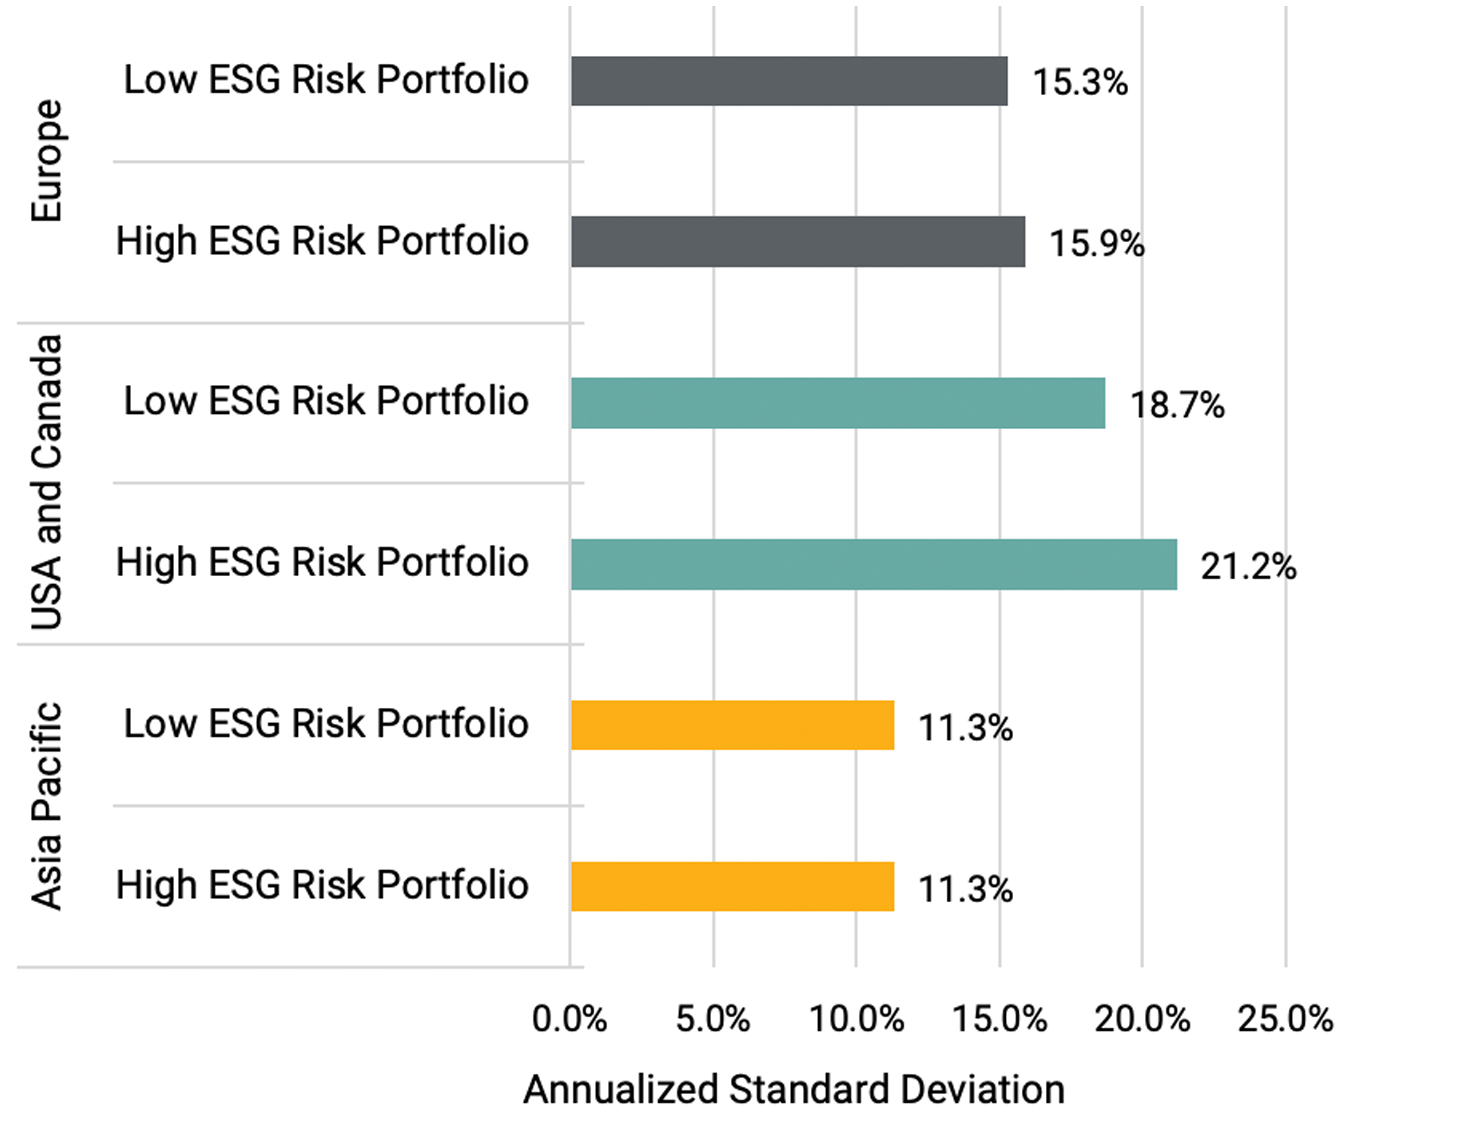
Interestingly, these extra returns were generally not associated with higher risk.
The chart below shows that compared with high ESG risk portfolios, the standard deviations of the low ESG risk portfolios are either lower (for example, Europe and the US and Canada) or comparable (for example, Asia-Pacific).
While the United States and Canada had a narrower positive return spread in the chart above, the volatility difference shown below is more substantial—highlighting the downside protection benefits of low ESG risk portfolios.
Average Annualized Standard Deviation Across Regions
Are American Tech Stocks Not ESG-Friendly?
The report also examined whether good ESG portfolios outperform poor ESG portfolios at the sector level, using Morningstar Direct’s Equity Attribution tool.
The results indicate that investing in lower ESG risk portfolios is rewarding in the healthcare, consumer cyclicals, utilities, and basic materials sectors, with a positive return difference between low and high ESG risk portfolios in all regions. Lower ESG risk in industrials works well in Europe but seems to have a neutral outcome in the US and Canada and in Asia-Pacific.
However, the technology sector sees mixed results: It generates strong returns in Europe (up 25.9% per year) and is slightly effective in Asia-Pacific (up 2.1%) but then underperforms in the United States and Canada (down 6.9%).
Cumulative Return Difference by Sector Between Low and High ESG Risk Portfolios
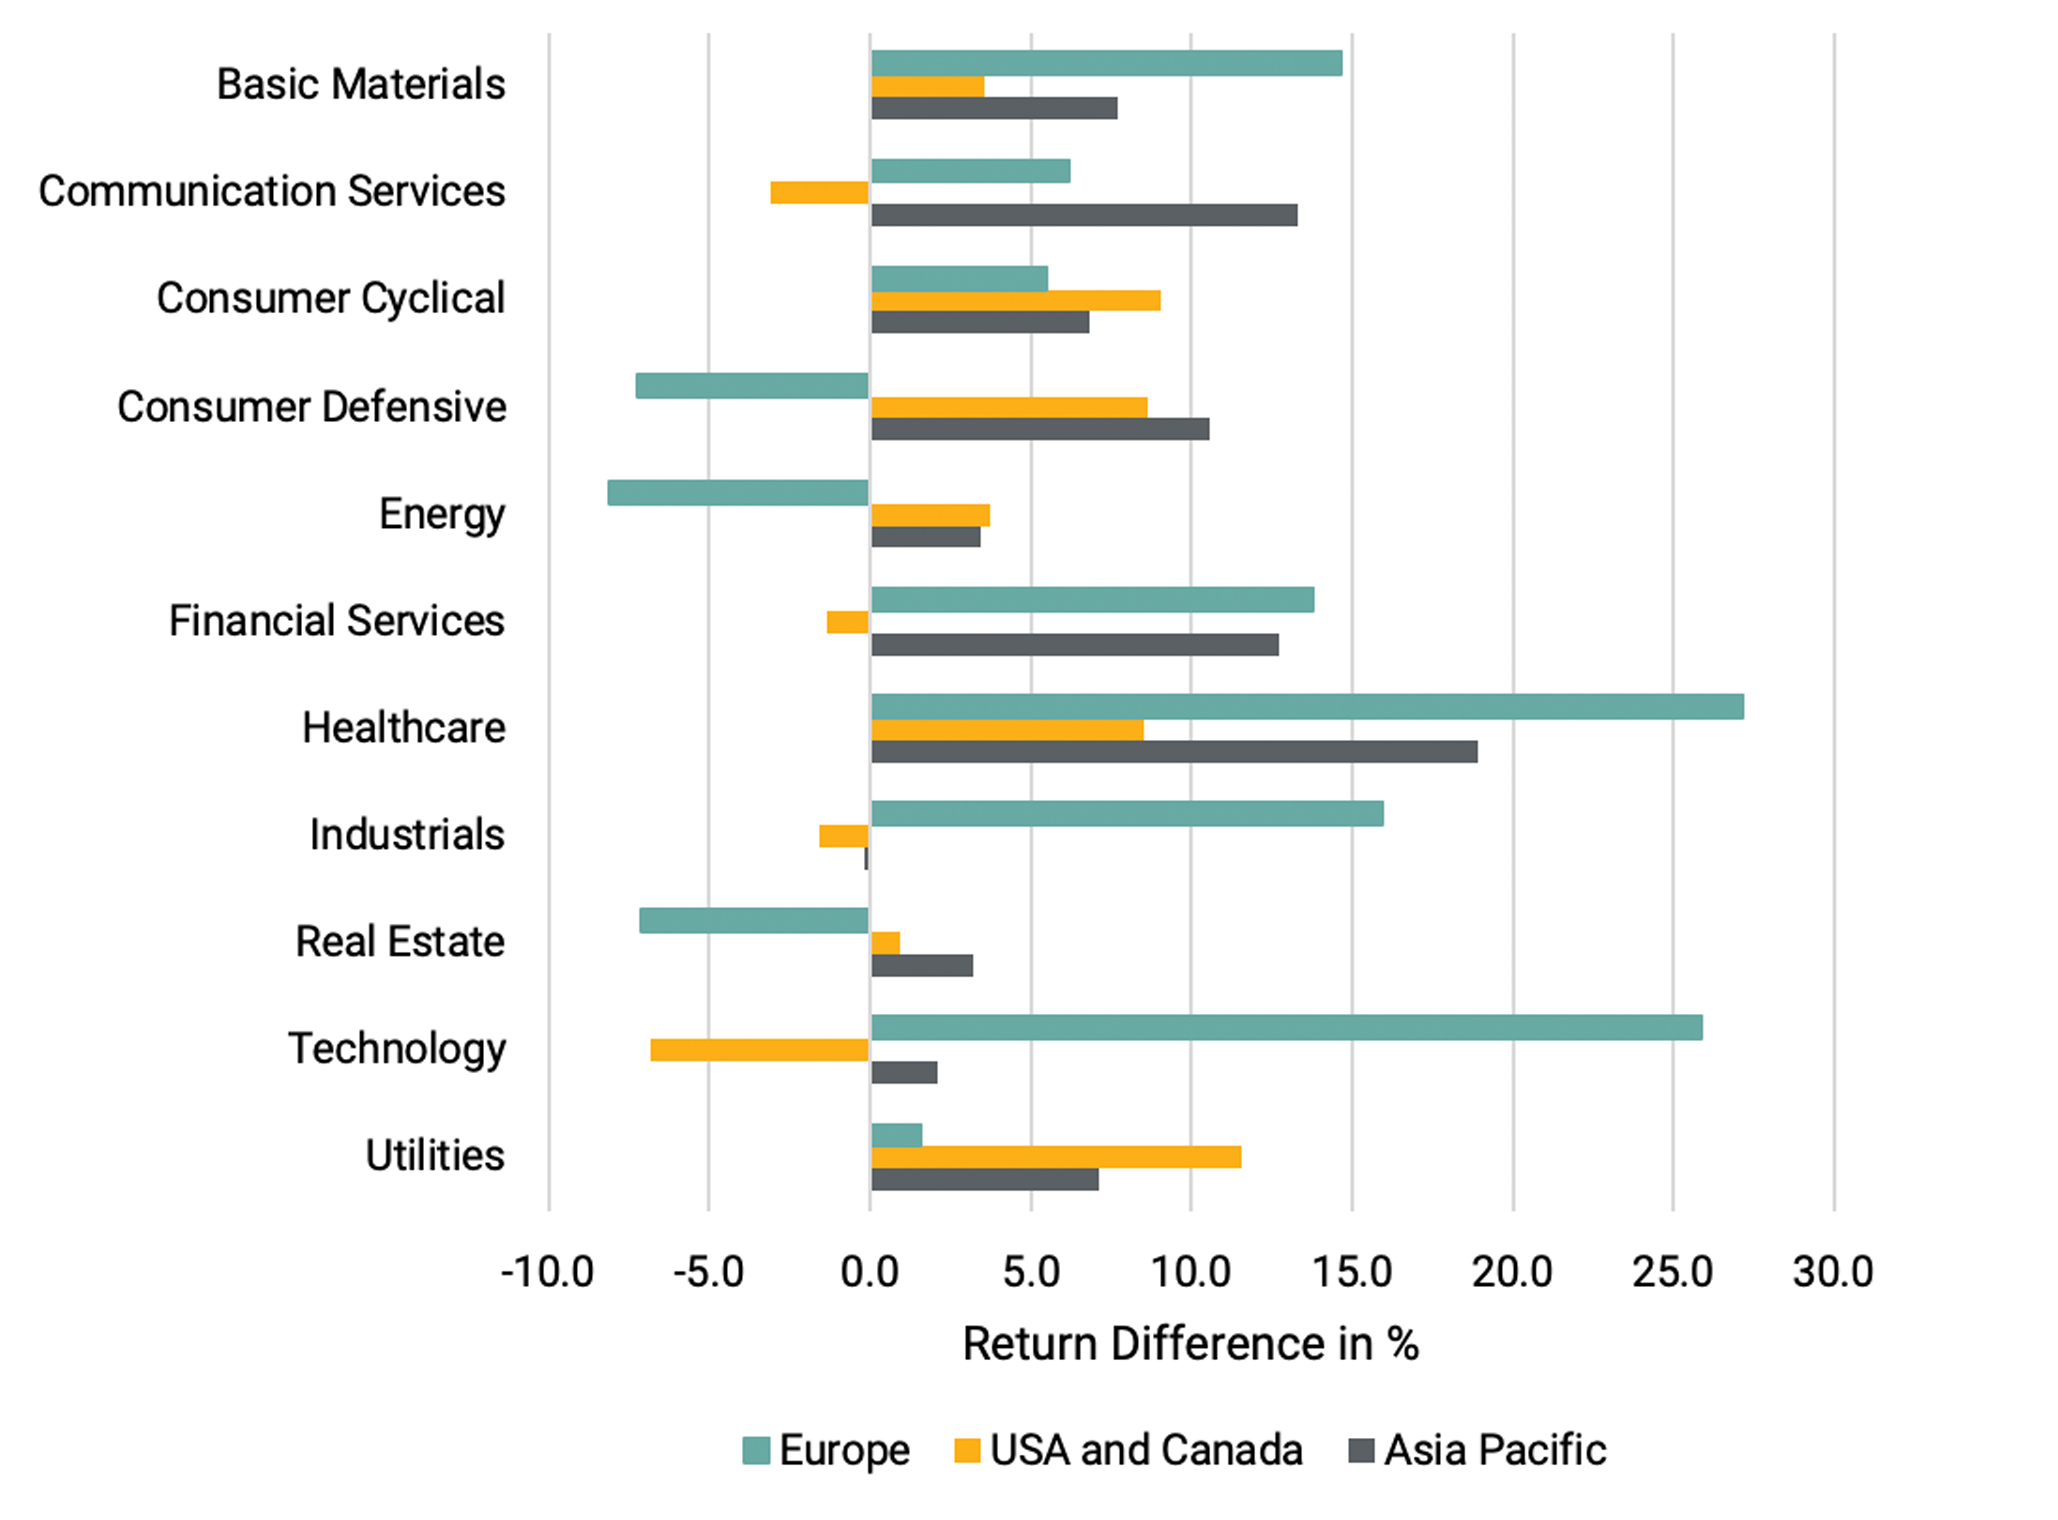
This could be because large US tech companies, by far the best-performing in recent years, actually score poorly on ESG metrics: The ESG Risk Ratings for big names such Amazon.com AMZN, Meta META, or Alphabet GOOG are classified as High. In most cases, this is attributable to the companies’ involvement in controversies.
Methodology
Using simulated and actual ESG Risk Ratings, the analysts constructed ESG-signal-based portfolios and analyzed the period between December 2014 and April 2023, comparing the Low and High ESG Risk portfolios.
They restricted the analysis to three regions for which there is enough coverage: Europe, the United States and Canada, and Asia-Pacific. They produced two baskets of stock portfolios with Low and High ESG Risk companies and assessed the ESG risk premium.
To control for the size effect, the Low and High ESG Risk portfolios have equivalent weightings within the three market-cap groups: small caps, mid-caps, and large caps. The same has been done for the sector factor, with equal sector weightings for the Low and High ESG Risk portfolios across all 11 Global Industry Classification Standard sectors.
This method provided six portfolios across three regions (2x3) allowing the creation of a testable long-short ESG-based investment strategy.
The author or authors do not own shares in any securities mentioned in this article. Find out about Morningstar’s editorial policies.
/cloudfront-us-east-1.images.arcpublishing.com/morningstar/NNGJ3G4COBBN5NSKSKMWOVYSMA.png)
/cloudfront-us-east-1.images.arcpublishing.com/morningstar/6BCTH5O2DVGYHBA4UDPCFNXA7M.png)
/cloudfront-us-east-1.images.arcpublishing.com/morningstar/EBTIDAIWWBBUZKXEEGCDYHQFDU.png)