
16 min read
Morningstar Markets Observer: Q3 2026
Market Overview
Stocks Bounce Back in the Second Quarter
Equity markets staged a sharp rebound in the second quarter, led by the Morningstar Emerging Markets Index's 22.4% gain and a 15.5% return for US Large Cap.
Large-growth stocks outperformed their value counterparts by 26 percentage points, driven by renewed enthusiasm for mega-cap technology and artificial intelligence names.
Bonds lagged as yields rose across the curve, with the 5-year Treasury yield climbing to 4.2% from 3.8% a year earlier.
Broad commodities fell 8.1% as oil prices plummeted following the first quarter's spike.
Source: Morningstar Direct. Data as of June 30, 2026.
Gold and Oil Retreat From Highs
Crude oil prices dropped 38% in 2026’s second quarter as supply disruptions from the Iran war eased. Bitcoin continued to decline from its October 2025 record high, falling 3.8% in the second quarter. US house prices remained near record levels as supply continued to trail homebuyer demand. Interest rates held steady at 3.63% following Kevin Warsh's first Federal Open Market Committee meeting as the new Federal Reserve Chair.
Market Thermometer
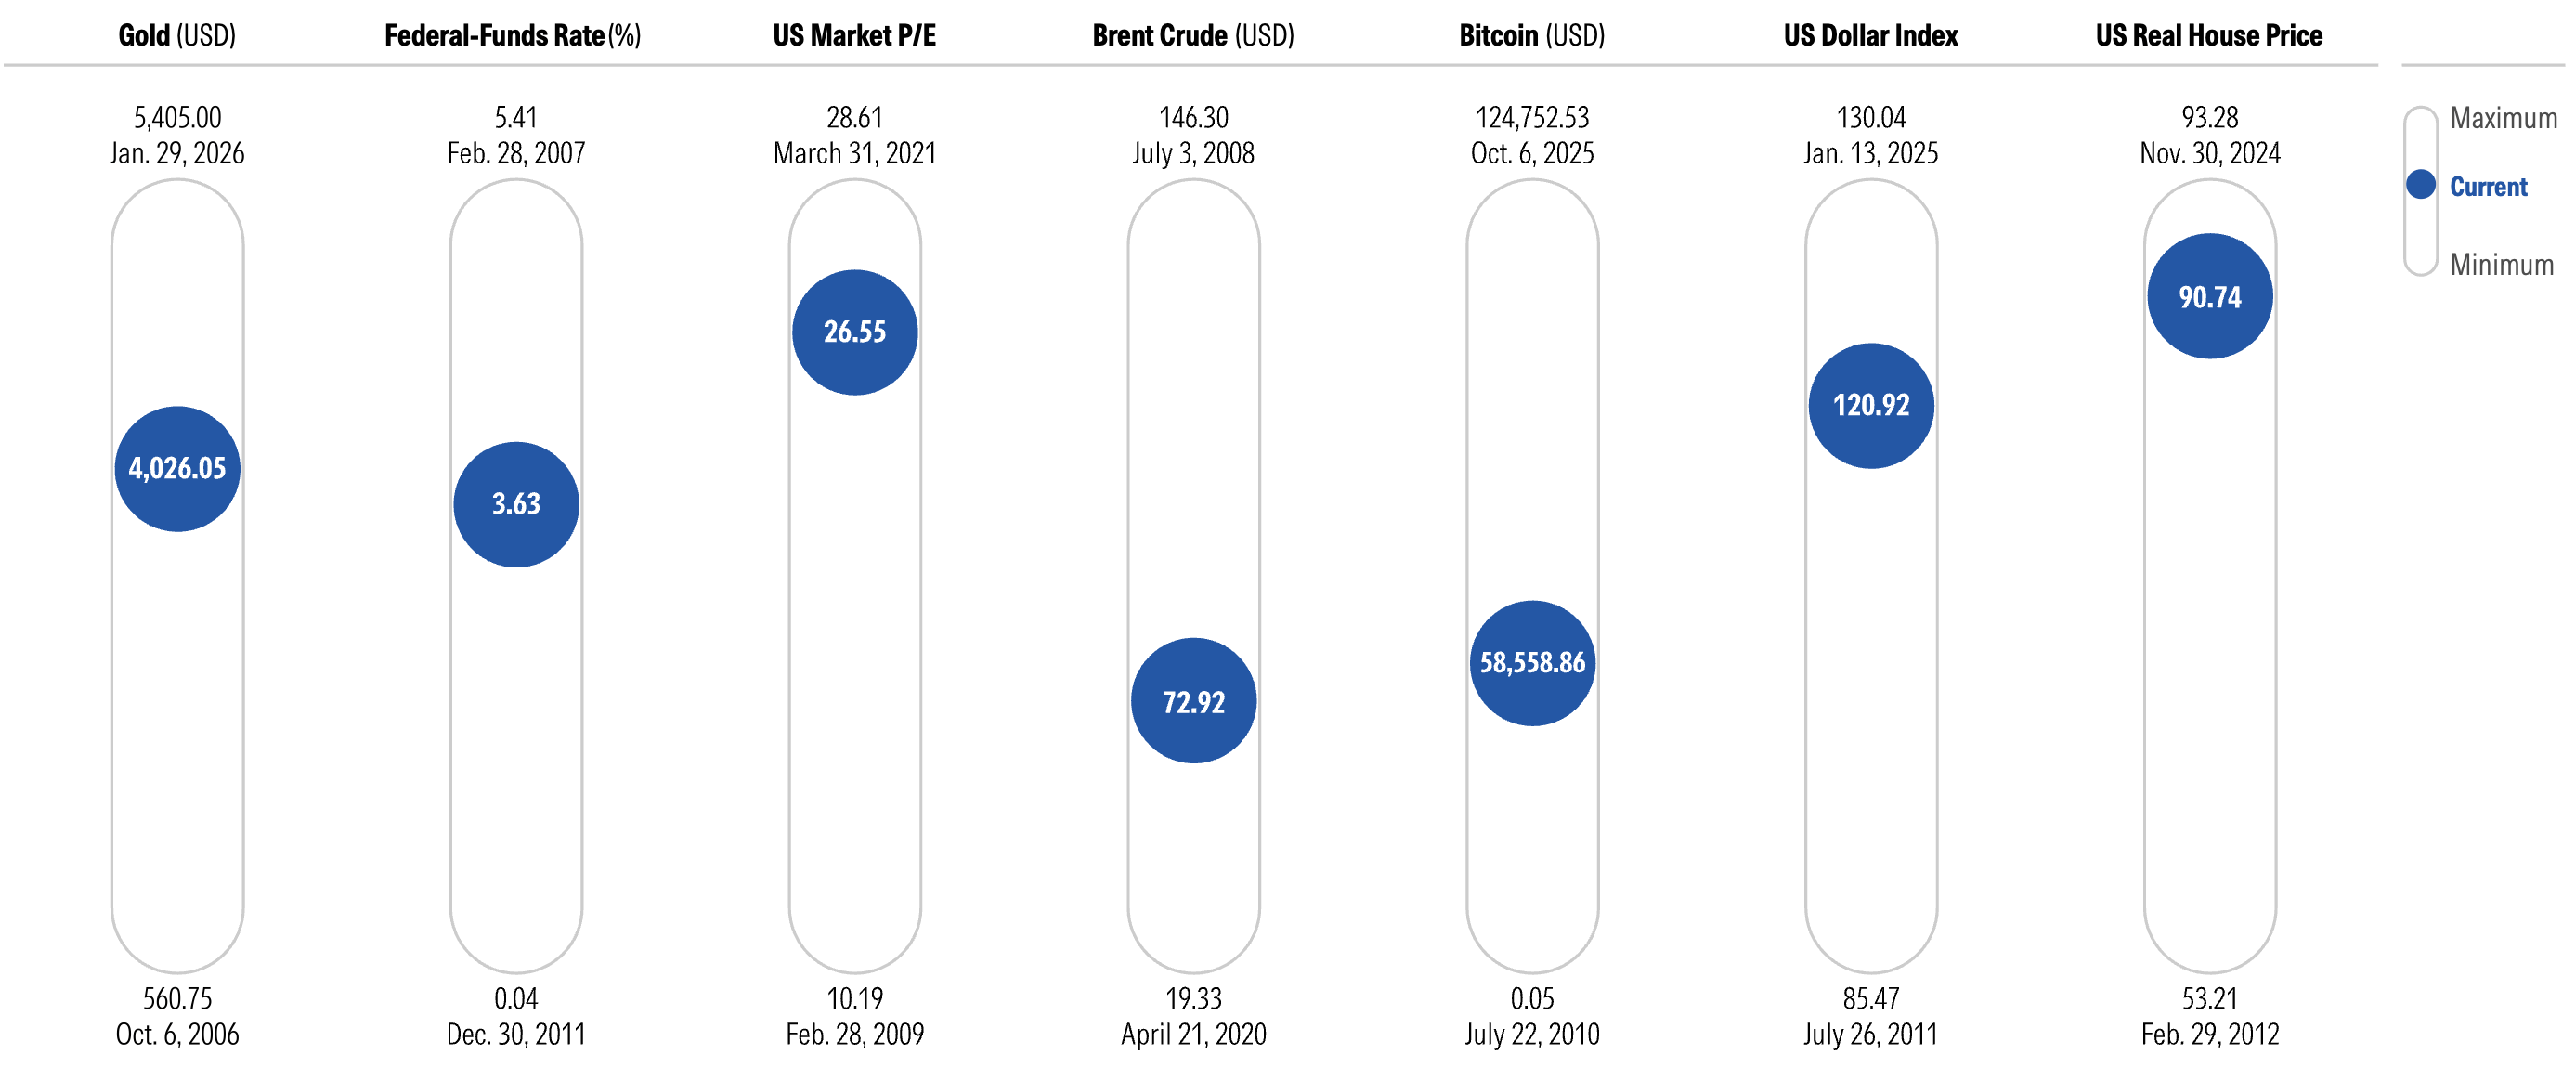
Source: Morningstar Direct, Federal Reserve Bank of St. Louis, National Association of Realtors, Macrobond. Minimums and Maximums for the period July 1, 2006, to June 30, 2026.
US Market Soars Despite Ongoing War
US equities rose in the second quarter of 2026, bringing the current expansion to 30 months. The US stock market staved off a downturn with strong second-quarter returns reversing the first quarter's decline. Falling oil prices and refreshed AI sentiment helped power US stocks ahead. The US market gained 33% annualized and 104.1% total since 2022's downturn.
US Market Downturns, Recoveries, and Expansions
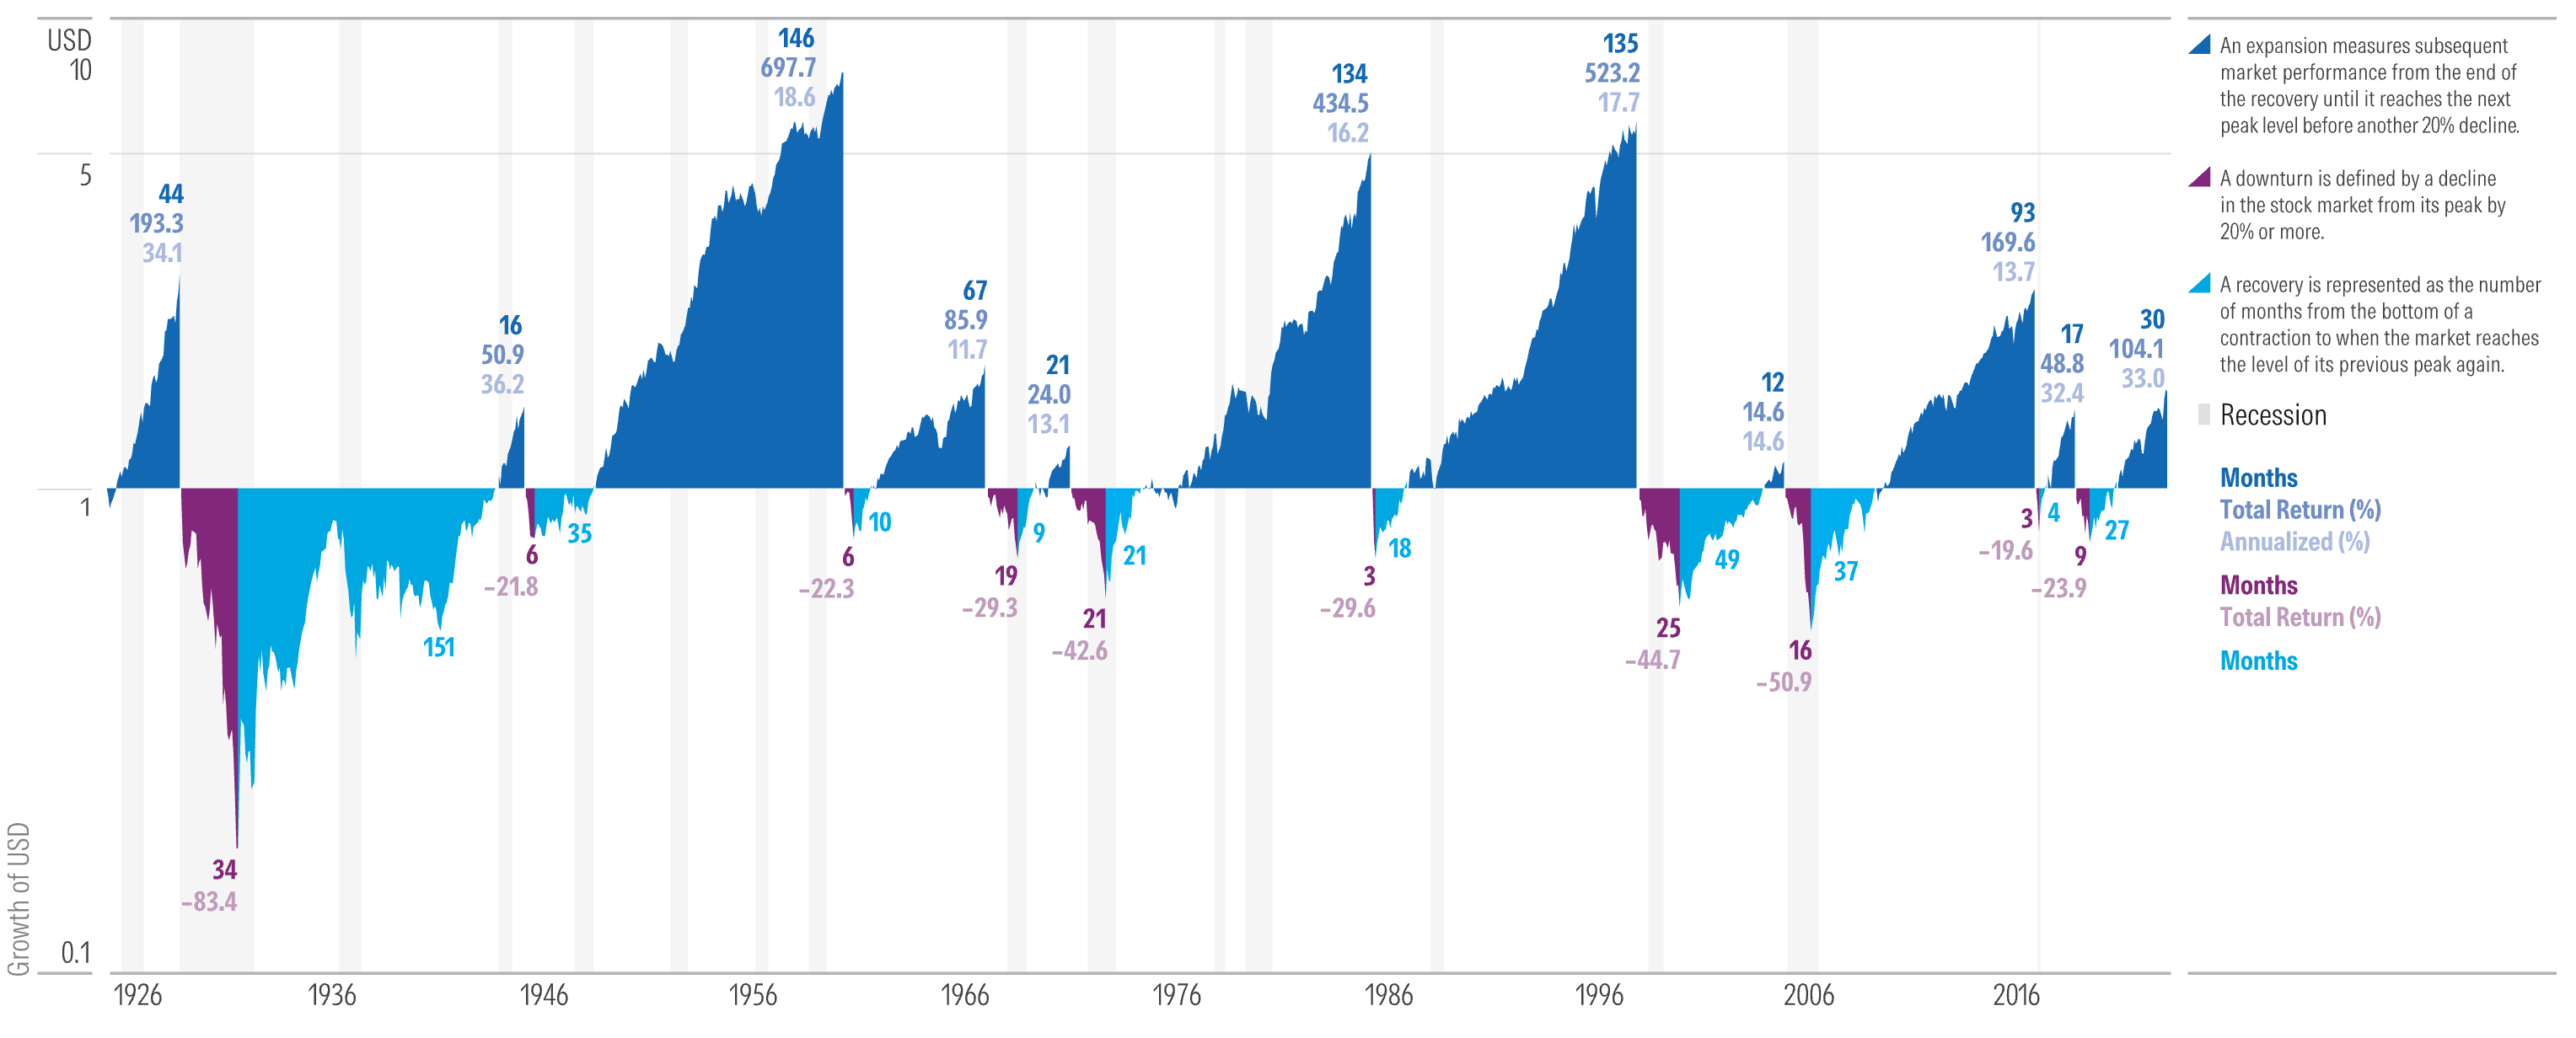
Source: Stocks—Ibbotson Associates SBBI US Large Stock Index. Recession data from the National Bureau of Economic Research (NBER). Data as of June 30, 2026.
Emerging Market Stocks Test New Highs as Commodities Fall
Emerging-market stocks gained 38.3% for the year ended June 2026, as a surge in AI-memory hardware companies such as Samsung 005930 and SK Hynix SKHY lifted returns for the entire region. US stocks caught up to their developed-market counterparts following the latter's strong start to 2026. Commodities reversed course in May, as oil's price spike proved short-lived. Ongoing tensions in the Middle East, however, threaten any prolonged decline. Emerging-market bonds grew slightly in the second quarter of 2026, while investment-grade US bonds fell over the same period.
Source: US stocks—Morningstar US Market Index. Developed-markets stocks ex-US—Morningstar Developed Markets ex-US Index. Emerging-markets stocks—Morningstar Emerging Markets Index. US bonds—Morningstar Core Bond Index. Emerging-markets stocks—Morningstar Emerging Markets Composite Bond. Commodities—Bloomberg Commodity Index. Data as of June 30, 2026.
Most US Sectors Strongly Positive
A rotation from defensive to growth sectors occurred in the second quarter as the broader US market reversed early-year losses. The US market gained 15.5% for the quarter, contributing to a trailing one-year gain of 22.6%. Technology led the rotation, gaining 32.1% over the quarter and 36.0% over the last year. Energy remains strongly positive over the last year despite falling 12.5% in the second quarter. A rapid rise in oil prices in March 2026 followed by a swift decline in the second quarter of 2026 is behind these moves.
Source: Morningstar Sector Indexes. Data as of June 30, 2026
Most Foreign Stock Markets Strongly Positive
International stock markets rallied in the second quarter of 2026, rebounding from mixed results in the first quarter. Foreign developed markets rose 9.5%, and emerging markets enjoyed a 22.4% gain last quarter. Asian emerging markets stood apart thanks to sky-high returns for select technology stocks in Taiwan and South Korea. Conversely, Latin America was the only region with negative returns during the quarter, though it was still strongly positive over the last year.
Source: Morningstar Indexes. All returns are calculated in US dollars. Data as of June 30, 2026.
Valuation-Implied Returns: Expect a Moderation in Foreign Stocks
Valuation-implied returns serve as a useful measure for cross-asset-class comparisons. Although emerging-market stocks continue to look attractive, their blockbuster recent results have put a dent in future expectations, shifting this group's 10-year expected annualized return down by 4.6 percentage points since June 2025. US high-yield bonds hold the highest expected returns over the next decade, with valuation-implied returns for the asset class growing by 0.2 percentage points amid moderately widening spreads.
Source: Morningstar Investment Management LLC. Data as of June 30, 2026.
Oil's Wild Ride Continues
Oil prices experienced significant volatility since the Iran war began on Feb. 28. Brent crude nearly doubled in price in the first quarter, while US and ex-US equity markets fell 4.2% and 0.6%, respectively, reversing early-year gains. Oil prices reversed course in the second quarter. Despite a brief surge in late April, they have steadily declined since. Overall, Brent crude ended 2026’s first half up 19.8%. Meanwhile, US and foreign stocks have more than recovered from their March lows.
Source: Morningstar Direct. Data as of June 30, 2026.
Equities
Global Market Barometer
Global equity markets delivered mostly strong results during the first six months of 2026 despite getting off to a shaky start. South Korea led other major markets by a wide margin, benefiting from an astonishing rally in semiconductor and memory-chip companies. Peru, Thailand, and Egypt also stood out following strong economic growth. On the other hand, China, India, and South Africa declined in the first half of the year. China, in particular, is expecting slower economic growth than it previously enjoyed.
Year-to-Date Returns of Morningstar Country Indexes in Base Currency
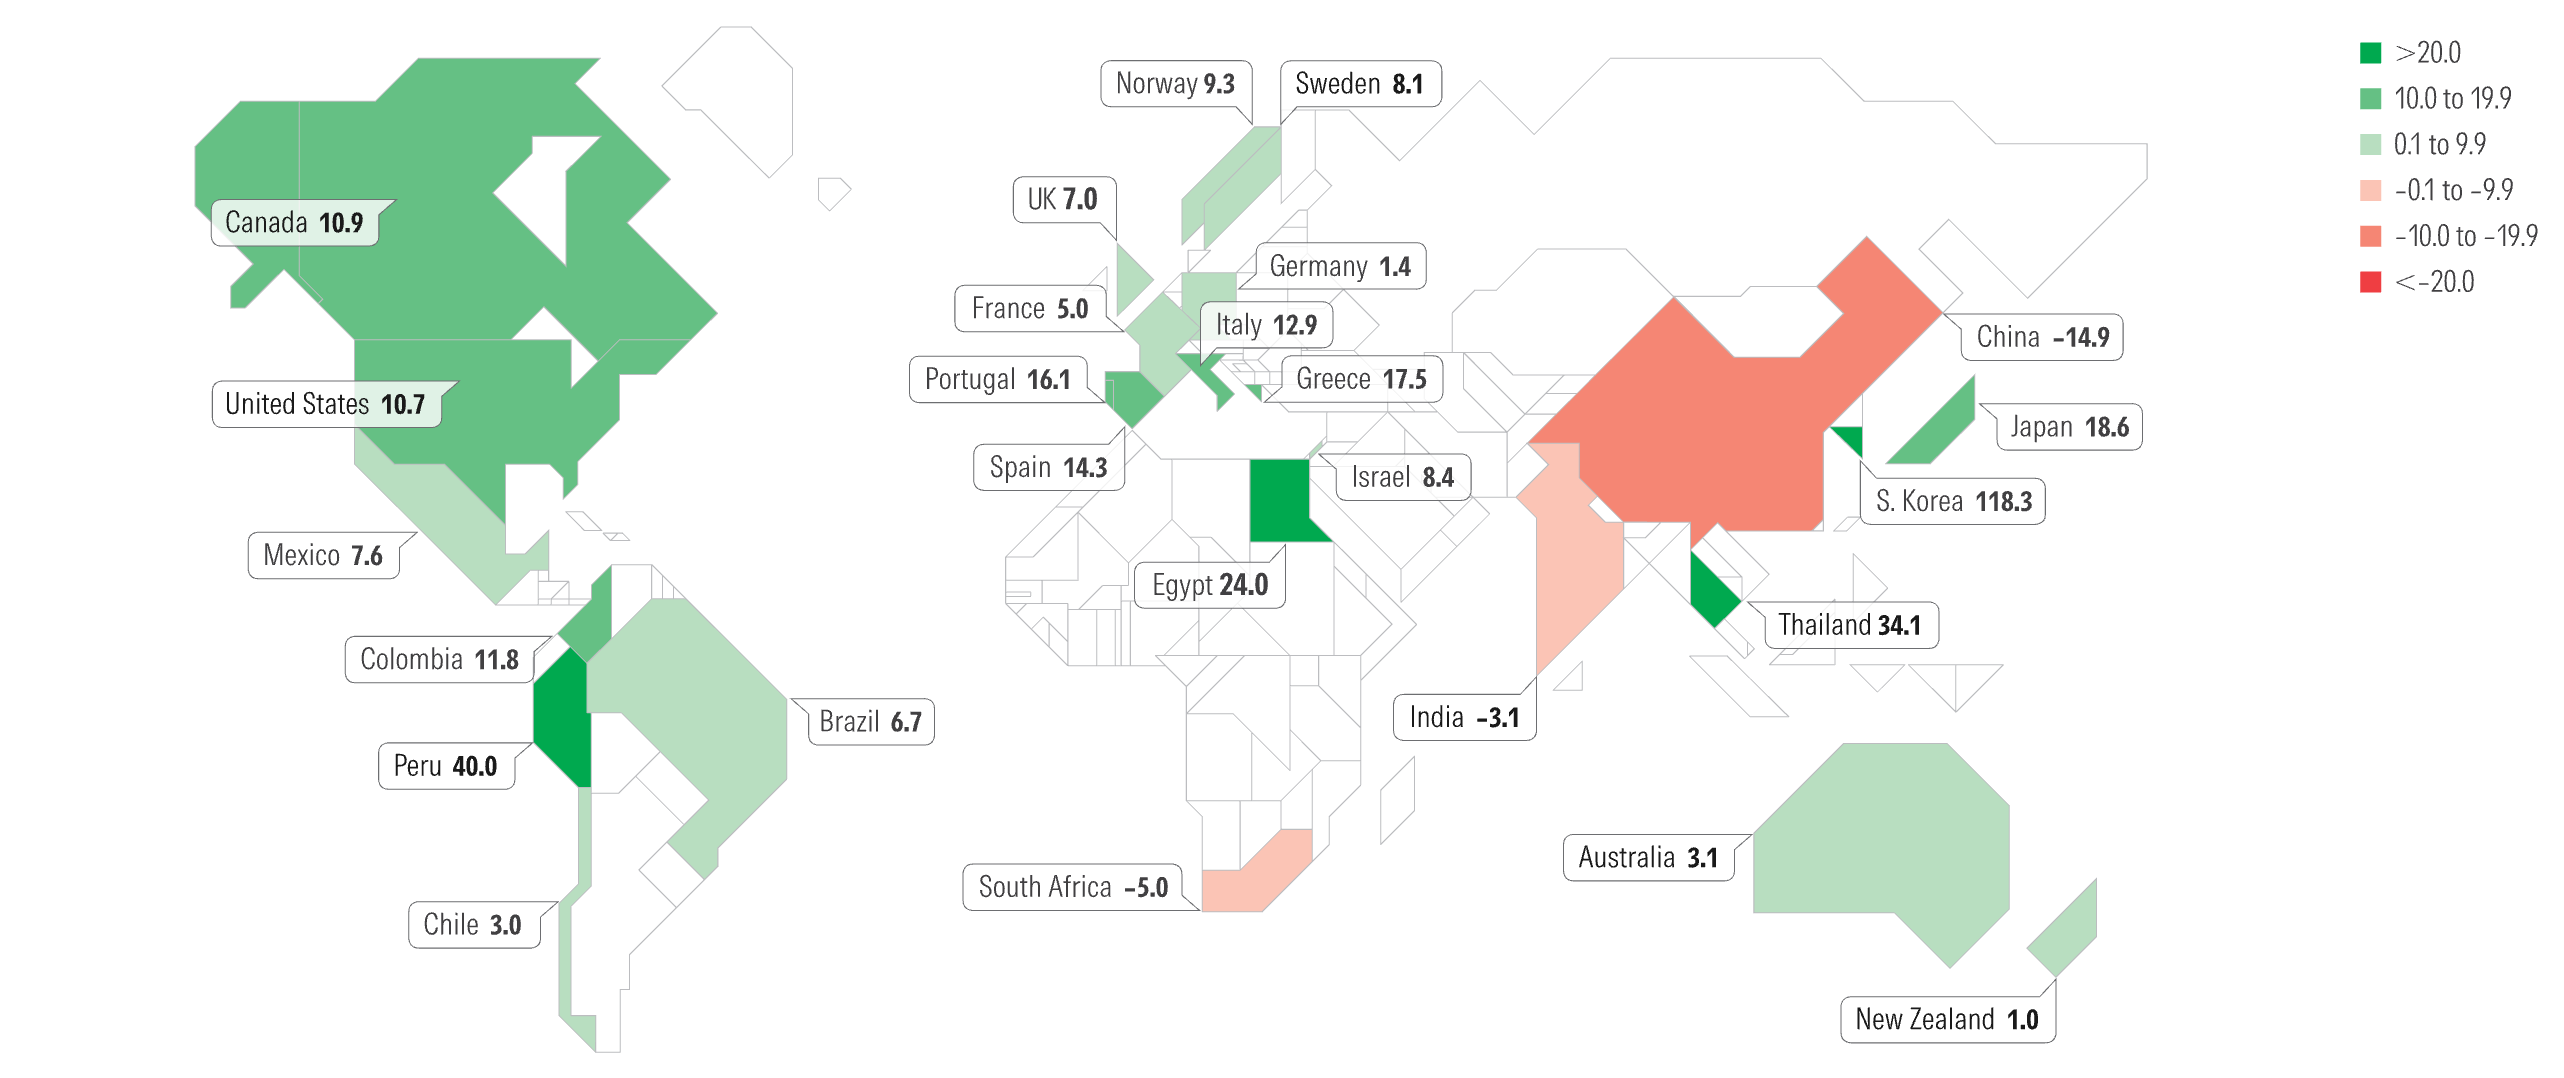
Source: Morningstar Country and Region Indexes. Data as June 30, 2026.
Global Stock Market Performance Decomposition
Asia ex-Japan and emerging markets broadly led the way in 2026's first half, driven by improving margins and price/earnings multiple expansion despite currency headwinds. Japan's return also relied on a strong P/E rerating, which more than offset drags from currency and margin compression. The US, Europe, and the UK posted more modest gains. The US benefited from margin expansion and sales growth, while Europe and the UK leaned on P/E gains to offset currency pressure.
Source: Morningstar Direct. Data as of June 30, 2026.
Sector Performance Decomposition
Information technology led global developed-market sector returns so far in 2026, fueled almost entirely by margin expansion. Energy and industrials stocks followed, with energy's gains attributable to both margin expansion and P/E gains. Industrials, meanwhile, leaned mostly on P/E rerating, as investors bid up their prices at a faster pace than their earnings grew. Communication services and consumer discretionary lagged, with investors taking a dimmer view of their current earnings, pulling the latter into negative territory for the year to date.
Source: Morningstar Direct. Data as of June 30, 2026.
Morningstar Price/Fair Value
The median stock in the Morningstar US Market Index remained undervalued for most of the second quarter of 2026. Communication services was the most undervalued sector at the end of June, followed by technology and consumer cyclicals. In contrast, industrials stocks appear the most overvalued, possibly resulting from strong performance and the continued data center buildout. Basic materials, consumer defensive, healthcare, and utilities stocks also traded above their fair value at the end of the second quarter.
Source: Morningstar fair value data. Data as of June 30, 2026.
What's Cheap? Size and Industry Valuations Diverge
US large-cap equities' long-standing premium over US small caps has normalized a bit in 2026 so far, but it still has a long way to go to close the gap completely.
Within technology, however, two industries have been moving in opposite directions.
Prices and valuations of semiconductor companies keep climbing on resilient chip demand, bringing their price/earnings ratios far above historical norms. Meanwhile, software valuations have been weighed down by AI-displacement fears. Many software stocks are trading well below their recent highs.
Source: Morningstar Direct. Indexes: Morningstar US Large, Morningstar US Small, Morningstar Global xUS TME, Morningstar US TME. Data as of June 30, 2026.
Momentum Came Roaring Back
Momentum led the way by a wide margin over both the trailing quarter and trailing year, driven largely by extended rallies in AI and semiconductor stocks. Value and size also outperformed the market on a trailing-year basis, as market leadership also broadened. Low volatility, meanwhile, lagged significantly across both periods, as investors favored riskier positions over more defensive exposures.
Source: Morningstar Direct. Value—Morningstar US Value Factor Index, Yield—Morningstar US Yield Factor Index, Momentum—Morningstar US Momentum Factor Index, Quality—Morningstar US Quality Factor Index, Low Volatility—Morningstar US Low Volatility Factor Index, Size—Morningstar US Size Factor Index Market—Morningstar Market Index. Data as of June 30, 2026.
The Magnificent Seven Moderates, While Unicorns Catch Up
The Magnificent Seven—Alphabet GOOG, Amazon AMZN, Apple AAPL, Meta Platforms META, Microsoft MSFT, Nvidia NVDA, and Tesla TSLA—powered markets forward since 2023 thanks to AI optimism and resilient earnings.
However, that advantage narrowed in late 2025 and 2026 as market leadership broadened beyond mega-cap tech. The Unicorn 30 Index—consisting of the largest late-stage venture capital-backed companies—meanwhile, rebounded sharply in 2025 and early 2026 as AI optimism shifted from public stocks to large private companies like OpenAI, Anthropic, and SpaceX SPCX. SpaceX went public in June 2026.
Source: Morningstar Direct. Magnificent 7—Equal weight composite of the seven "Magnificent 7" stocks, Unicorn 30 Index—Morningstar PitchBook Unicorn 30 Index, US Total Market—Morningstar US Total Market Index. Data as of June 30, 2026.
Semiconductor Stocks Race Higher on Relentless Chip Demand
Software continued to lag semiconductors in the second quarter, but it showed signs of recovery, rebounding from its April 2026 lows to finish modestly higher. US semiconductors were far from the only game in town, though, with the Morningstar Global Semiconductors Index surging over 50%, led by AI supply chain leaders Taiwan Semiconductor Manufacturing Company TSM and Korea-based SK Hynix and Samsung Electronics. That’s even better than the US index, which was up 47.4% for the quarter.
Source: Morningstar Direct. Data as of June 30, 2026.
Fixed Income
Credit Risk Pays Off in an Eventful Second Quarter
Amid geopolitical uncertainty and inflationary worries throughout the quarter, most fixed-income sectors eked out positive gains. Credit-sensitive sectors such as emerging-market debt, municipal bonds, and high-yield credit outperformed high-quality and long-duration bonds, like US Treasuries and agency mortgage-backed securities. Strong corporate fundamentals and a healthy economy continued to provide tailwinds for credit-focused strategies as spreads tightened further during the quarter.
Source: Morningstar Indexes. Data as of June 30, 2026.
The Yield Curve Shifted Higher in the Second Quarter
Interest rate volatility persisted during the quarter, and inflation concerns due to rising oil prices pivoted market expectations from multiple interest rate cuts in late 2026 to pricing in the probability of further tightening and federal-funds rate hikes. Treasury yields increased, with the short end of the curve increasing more than the long end, causing the yield curve to flatten.
Source: Macrobond. Data as of June 30, 2026.
Yields Across Fixed Income Remain Attractive
Yield changes across fixed-income sectors were a mixed bag in the second quarter. Investors’ risk appetite was relatively strong, which drove yield levels in riskier sectors, like high-yield bonds and emerging-market sovereign debt, lower during the quarter.
However, heightened inflation readings and increased expectations of rate hikes in 2026 caused Treasury yields and other rate-sensitive parts of the market, like US core bonds and mortgage-backed securities, to rise. Still, yields are above 10-year median levels across sectors.
Source: Morningstar Indexes. Data as of June 30, 2026.
Global Yields Continued to Climb
After a prolonged period of low interest rates following the global financial crisis, government-bond yields climbed in 2022. The onset of the Iran war in February 2026 brought inflation risks to the fore.
Central banks reinforced the "higher for longer" message at their June meetings. The European Central Bank raised its key rates by 25 basis points, while the Bank of Japan hiked to 1%, its highest policy rate since 1995.
Under new Chair Kevin Warsh, the US Federal Reserve’s projections shifted to signal hikes this year rather than the cuts the markets had expected, elevating 10-year yields.
Source: Macrobond. Data as of June 30, 2026.
Emerging-Markets Debt Bounces Back
After a turbulent March caused by the onset of the Iran war, emerging-market sovereign debt rebounded well and was the leading performer among fixed-income sectors in the second quarter. Emerging-market sovereign bond spreads narrowed to near 15-year record lows.
Despite this, absolute yield levels remain attractive relative to the past decade.
Many countries have curbed inflation effectively, experienced credit rating upgrades, and offered high real yields with their debt, contributing to the sector’s standout performance.
Source: Morningstar Indexes. Data as of June 30, 2026.
Corporate Credit Spreads Remained at Historically Tight Levels
Despite elevated market uncertainty, corporate credit spreads, an indicator of the broader economy’s health and investors’ confidence in credit markets, remained at historically tight levels on account of continued economic stability and strong corporate fundamentals. Corporate bond issuance has also slowed as the rise of private credit has diverted capital away from public bond markets.
Meanwhile, investor demand for yield remains strong as investors have poured into high-quality bonds. This supply/demand imbalance has been a key driver of spread compression.
Source: ICE Indexes. Data as of June 30, 2026.
Direct Lending Activity Slows During the Quarter
Direct lending volume and deal count dropped to three-year lows. Uncertainty spurred by a volatile market backdrop, geopolitical upheaval, and net outflows from retail products further slowed lending activity. Direct lenders provided an estimated USD 33.6 billion of new loans during the quarter, the lowest level since the second quarter of 2023 and down 55% from the first quarter of 2026. Deal count retreated to 154 transactions, the lowest since third-quarter 2023 and down 29% from 2026’s first quarter.
Source: Pitchbook.Data as of June 30, 2026.
Attractive Municipal-Bond Yields Drive Strong Demand
Municipal-bond yields, which have historically been an important driver of total returns, remain near their highest levels over the past decade. Investors seeking the benefit of tax-free income have taken notice, as municipal-bond vehicles (including separately managed accounts, exchange-traded funds, and mutual funds) have gathered assets at a near-record pace over the past 12 months through March 2026.
While the flow cycle can quickly reverse, municipal bonds remain a good option for investors looking for attractive tax-free income, diversification, and high-quality assets.
Source: Morningstar Direct, Morningstar Indexes. Data as of March 31, 2026.
Funds
Top- and Bottom-Performing Morningstar Categories
The technology Morningstar Category surged in 2026’s second quarter, far outpacing the returns of the next-best performers, such as small-growth, Pacific/Asia, and diversified emerging markets. On the flip side, equity precious metals and digital assets were the worst performers.
Equity energy experienced one of the sharpest reversals, falling from the top-performing category in the first quarter of 2026 to one of the weakest performers in the second.
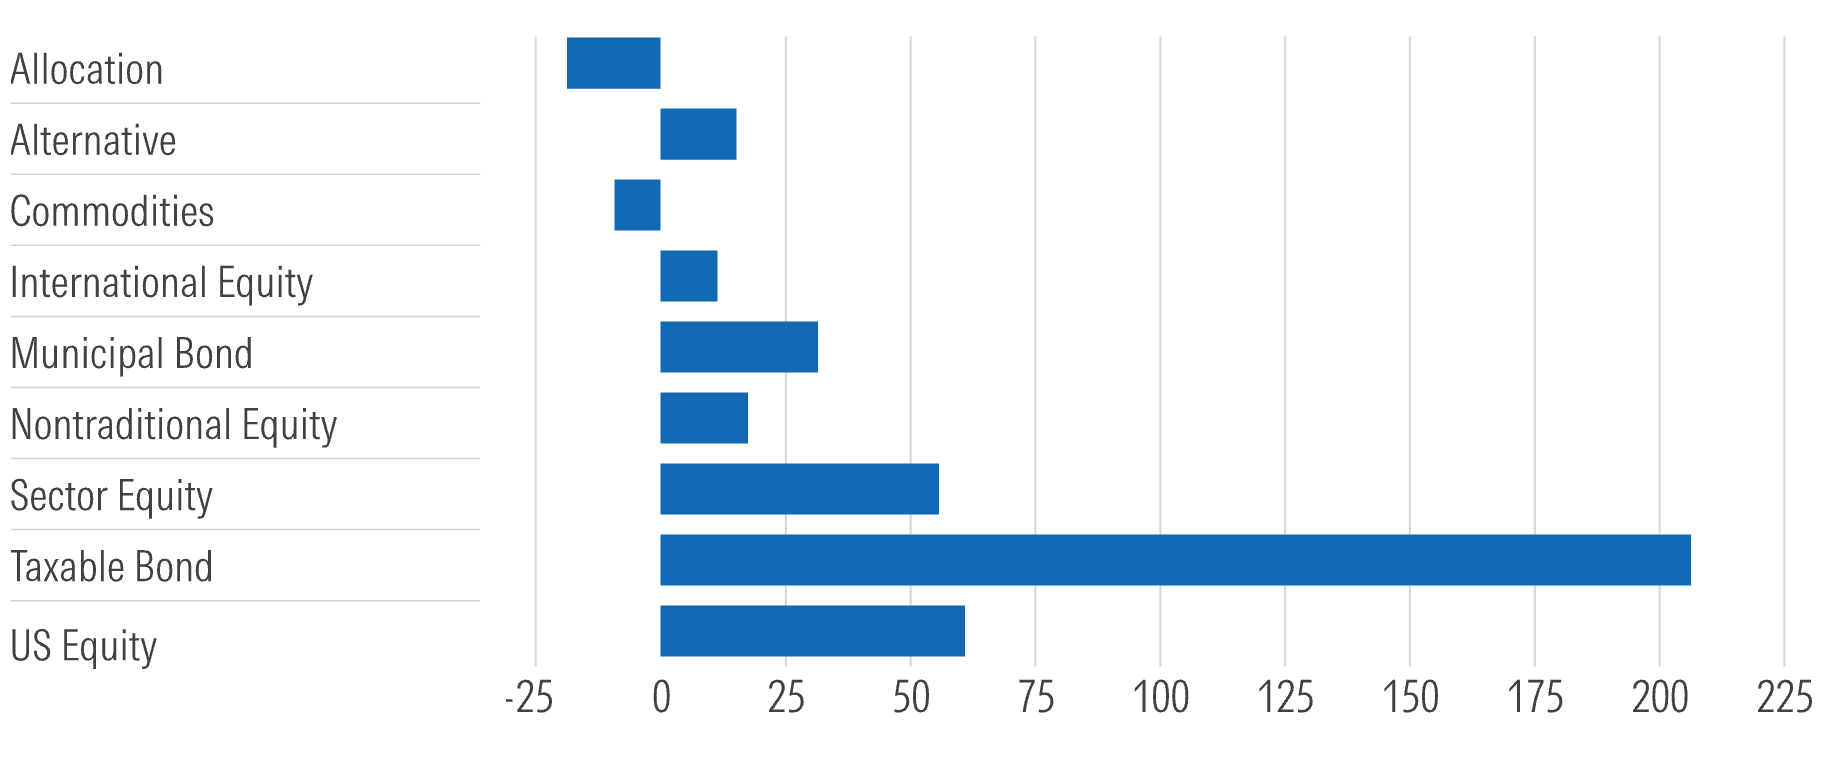
From a flows perspective, taxable-bond funds saw the largest inflows, while allocation and commodities funds were in outflows.
Trailing Quarter Flows by Category Group (USD Bil)
Top and Bottom Trailing Quarter Flows by Category (USD Bil)
Funds Holding SpaceX Prior to IPO Saw Strong May Inflows, June Outflows
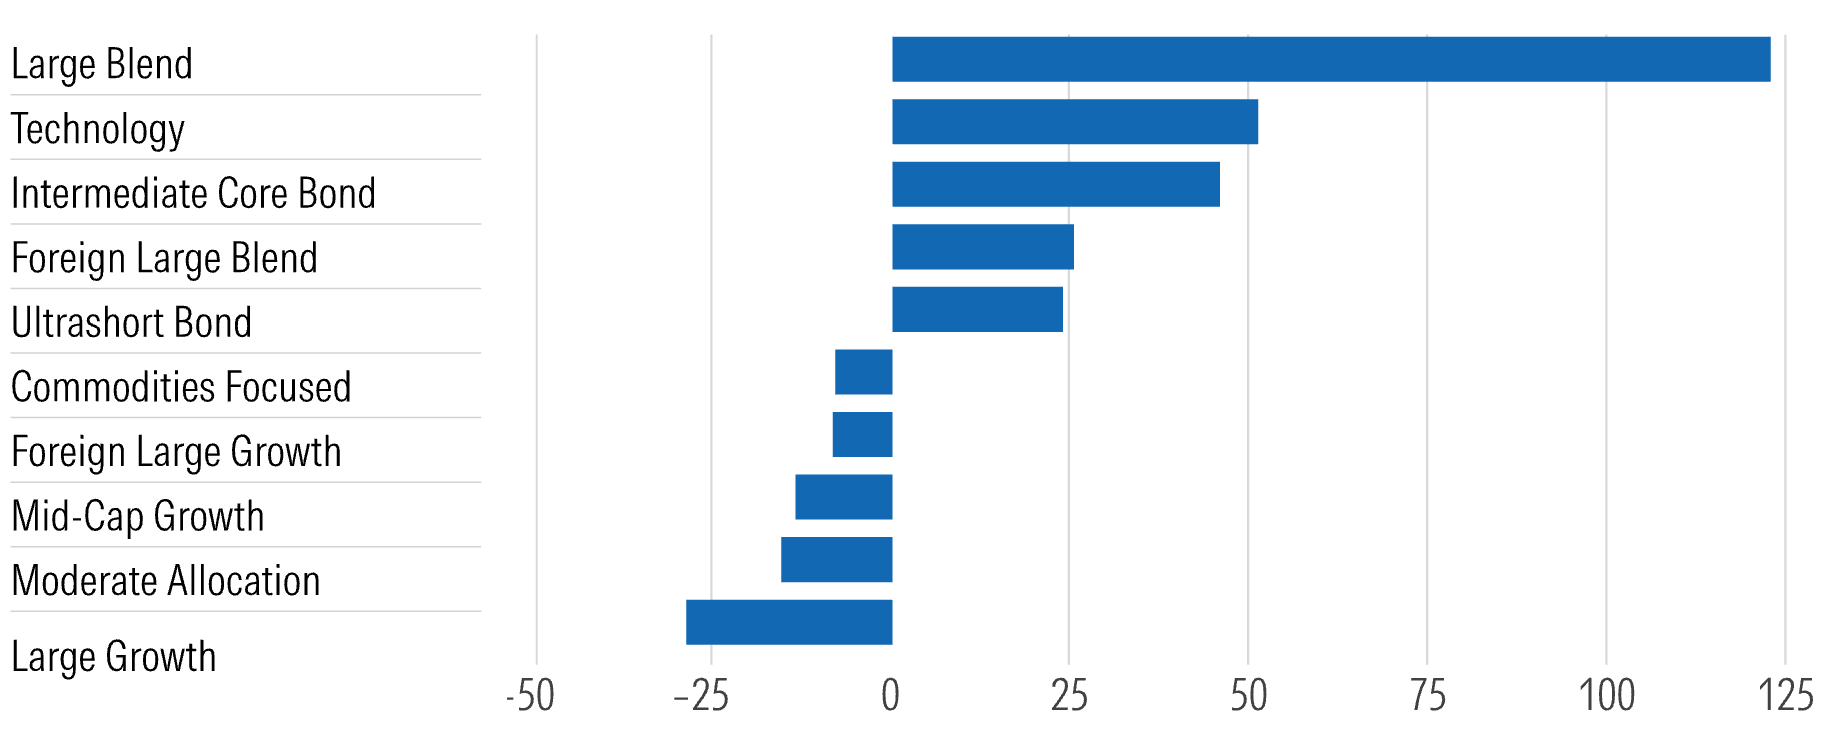
The second quarter saw a frenzy of interest in mutual funds and exchange-traded funds with exposure to Space Exploration Technologies Corp. Four notable funds built up massive stakes via private equity before the stock went public, enticing May inflows. The four funds raked in nearly USD 8 billion in that month alone, with monthly returns similarly spiking for the period. But just as quickly, those funds saw outflows, and returns varied greatly in June.
Source: Morningstar. Data as of June 30, 2026.
The Number of Digital Assets Funds Soars Despite an Asset Decline
The number of cryptocurrency products ballooned since regulators approved funds directly holding bitcoin in January 2024. More than 30 new funds launched in the digital assets Morningstar Category in the first half of 2026 alone.
However, assets are unevenly distributed and broadly declining. ETFs holding bitcoin account for 82% of the category’s assets but represent just 10% of its funds. It’s a complicated landscape, with a long tail of offerings spanning other altcoins as well as leveraged or inverse products. Investors should expect substantially different outcomes across the category.
Source: Morningstar's Guide to Digital Asset Funds. Data as of June 30, 2026.
Active Funds Show Stronger Link Between Flows and Rating Changes Than Passive Funds
A recent Morningstar study looked at US fund Morningstar Medalist Rating changes and their effect on fund flows from Jan. 1, 2011, to Dec. 31, 2025. Upgraded actively managed funds averaged net inflows of USD 42 million in the 12 months following a ratings change, and USD 174 million after 24 months. Outflows following downgrades were larger, at USD 116 million and USD 222 million over the same periods, respectively. Passive funds showed a less consistent link, but upgraded passive funds had more than twice the inflows of downgraded peers two years after a ratings change.
Source: The Link Between Morningstar Ratings and Fund Flows. Data as of Dec. 31, 2025.
Semiliquid Fund Assets and Net Inflows by Morningstar Category
Direct lending continues to be the largest semiliquid Morningstar Category despite weakening demand compared with March 2025. The venture capital category saw net inflows of approximately USD 8 billion over the 12 months through March 2026 as investors scrambled for pieces of companies like SpaceX, Anthropic, and OpenAI. That’s up from almost zero two years ago. SpaceX made its public market debut in June 2026 with a valuation near USD 2 trillion. Anthropic and OpenAI are also expected to go public in 2026 with valuations north of USD 1 trillion.
Source: Morningstar Direct, SEC filings. The State of Semiliquid Funds 2026. Data as of March 31, 2026.
Greater Disclosure Means Higher Fees
More private credit funds, particularly unlisted business-development companies, have begun disclosing incentive fees in their prospectus fee tables after Morningstar pushed for better transparency in early 2026. As a result, reported fees have risen, making comparisons with other funds more meaningful.
However, acquired fund fees and expenses, or AFFE, disclosures remain inconsistent, causing some private market fund of funds to appear less expensive than they actually are. For these vehicles, fund fees are likely much higher than is reported.
Source: Morningstar Direct; SEC filings. The State of Semiliquid Funds 2026. Public asset cohort includes funds with 75% or more of assets in actively-managed underlying strategies. Funds with 0.1% AFFE or lower excluded from each group to account for potentially low fund ownership on the PE side and to account for public fund-of-funds that own zero-cost share classes in order to charge fees at the fund-level. AFFE are intended to capture the operating expenses of underlying funds that parent funds pay.
Economic Indicators
US Gross Domestic Product Growth to Reaccelerate in Later Years of Our Forecast, While Inflation Recedes
We’re still expecting US GDP growth to slow a bit further through 2028, owing to decelerating AI spending, slower population growth, the ongoing drag from high interest rates, and other factors. Inflation should recede given the fading oil and tariff shocks as well as meager wage growth. Monetary easing is expected to drive a rebound in GDP growth over 2029-30.
Source: US Bureau of Economic Analysis, Morningstar.
Federal Reserve to Hike Once This Year, but Resume Cutting in 2027
Fed officials’ thinking has pivoted in a hawkish direction, and we now expect one federal-funds rate hike this year. But we expect five rate cuts over 2027-28, driving the federal-funds rate down to 2.50%-2.75% by the end of 2028, a net 1-percentage-point lower than current levels. This should help push longer-term interest rates down further, with the 10-year Treasury yield dropping to 3.25% by 2029. Lower rates will be needed to support continued healthy economic growth.
Source: Federal Reserve, Chicago Mercantile Exchange.
Monetary Policy Becoming More Restrictive in Major Economies
The market now expects two federal-funds rate hikes (0.5 points total) in 2026. In parallel, the European Central Bank and Bank of Japan are expected to continue their rate hike campaigns. The oil price shock is only one contributor among several fueling expectations of rate hikes. Hence, oil prices easing off their April/May highs hasn’t much altered expectations for key policy interest rates.
Source: Chicago Mercantile Exchange, Eurex Exchange, Japan Exchange Group.
Oil Prices No Longer Driving Elevated Bond Yields
When oil prices spiked in March, bond yields moved up as well, reflecting evaporating hopes of Fed rate cuts in 2026.
But oil has moved to the backseat as a driver of interest rates. The drop in oil prices in June did compress breakevens, but this was more than offset by higher real yields, now up more than 80 basis points since March altogether.
The latter reflects a view that the economy can handle tighter monetary policy than previously thought, partly driven by (in our view) an overreaction to recent strength in the job growth figures.
Source: Federal Reserve, Chicago Mercantile Exchange, Bureau of Economic Analysis.
Japan’s Era of Near-Zero Interest Rates Is Over as Currency Pressures Mount
Inflation isn’t the spur for rate hikes in Japan, as inflation there has dipped below 2% in 2026. But the Japanese yen sold off massively over 2022-24, and the Bank of Japan was only able to ease the downward pressure on its currency by committing to a campaign of monetary policy tightening, starting with balance sheet reduction and now moving to policy rate hikes. That’s pushed the 10-year yield up to 2.8%, a 30-year high.
Source: Bank of Japan, Statistics Bureau of Japan.
Inflation Has Increased, but Has Been Dwarfed by 2021-22 Surge
Overall inflation has generally moved up in major economies as a result of the energy price shock in 2026, but the impact has been tiny compared with the inflationary surge over 2021-22. This is partly because a number of other inflationary shocks (both demand and supply) were in play over 2021-22. But the energy shock itself also has been smaller, particularly in Europe, where natural gas prices increased more than 10-fold from the start of 2021 through the mid-2022 peak.
Source: Macrobond. Data as of June 30, 2026.
Oil Investors Still Optimistic That Tensions Will Defuse
Oil prices have rebounded recently by some USD 10 per barrel (West Texas Intermediate), as renewed fighting and ship attacks have curbed traffic in the Strait of Hormuz. But prices are still well below their April/May peaks. Investors have expected a limited-duration conflict since the outbreak of hostilities, as 12-month-out futures never touched USD 80 per barrel. The futures curve implies prices will average USD 81 per barrel in 2026 and USD 72 in 2027. We expect prices to fall further to USD 60 by 2029.
Source: Chicago Mercantile Exchange, Morningstar.
US Growth Exceptionalism Underpinned by Productivity
The US has been by far the star performer among major advanced economies in terms of economic growth since the pandemic. That’s been underpinned by superior productivity growth, where a disparity has existed for decades but has been magnified in recent years. US productivity growth has averaged about 1.9% per year since 2020, while the UK, Japan, and the Euro area have each seen growth at a mere 0.2%-0.3%. As AI use percolates into the broader economy, this gap may only widen.
Source: Organisation for Economic Co-operation and Development.
AI’s Success Doesn’t Doom Workers
There’s a view that if widespread AI automation happens, the share of GDP captured by labor will inevitably collapse. But history says differently. Two centuries ago, most workers were farmers. The automation of agriculture didn’t lead to immiseration. Rather, workers moved to other sectors, while the relative price of food collapsed, benefiting consumers. For more on this and other myths about AI’s economic impact, see our latest US economic outlook.
Source: Bureau of Labor Statistics. “Labor Force and Employment: 1800-1960” (Lebergott, 1966).
US Home Price Appreciation Remaining Weak
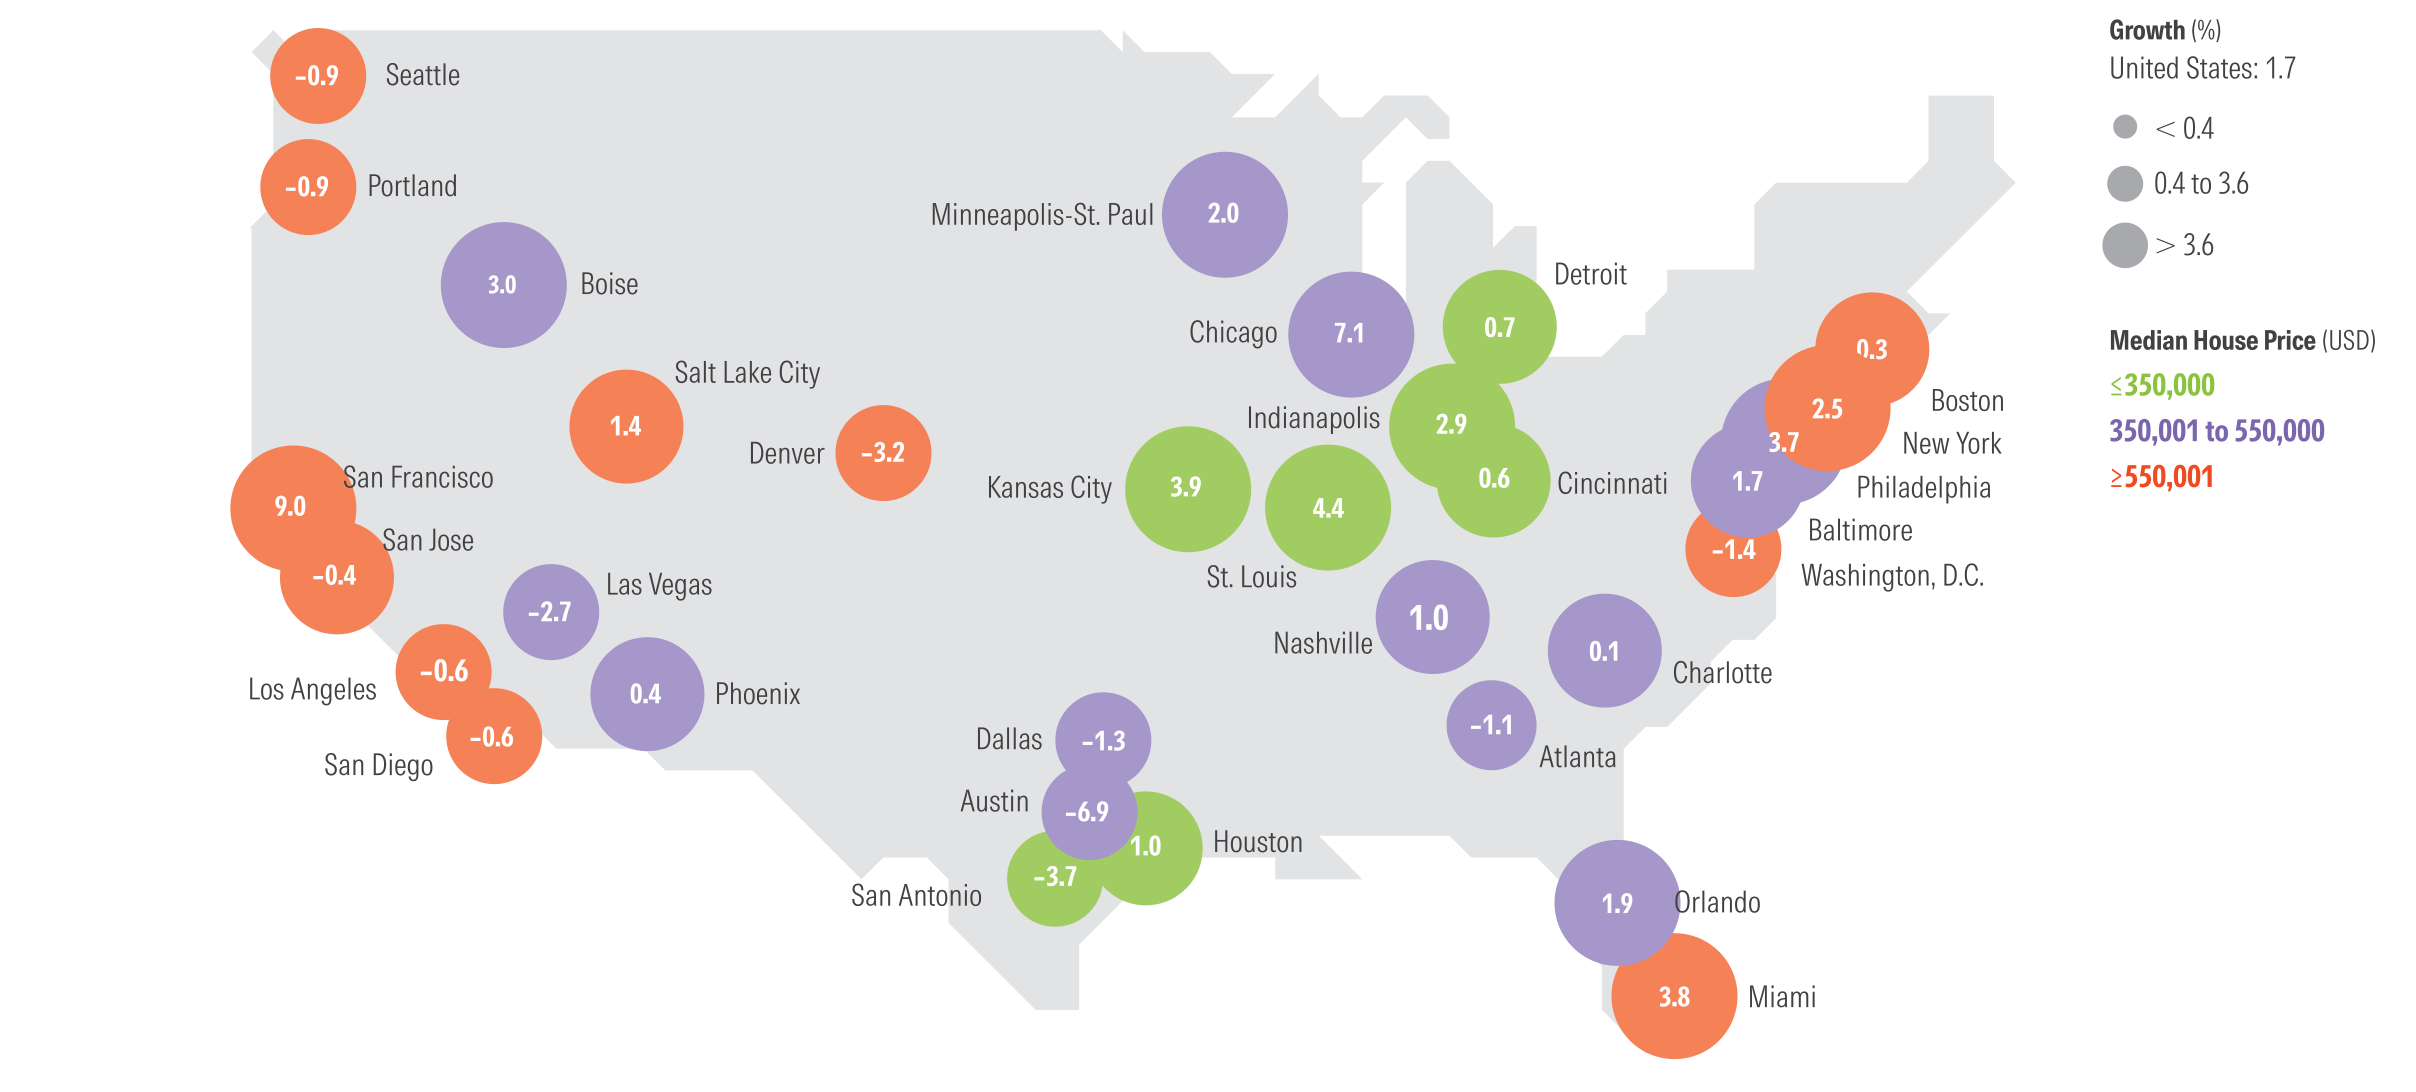
Home price growth has continued to weaken, standing at 1.7% year over year as of first-quarter 2026, down from 2.9% average growth in 2025 and 5.4% in 2024. The deceleration in home price growth has been broad, while Midwestern markets were more resilient. Sunbelt markets continue to see weak or negative growth, owing to vigorous building in response to the postpandemic runup in prices.
Year-Over-Year Price Growth (%) Q1 2026
Source: National Association of Realtors, Federal Housing Finance Agency.
Contributors
Sbidag Demerijan and Indira Fisher | Associate Analysts, Equity
Mary Marshall | Associate Analyst, Multi-Asset
Thomas Murphy | Associate Director, Fixed Income
Vedran Beogradlija | Analyst, Multi-Asset
Joe Bullard | Associate Analyst, Fixed Income
Index and Disclosure
“Morningstar” is used throughout this section to refer to Morningstar, Inc, and/or its affiliates, as applicable. Unless otherwise provided in a separate agreement, recipients of this report may only use it in the country in which the Morningstar distributor is based. Unless stated otherwise, the original distributor of the report is Morningstar Research Services LLC, a USA-domiciled financial institution.
This report is for informational purposes only, should not be the sole piece of information used in making an investment decision, and has no regard to the specific investment objectives, financial situation, or particular needs of any specific recipient. This publication is intended to provide information to assist investors in making their own investment decisions, not to provide investment advice to any specific investor. Therefore, investments discussed and recommendations made herein may not be suitable for all investors; recipients must exercise their own independent judgment as to the suitability of such investments and recommendations in the light of their own investment objectives, experience, taxation status, and financial position.
The information, data, analyses, and opinions presented herein are not warranted to be accurate, correct, complete, or timely. Unless otherwise provided in a separate agreement, neither Morningstar, Inc. nor the Research Group represents that the report contents meet all of the presentation and/or disclosure standards applicable in the jurisdiction the recipient is located.
Except as otherwise required by law or provided for in a separate agreement, the analyst, Morningstar, Inc, and the Research Group and their officers, directors, and employees shall not be responsible or liable for any trading decisions, damages, or other losses resulting from, or related to, the information, data, analyses, or opinions within the report. The Research Group encourages recipients of this report to read all relevant issue documents—a prospectus, for example—pertaining to the security concerned, including without limitation, information relevant to their investment objectives, risks, and costs before making an investment decision and, when deemed necessary, to seek the advice of a legal, tax, and/or accounting professional.
The report and its contents are not directed to, or intended for distribution to or use by, any person or entity who is a citizen or resident of or located in any locality, state, country, or other jurisdiction where such distribution, publication, availability, or use would be contrary to law or regulation or that would subject Morningstar, Inc. or its affiliates to any registration or licensing requirements in such jurisdiction.
Where this report is made available in a language other than English and in the case of inconsistencies between the English and translated versions of the report, the English version will control and supersede any ambiguities associated with any part or section of a report that has been issued in a foreign language. Neither the analyst, Morningstar, Inc., nor the Research Group guarantees the accuracy of the translations.
This report may be distributed in certain localities, countries, and/or jurisdictions (*territories”) by independent third parties or independent intermediaries and/or distributors (*distributors”). Such distributors are not acting as agents or representatives of the analyst, Morningstar, Inc. or the Research Group. In territories where a distributor distributes our report, the distributor is solely responsible for complying with all applicable regulations, laws, rules, circulars, codes, and guidelines established by local and/or regional regulatory bodies, including laws in connection with the distribution of third-party research reports.
Risk Warning
Please note that investments in securities are subject to market and other risks and there is no assurance or guarantee that the intended investment objectives will be achieved. Past performance of a security may or may not be sustained in future and is no indication of future performance. A security investment return and an investor's principal value will fluctuate so that, when redeemed, an investor's shares may be worth more or less than their original cost.
A security's current investment performance may be lower or higher than the investment performance noted within the report. Morningstar's Uncertainty Rating serves as a useful data point with respect to sensitivity analysis of the assumptions used in our determining a fair value price.
Conflicts of Interest
No material interests are held by the analyst or their immediate family with respect to the securities subject of this investment research report.
- In general, Morningstar will not hold a material interest in the security subject of this report. If a material interest is held by Morningstar, or if Morningstar owns a net long or short position in the security that is the subject of this report that exceeds 0.5% of the total issued share capital of the security, it will be disclosed at: https://www.morningstar.com/company/disclosures/holdings
- Morningstar employees' compensation is derived from Morningstar's overall earnings and consists of salary, bonus and in some cases restricted stock.
- Neither Morningstar nor its analysts receive compensation or material benefits from product issuers or third parties in connection with this report.
- Morningstar's overall earnings are generated in part by the activities of the Investment Management and Research groups, and other affiliates, who provide services to product issuers. Morningstar does not receive commissions for providing research and does not charge issuers to be rated.
- Morningstar employees may not pursue business and employment opportunities outside Morningstar within the investment industry (including but not limited to, working as a financial planner, an investment advisor or investment professional representative, a broker-dealer or broker-dealer agent, a financial writer, reporter, or analyst) without the approval of Morningstar's Legal and if applicable, Compliance teams. Morningstar may provide the investment product issuer or its related entities with services or products for a fee and on an arm’s length basis including software products and licenses, research and consulting services, data services, licenses to republish our ratings and research in their promotional material, event sponsorship and website advertising.
- Certain managed investments use an index created by and licensed from Morningstar, Inc. as their tracking index. We mitigate any actual or potential conflicts of interest resulting from that by not producing qualitative analysis on any such managed investment as well as imposing information barriers (both technology and non-technology) where appropriate and monitoring by the compliance department.
- Morningstar's Investment Management group has arrangements with financial institutions to provide portfolio management/investment advice, some of which an analyst may issue investment research reports on. In addition, the Investment Management group creates and maintains model portfolios whose underlying holdings can include financial products, including securities that may be the subject of this report. However, analysts do not have authority over Morningstar's Investment Management group's business arrangements nor allow employees from the Investment Management group to participate or influence the analysis or opinion prepared by them.
- Morningstar, Inc. is a publicly traded company (Ticker Symbol: MORN) and thus a security which is the subject of this report may own more than 5% of Morningstar, Inc.'s total outstanding shares. Please access Morningstar, Inc.'s most recent Proxy Statement and refer to the section titled "Security Ownership of Certain Beneficial Owners and Management" at: https://shareholders.morningstar.com/investorrelations/financial/sec-filings/default.aspx. A security's holding of Morningstar stock has no bearing on and is not a requirement for which securities Morningstar determines to cover.
Further information on Morningstar, Inc.'s conflict of interest policies is available from:
https://shareholders.morningstar.com/investor-relations/governance/Compliance-Disclosure/default.aspx
Also, please note analysts are subject to the CFA Institute's Code of Ethics and Standards of Professional Conduct.
For a list of securities which the Manager Research Group currently covers and provides written analysis on please contact your local Morningstar office. In addition, for historical analysis of securities covered, including their fair value estimate, please contact your local office.
For current Morningstar clients, please reach out to your respective Client Success Manager for more information on how you can best leverage this research within your firm. For all others, please reach out to our business development team at dtainsidesales@morningstar.com to learn more about Morningstar's various offerings and more details about how you can leverage this research.
For Recipients in Australia:
This Report has been issued and distributed in Australia by Morningstar Australasia Pty Ltd. (ABN: 95 006 654 445; AFSL: 240892). Morningstar Australasia Pty Ltd. is the provider of the general advice ("the Service") and takes responsibility for the production of this report. The Service is provided through the research of investment products. To the extent this Report contains general advice it has been prepared without reference to an investor's objectives, financial situation or needs. Investors should consider the advice in light of these matters and, if applicable, the relevant Product Disclosure Statement before making any decision to invest. Refer to our Financial Services Guide, or FSG, for more information at http://www.morningstar.com.au/fsg.pdf.
For Recipients in New Zealand:
This report has been issued and distributed by Morningstar Australasia Pty Ltd and/or Morningstar Research Ltd (together "Morningstar"). This report has been prepared and is intended for distribution in New Zealand to wholesale clients only and has not been prepared for use by New Zealand retail clients (as those terms are defined in the Financial Markets Conduct Act 2013).
The information, views and any recommendations in this material are provided for general information purposes only, and solely relate to the companies and investment opportunities specified within. Our reports do not take into account any particular investor's financial situation, objectives or appetite for risk, meaning no representation may be implied as to the suitability of any financial product mentioned for any particular investor. We recommend seeking financial advice before making any investment decision.
For recipients in Canada:
This research is not prepared subject to Canadian disclosure requirements.
For recipients in Europe:
This report is distributed by Morningstar Holland B.V. a wholly owned subsidiary of Morningstar, Inc. Morningstar Holland B.V. is not required to be regulated by the European Securities and Markets Authority for the provision of investment research data. The analysts involved in the creation of the report do not take into account any particular investor's financial situation, objectives, or appetite for risk, meaning no representation may be implied as to the suitability of any financial product mentioned for any particular investor. Registered address: Haaksbergweg 58, 9th Floor, 1101 82 Amsterdam, North Holland, Netherlands.
For recipients in India:
This report is issued by Morningstar Investment Research India Private Limited (formerly known as Morningstar Investment Adviser India Private Limited). Morningstar Investment Research India Private Limited is registered with SEBI as an Investment Adviser (Registration number INA000001357), as a Portfolio Manager (Registration number INP000006156) and as a Research Entity (Registration Number INH000008686). Morningstar Investment Research India Private Limited has not been the subject of any disciplinary action by SEBI or any other legal/regulatory body. Morningstar Investment Research India Private Limited is a wholly owned subsidiary of Morningstar Investment Management LLC. In India, Morningstar Investment Research India Private Limited has one associate, Morningstar India Private Limited, which provides data-related services, financial data analysis, and software development. The Research Analyst has not served as an officer, director, or employee of the fund company within the last 12 months, nor has it or its associates engaged in market-making activity for the fund company.
For Recipients in Hong Kong:
The report is distributed by Morningstar Investment Management Asia Limited, which is regulated by the Hong Kong Securities and Futures Commission to provide investment research and investment advisory services to professional investors only. Neither Morningstar Investment Management Asia Limited, nor its representatives, are acting or will be deemed to be acting as an investment advisor to any recipients of this information unless expressly agreed to by Morningstar Investment Management Asia Limited.
For Recipients in Japan:
This report is distributed by Morningstar Japan, Inc. for informational purposes only. Neither Morningstar Japan, Inc. nor its representatives are acting or will be deemed to be acting as an investment advisor to any recipients of this information.
For recipients in Korea:
The report is distributed by Morningstar Korea Ltd., which has filed to Financial Supervisory Service, for informational purposes only. Neither Morningstar Korea Ltd., nor its representatives, are acting or will be deemed to be acting as an investment advisor to any recipients of this information.
For recipients in Singapore:
This report is distributed by Morningstar Investment Adviser Singapore Pte Limited, which is licensed and regulated by the Monetary Authority of Singapore to provide financial advisory services in Singapore. Recipients of this report should contact their financial advisor in Singapore in relation to this report. Morningstar, Inc., and its affiliates rely on certain exemptions (Financial Advisers Regulations, Section 27(1)(e), Section 32, Band 32C) to provide its investment research to recipients in Singapore.
For recipients in the United Kingdom:
This report is distributed by Morningstar UK Ltd, a wholly owned subsidiary of Morningstar, Inc. Morningstar UK Ltd. is not required to be registered nor authorized by the Financial Conduct Authority for the distribution of investment research data. The analyst/s involved in the creation of the report do not take into account any particular investor’s financial situation, objectives, or appetite for risk, meaning no representation may be implied as to the suitability of any financial product mentioned for any particular investor. There are information barriers in place between Morningstar UK Ltd and Morningstar regulated entities based in the UK. Registered address: 1 Oliver’s Yard 55-71 City Road London EC1Y 1HQ.
About Morningstar Manager Research
About Morningstar Manager Research
Morningstar’s global manager research team conducts objective, qualitative analysis of managed investment strategies such as mutual funds and exchange-traded funds. Manager research analysts express their views through the Morningstar Medalist Rating, which takes the form of Gold, Silver, Bronze, Neutral, or Negative. The analysts arrive at a strategy’s Medalist Rating by assessing key areas including its management team and supporting resources (People Pillar), its investment approach and rationale (Process Pillar), and the investment organization backing the strategy concerned (Parent Pillar). The analysts juxtapose those assessments with the strategy’s cost in arriving at a final Analyst Rating, which expresses their conviction in the strategy’s ability to outperform a relevant benchmark index or category peers over a market cycle, adjusted for risk. The Morningstar Medalist Rating methodology is forward-looking in nature and applied consistently across geographies and markets. (The Medalist Rating is an opinion, not a statement of fact, and is not intended to be nor is a guarantee of future performance.)
About Morningstar Manager Research Services
Morningstar Manager Research Services combines the firm's fund research reports, ratings, software, tools, and proprietary data with access to Morningstar's manager research analysts. It complements internal due-diligence functions for institutions such as banks, wealth managers, insurers, sovereign wealth funds, pensions, endowments, and foundations. Morningstar’s manager research analysts are employed by various wholly owned subsidiaries of Morningstar, Inc. including but not limited to Morningstar Research Services LLC (USA), Morningstar UK Ltd, and Morningstar Australasia Pty Ltd.
©2026 Morningstar. All Rights Reserved. Unless otherwise provided in a separate agreement, you may use this report only in the country in which its original distributor is based. The information, data, analyses, and opinions presented herein do not constitute investment advice; are provided solely for informational purposes and therefore are not an offer to buy or sell a security; and are not warranted to be correct, complete, or accurate. The opinions expressed are as of the date written and are subject to change without notice. Except as otherwise required by law, Morningstar shall not be responsible for any trading decisions, damages, or other losses resulting from, or related to, the information, data, analyses, or opinions or their use. The information contained herein is the proprietary property of Morningstar and may not be reproduced, in whole or in part, or used in any manner, without the prior written consent of Morningstar. To order reprints, call +1 312-696-6100. To license the research, call +1 312 696-6869.