5 min read
The Advisor’s Cheat Sheet to Recession Indicators
Key economic signals and where markets stand today.

Economists often use imperfect historical information to form opinions about the economy’s direction. We often don’t know we’re in a recession until it’s well underway because the National Bureau of Economic Research adjusts the start date of a recession after the fact.
However, that doesn’t mean recessions have to catch advisors and clients by surprise. By monitoring potential signs of a recession, advisors can understand the direction of the economy and chart an appropriate course for their clients.
Here’s what Morningstar evaluates and where indicators stand. To get 50 pages’ worth of charts and graphs showing key market trends, download the full Markets Observer report.
What Are the Top Indicators of an Economy Recession?
Here are a few signals economists track to understand economic activity.
- Interest rates can indicate a recession in multiple ways. If interest rates rise too quickly or remain high for too long, it can slow economic growth and potentially lead to a recession. On the other hand, if the Federal Reserve begins cutting rates, it can be seen as an attempt to stimulate the economy in response to recessionary pressures.
- An inverted yield curve refers to when short-term bond yields climb above longer-term ones. This indicates an expectation of lower interest rates, and thus lower growth and inflation down the road. Inverted yield curves tend to precede recessions.
- Credit spreads show the yield difference between two fixed-income investments with the same maturity but different credit qualities. Negative credit spreads have predicted recessions historically, but it’s hard to pinpoint the exact start date, severity, or duration.
- Decline in real GDP: Consumers tend to tighten their belts in response to economic uncertainty. That could lead to lower economic output, layoffs, and economic contraction.
- High inflation reduces consumer spending power and the Federal Reserve may raise rates to keep inflation in check. However, hiking rates too aggressively can lead to a recession as consumers rein in spending.
- New housing starts and home prices: In a recession, home sales often decrease, which can lead to a decline in housing prices. But a recession isn’t the sole cause.
Where Do Recession Indicators Point Today?
US Stock Market Continues Expansion Despite Uncertainty
The US stock market was resilient in the third quarter despite rising bond yields, continued inflation uncertainty, and rising energy prices. This brings the current expansion to 33 months. Since 2022's downturn, the US market has gained 30.7% annualized and 108.8% total.
Not all stocks are going up, though. A few market leaders—mostly artificial intelligence stocks—have pushed benchmarks higher while many smaller stocks have comparatively struggled.
The chart below compares the downturns, recoveries, and expansions with recessions, the latter based on National Bureau of Economic Research data.
US Market Downturns, Recoveries, and Expansions
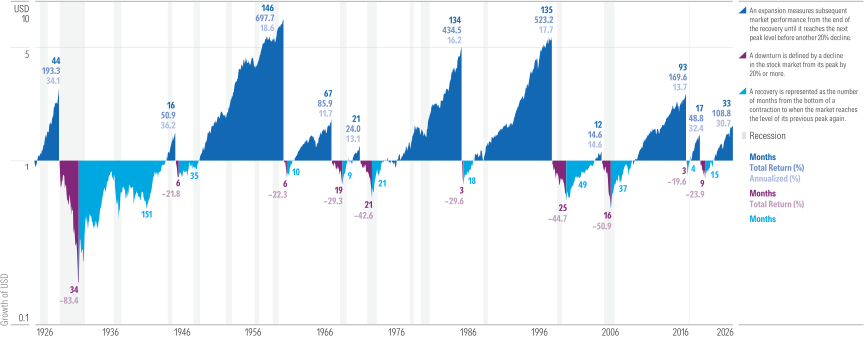
Source: Stocks—Ibbotson Associates SBBI US Large Stock Index. Recession data from the National Bureau of Economic Research. Data as of Sept. 30, 2026.
Federal Reserve to Resume Cutting Over 2027-28, Driving Yields Lower
The Fed has already hiked its benchmark rate once this year in September, and another hike is likely before the end of the year. We expect a return to rate cuts starting in the second half of 2027, driving the fed-funds rate down to 2.50%–2.75% by the end of 2028, a net 1.25 percentage points lower than the current 3.75%–4.00% range.
This should help push longer-term interest rates down further, with the 10-year Treasury yield dropping to 3.50% by 2029. Lower rates will be needed to support continued healthy economic growth.
The Yield Curve Shifts Higher
The US Treasury yield curve experienced a bear steepening in the third quarter, meaning long-term yields increased more than short-term rates and drove bond prices down. The movement was driven by renewed inflation fears from higher oil prices stemming from the Iran war, heavy debt-funding spending from AI data center construction, and the Federal Reserve's decision to resume tightening with a 25-basis-point rate hike in September.
Asymmetric Stories in the Bank-Loan Universe
Spreads on BB and B rated bank loans, which make up more than 90% of the Morningstar LSTA Leveraged Loan Index, were flat or tightened throughout the third quarter. However, spreads on CCC rated bank loans widened meaningfully, reaching levels last seen shortly after the 2020 pandemic selloff.
The last time CCC rated bank loans were this wide was in 2009. Fundamentals in this part of the market have been noticeably worse; many of these lower-rated issues were originated in 2021 and 2022 at lower rates and are approaching maturity with significantly higher default risk.
US GDP Growth to Reaccelerate in Later Years of Our Forecast, While Inflation Recedes
We’re still expecting US GDP growth to slow a bit further through 2028, owing to decelerating AI spending, slower population growth, the ongoing drag from high interest rates, and other factors. Inflation should recede given the fading oil and tariff shocks and meager wage growth. Monetary easing drives a rebound in GDP growth over 2029-30.
US Home Price Appreciation Remains Weak
Home price growth has settled down to a subdued pace of 2.1% for the second quarter of 2026, down from a 2.9% average growth rate in 2025 and 5.4% in 2024. The deceleration in home price growth has been broad, though Midwestern markets have been more resilient. Sunbelt markets continue to see weak or negative growth, owing to excess supply resulting from vigorous building in response to the post-pandemic boom in these markets.
Year-Over-Year Price Growth (%) Q2 2026
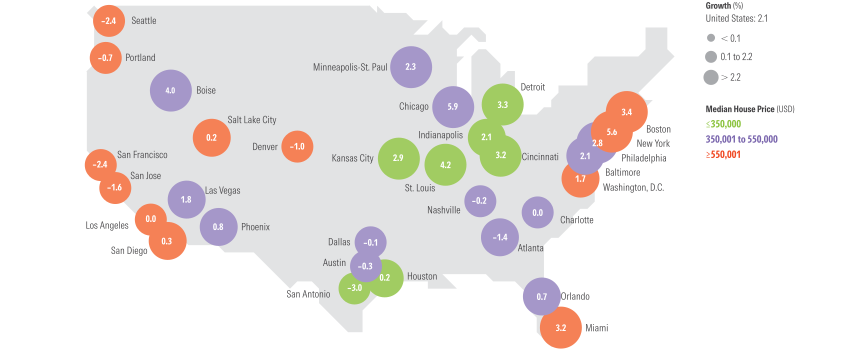
Source: National Association of Realtors, Federal Housing Finance Agency.
What Should Advisors Do in a Recession?
Diversified portfolios should help clients reach their long-term goals and withstand downturns in the meantime. That perspective isn’t always reassuring for clients worried about a recession.
Our behavioral finance researchers created a checklist for guiding clients through a recession.
- Be the go-to source for advice. Create content to answer common client questions in simple terms. Then share through meetings, emails, and social media.
- Gauge client expectations. Remind overly optimistic clients that market downturns are inevitable and unrealistic expectations could lead to panic. Remind pessimistic clients about the value of staying the course.
- Create concrete action plans. Ask clients to identify triggers that might cause them to tinker with portfolios. Ask them to create an “If, then” list to identify what to do if those triggers happen, then sign it to commit to the plan.
For a deeper dive into our outlook for the US economy, including detailed forecasts on GDP growth, inflation, unemployment, and sector-specific trends, explore our comprehensive US Economic Outlook report.