
6 min read
US and Canada Airline Industry Analysis: Key insights

In Q2 of 2026, only 0.4% more passengers have boarded a plane in the US than at the same point in 2025. Air passenger growth now trails retail sales. Consumer sentiment is slumping across income brackets and a fuel spike in March sent airline valuations into a brief collapse before the group rallied to trade above its historical average.
Read the full Q2 Morningstar US and Canada Airlines Pulse for a breakdown of industry-wide trends, North American airline stocks and risk factors, download the report.
Fuel Costs Are Driving Industry Uncertainty Again
Fuel is the single largest variable cost most airlines carry, sometimes reaching one-third of all operating expenses. It spiked again in early 2026.
US Gulf Coast kerosene-type jet fuel reached $2.63 per gallon as of June 30, 2026, pushing fuel cost per available seat mile to its highest level since 2022 across every carrier we cover. American ran the highest fuel cost per seat mile at $0.0596, followed by United at $0.0585. Air Canada ran the lowest at $0.0437.
Airlines experience fuel costs more or less in lockstep, and they are generally successful at passing them on to customers in ticket prices. But the pass-through is not instant, and that lag is where the risk sits.
Fuel Prices Spiked Again in Early 2026, Fueling Industry Demand Uncertainty
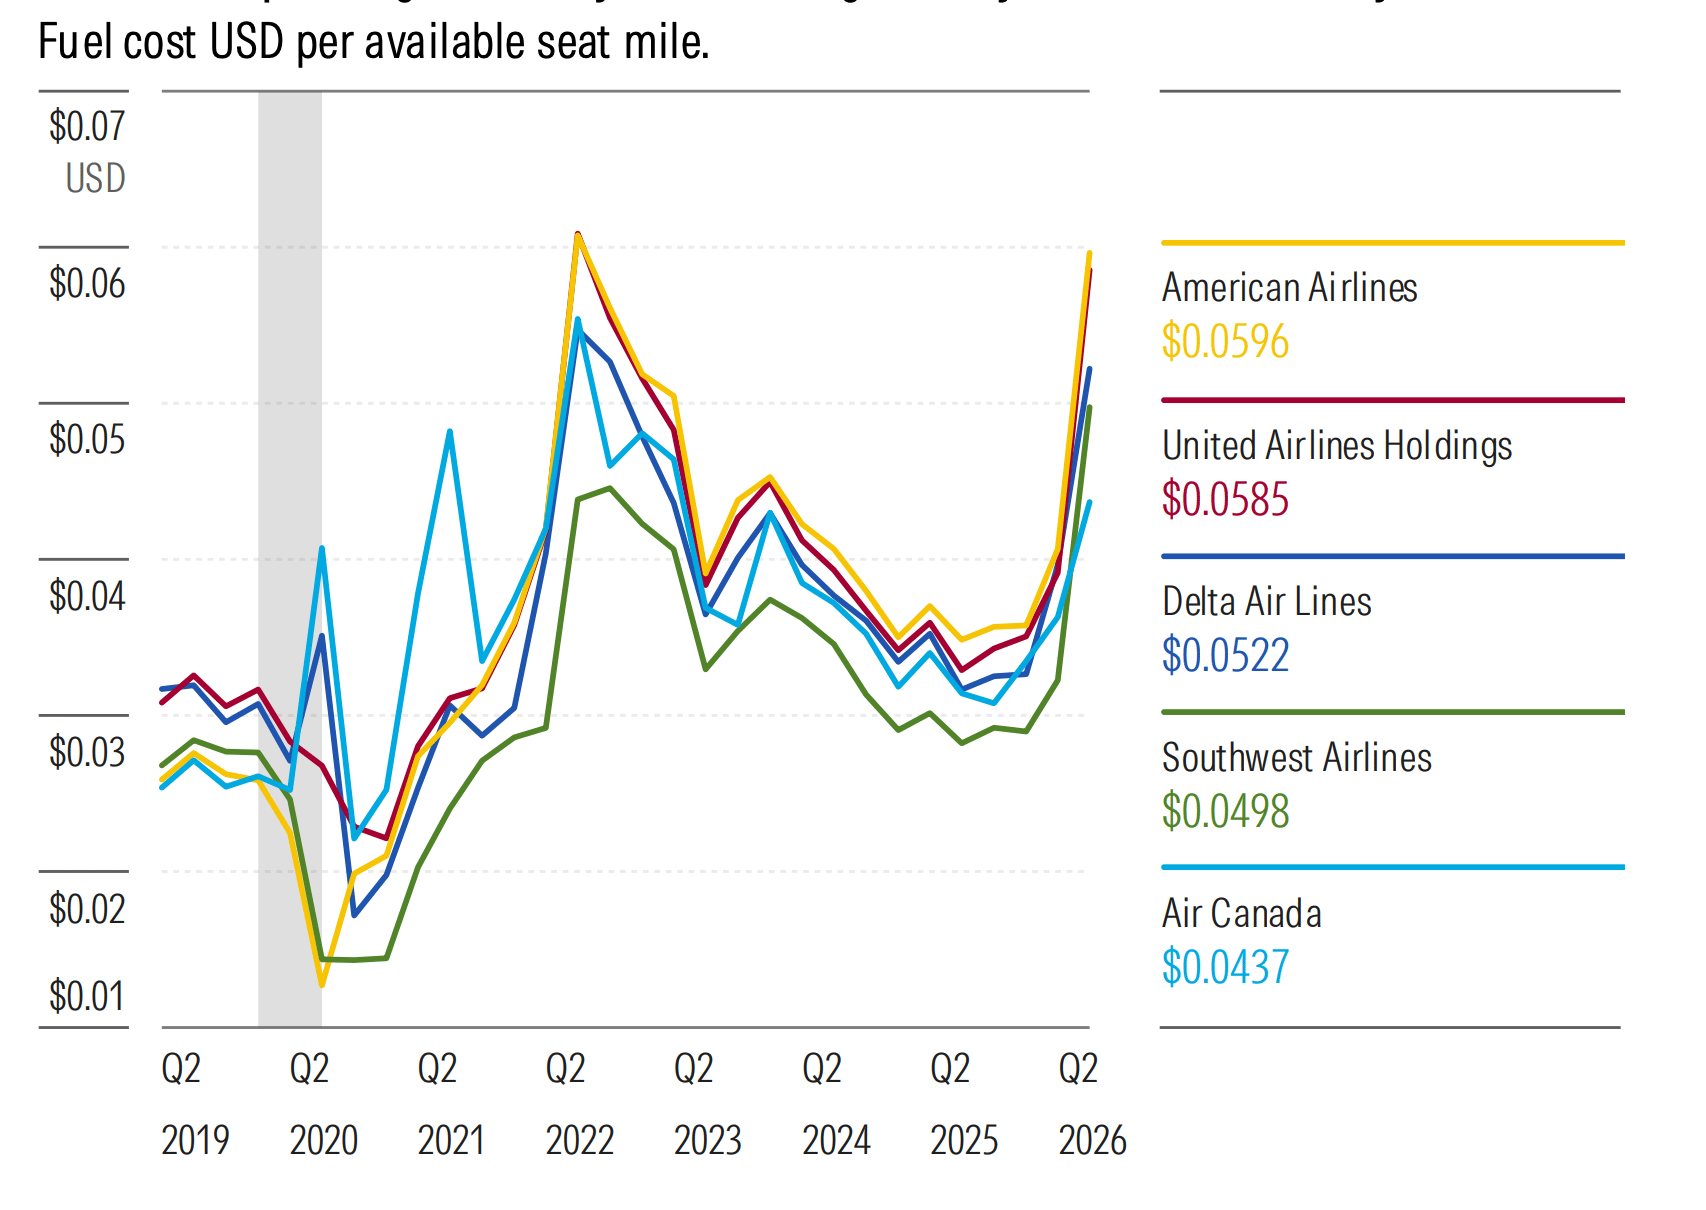
Source: Company filings, Morningstar analysis. Data as of July 24, 2026.
How do Fuel Prices Affect Airline Operating Costs and Ticket Prices?
Airlines publish schedules and fares several months forward, priced against expected fuel costs and futures contracts. In the markets where they operate, every airline sees the same fuel cost information.
That creates a specific vulnerability. The closer a flight gets to departure, the higher the share of its seats already sold at previously published prices. A sudden fuel shock can meaningfully change profitability, for better or worse, on flights an airline can no longer reprice.
Some carriers use financial and operational hedges to smooth the effect within a given period. Fleet composition matters too. Southwest posts the best operating fuel efficiency at 84.75 available seat miles per gallon, with Air Canada next at 78.10 and American last at 67.35.
Airline market share remains stable
For all the volatility in fuel and valuations, competitive position has barely moved.
Available seat miles, the product of seats on planes times the miles they flew, measure the capacity an airline puts into service. Global ASM share shows international airlines resuming course to reclaim capacity share from US and Canadian carriers after their slower post-pandemic recovery.
Passenger share tells a similar story. Since 2016, United has gained nearly four percentage points of passenger share within the Big Four, while Southwest has lost just under two. Over the same 10 years, low-cost carriers gained three points on regional carriers.
Capacity share follows the same pattern. Low-cost carriers took 2.5 points from legacy and regional operators, and Southwest's capacity share has held steady at roughly 13%.
Revenue share is where the Big Three separated themselves. Premium segmenting pulled about three points of revenue share away from regionals and Southwest and toward the legacy carriers. Same passengers, better monetization.
Within the Big Four US Airlines, Passenger Share Also Remains Quite Stable
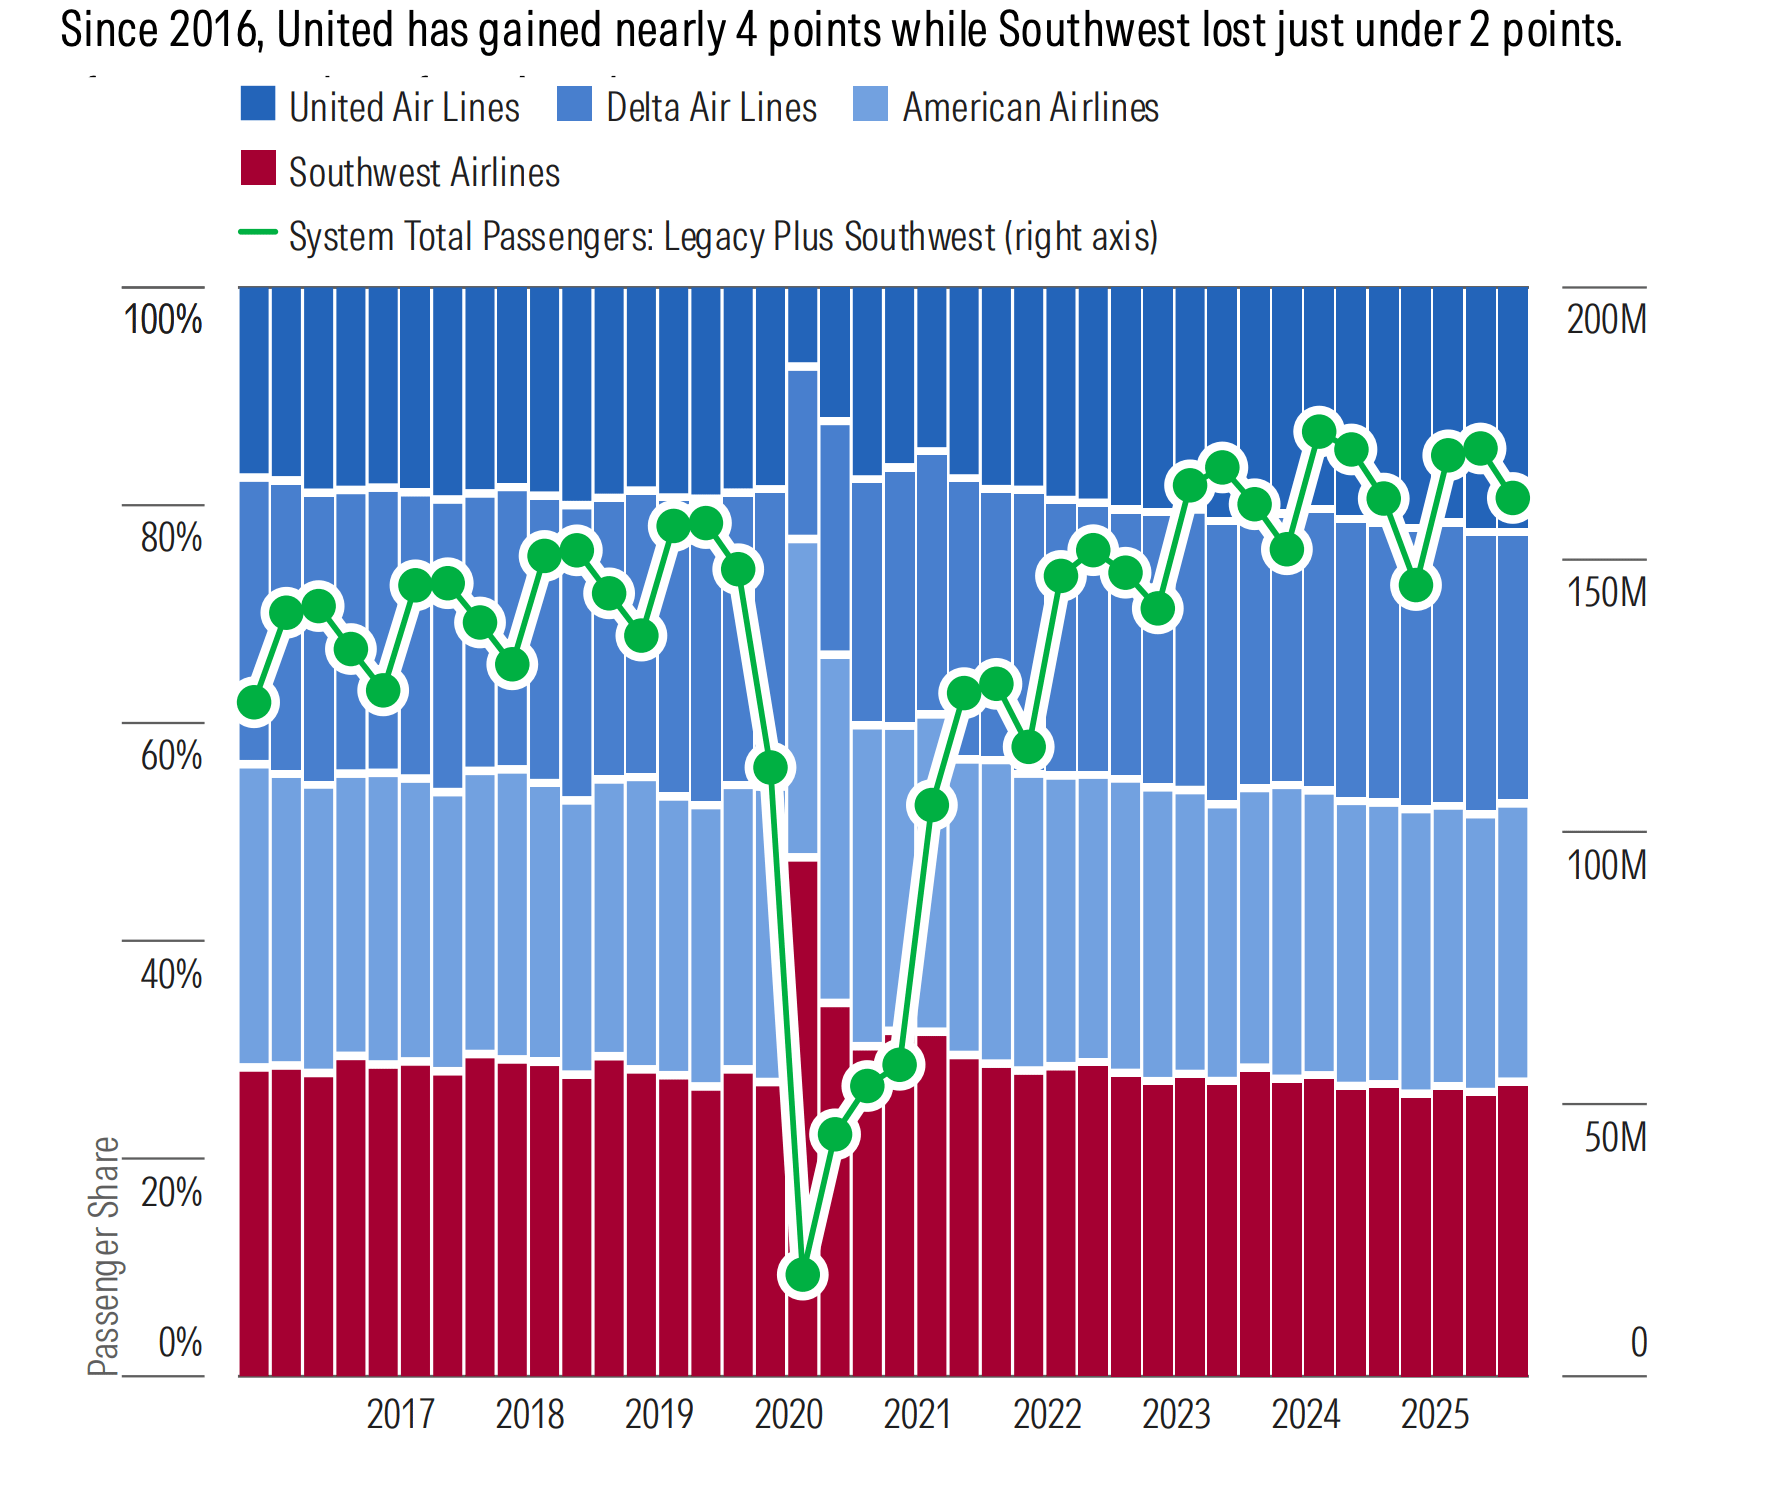
Source: US Department of Transportation. Data as of July 24, 2026.
What Are Key Trends Shaping the Airline Industry?
Passenger growth has essentially flattened
US passenger volume in 2026 closely resembles 2025. Just 0.4% more travelers have boarded a plane so far this year.
The international picture splits. US citizens originating international air travel are on pace to match both 2024 and 2025. Non-US citizen arrivals are the weak spot, lagging 2019, 2024 and 2025 across the first half of the year.
For more on how market trends are affecting hotels, online travel and cruise lines, download the Travel Services Pulse report.
So Far in 2026, Just 0.4% More Passengers Have Boarded a Plane Than in 2025
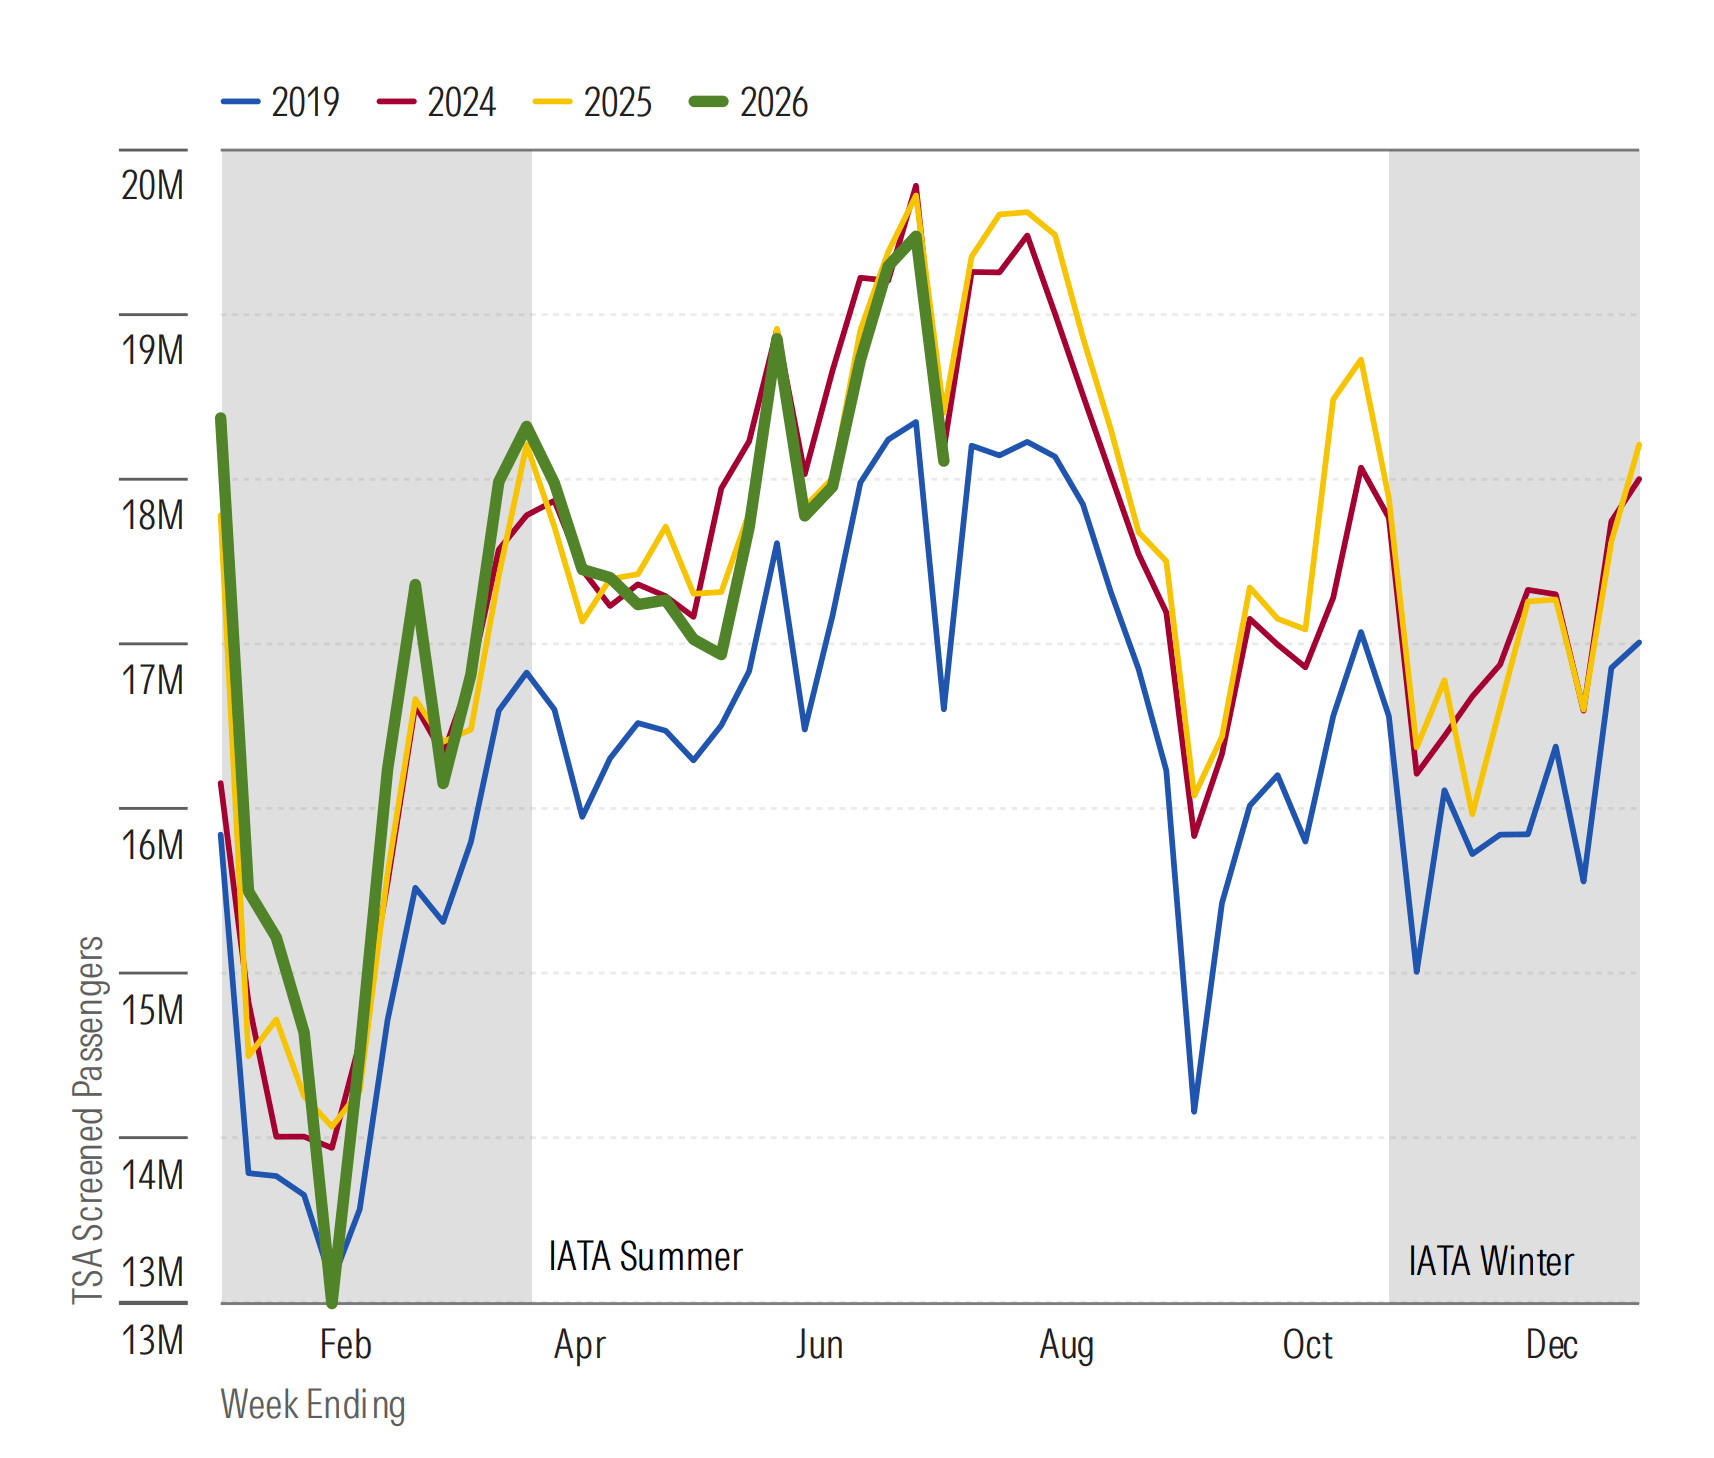
Source: US Department of Homeland Security. Data as of July 15, 2026.
Load factors are notching downward
Load factor, the share of available seats sold, peaked in 2023 at 2019's 86.6% and slipped below the pre-pandemic average of 85% in 2025. Low-cost carriers pulled it down until Spirit exited in May 2026. The Big Three now lead US carriers at 82.01%. Canada tops everyone at 85.22%.
Yields are up, but the pricing story is uneven
Passenger revenue yield metrics show where airlines are competing hardest for customers. North American airlines have averaged revenue yields near $0.165 per revenue passenger mile since 2022, and the trailing figure has climbed to 17.60 cents.
Delta leads at $0.2338 per mile, followed by Southwest at $0.2256, American at $0.2233 and United at $0.2213. Air Canada sits at $0.1713 and low-cost carriers excluding Southwest well below at $0.1232.
Two stories sit inside those numbers.
Southwest's quest for profit. Caught between the Big Three and ultra-low-cost carriers, Southwest's lowest fares long carried more perks than the competition, including two free checked bags. Before introducing assigned seats and a basic fare on par with competitors', the airline stuck to pricing discipline and traded load for yield from the fourth quarter of 2024 through the third quarter of 2025. Its yield now resembles the industry average and far outpaces other low-cost carriers.
American's marketing mishap. In the second quarter of 2023, American reduced incentives and awards for corporate travel customers booking through global distribution systems. The goal was more direct bookings, lower commissions and new revenue segmentation opportunities.
Customers revolted. They moved their business to United and Delta, and American estimates it lost $1.4 billion in revenue in 2024. The airline undertook an "apology tour" to win the accounts back. First-quarter 2025 showed early signs of recovery in American's yield relative to Delta and United. Those signs have not persisted.
American Ceded Pricing Ground Amid Its Loss of Some Corporate Accounts
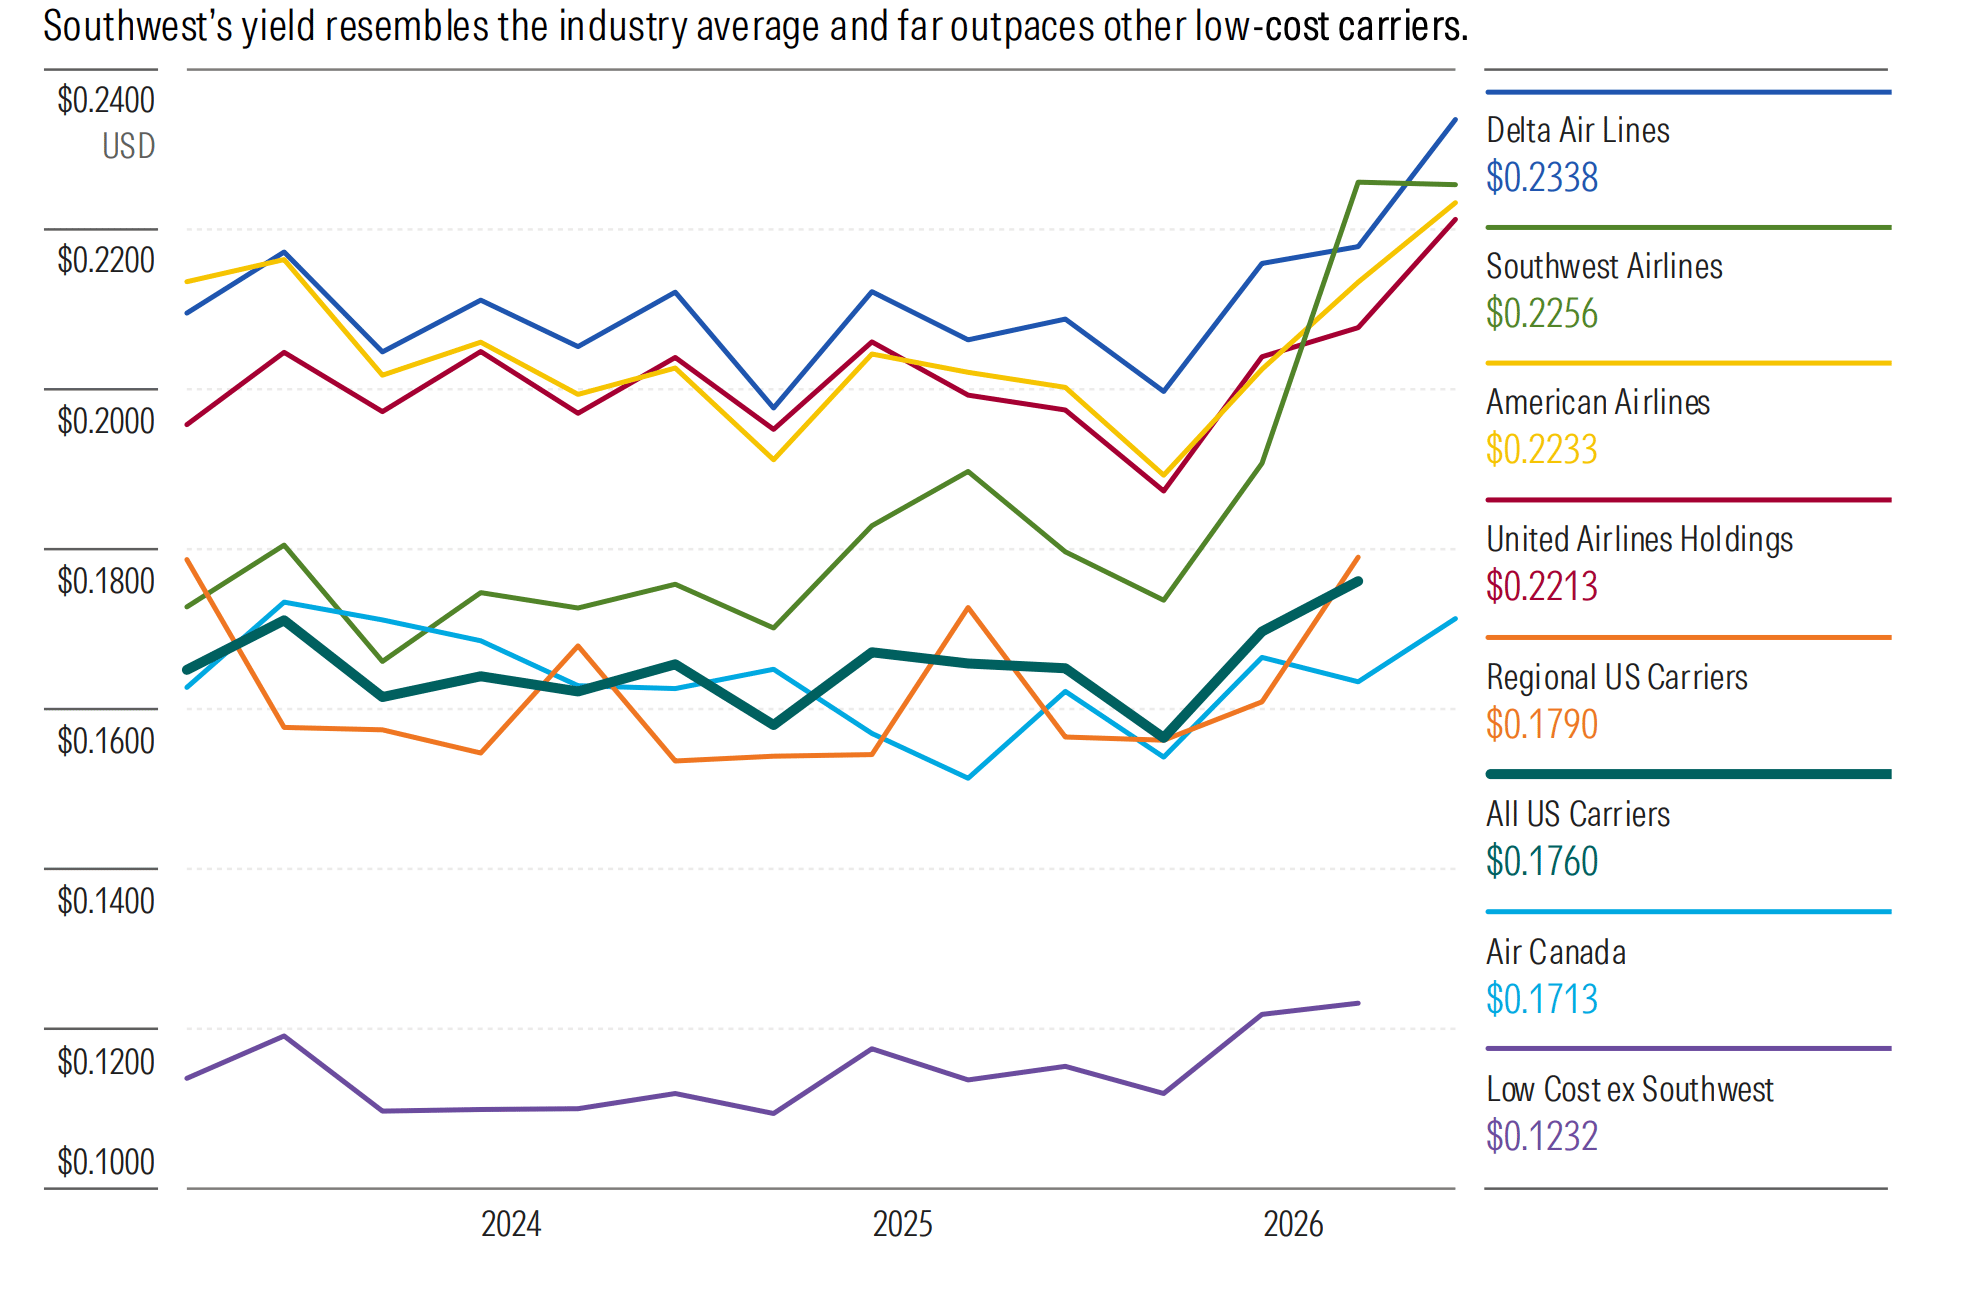
Source: Company filings, Morningstar analysis. Delta, United and American include operating subsidiaries. Data as of July 24, 2026.
Structural unit costs keep climbing
Strip out fuel and one-time items and the underlying cost base is still rising.
Since 2019, the industry has added nearly $0.03 per mile in structural unit costs. The 2019 average across the Big Four plus Air Canada was $0.104 per mile. In the trailing four quarters it reached $0.131.
That 28% increase equated to $37 billion of operating expense in 2024, or 12% of total industry operating cost. Updated labor and maintenance contracts are the primary driver.
Delta carries the highest unit costs at $0.1432 per mile, followed by American at $0.1393. Air Canada looks lowest at $0.1049, but that reflects capacity rescaling that lags its US peers, which brings higher fixed unit costs and wider seasonal swings.
Fleet age compounds the picture. Delta's oldest jet dates from 1989 and half its fleet is more than 15 years old, weighted toward regional-size aircraft that pull down average fuel economy. American's fleet is younger, with its oldest jet from 1998 and only a third over 15 years, but its Latin America exposure means more short flights and fewer efficient long-haul cruises.
Competitive Advantages and Risks Facing Major Airlines
Investors have rerated North American airlines that can offer segmented travel products. Our entire coverage list now trades above the industry's historical average EBITDAR multiple.
In our view, American and Delta's valuation premia are overdone. Industry tailwinds such as constrained supply and robust demand have buoyed these operators and favored their premium customer segmentation. Those tailwinds remain in place. But a softening of demand at the same time supply constraints ease would not bode well for industry profitability, and American and Delta have the most at stake.
None of the five airlines in our coverage carries an economic moat rating. Our Economic Moat Ratings identify companies with lasting competitive advantages that may earn high returns on capital for years to come.
Four of the five carry an Uncertainty Rating of Very High, with Air Canada at High. The Morningstar Uncertainty Rating reflects the level of risk associated with a security's future cash flows and earnings. The greater the uncertainty rating, the wider the margin of safety investors may want around a stock's fair value estimate. Advisors should be especially aware of a client's risk appetite when considering more volatile stocks.
Neither rating is a definitive indicator on its own. Both belong inside a larger investment selection process. With Direct Platform, professional investors have access to the full breadth of our equities data and investment research tools.
Outlook for US Airlines
Our near-term forecast remains reasonably constructive for most industry players, particularly premium operators.
- Delta and United have successfully segmented air travelers to attract recurring premium revenue, especially in the post-pandemic environment.
- We forecast Southwest will benefit from its recent updates to merchandising and more strategic yield management, mounting a comeback of sorts.
- In our view, ongoing cost growth without ultra-premium segmentation will leave American and Air Canada behind.
Premium operators claim the lion's share of industry profit. Low-cost and regional carriers already border on breakeven, a dynamic that ended in Spirit's exit from the market in May 2026.
Of the five US and Canadian airlines in our coverage, none have an economic moat rating. Our Economic Moat Ratings indicate companies with lasting competitive advantages that may earn high returns on capital for years to come.
Securities mentioned in this report:
- Southwest Airlines LUV
- American Airlines AAL
- Delta Air Lines DAL
- United Airlines Holdings UAL
- Air Canada ACDVF
As constrained supply conditions even out, we forecast a return to more normal operating conditions, which will erode industry profitability. When airplanes and personnel are no longer a constraint, we expect the incremental incentives airlines constantly operate under to return to the fore, leading to competition over prices and market share.
For advisors, the through line is straightforward. Investors are extrapolating a great deal of future profitability from present market conditions. Our valuations suggest a softer picture industrywide once supply constraints ease.
For a deeper look at our airline industry analysis, download the Q2 2026 US and Canada Airlines Pulse.