
Top 10 Holdings of Our Ultimate Stock-Pickers' Index

/s3.amazonaws.com/arc-authors/morningstar/e03383eb-3d0b-4b25-96ab-00a6aa2121de.jpg)
Each year, fund investors would like to see the manager of the actively managed funds they own beat the market, but they've been left wanting for well over a decade. The lack of consistent outperformance by large-cap active managers (the main contributors to the Ultimate Stock-Pickers concept) has been well documented by Morningstar's Active/Passive Barometer. It’s a cutthroat world out there for active managers. For the 20 years ending December 2021, just 8.2% of active funds in the large growth category have managed to survive and outperform their average passive peers.
Actively managed U.S. growth funds struggled during the year through December 2021. Success rates among large-, mid-, and small-cap growth managers that survived and outperformed their average passive peers over the 10-year period was only 26%. Long-term success rates were lowest among U.S. large-cap funds compared with foreign-stock, real estate, and bond funds.
In 2021, the coronavirus selloff and subsequent rebound tested the narrative that active funds are generally better able to navigate market volatility than their passive peers. But the data showed that there’s little merit to this notion. Across all 20 categories we examined, just 45% of the nearly 3,500 active funds included in our analysis survived and outperformed their average passive counterparts.
The cheapest funds succeeded about twice as often as the priciest ones (a 35% success rate versus a 17% success rate) over the 10-year period ended Dec. 31, 2021. This not only reflects cost advantages but also differences in survival, as 68% of the cheapest funds survived whereas only 54% of the most expensive funds did so.
Over the long haul, actively managed U.S. large-cap equity funds have generally succeeded less often than active U.S. mid- and small-cap funds. Over the decade through Dec. 31, 2021, this narrative continued. Over that span, nearly 10.4% of active large-cap funds lived and outperformed their average passive peers versus 25.3% and 29.4% for active mid-cap and small-cap funds, respectively.
We devised the Ultimate Stock-Pickers concept as a stock-picking screen, not as a guide for finding fund managers to add to an investment portfolio. Our primary goal has been to identify a sufficiently broad collection of Stock-Pickers who have shown an ability to beat the markets over multiple periods (with an emphasis on longer-term periods). We then cross-reference these managers' top holdings, purchases, and sales against our own stock analysts' recommendations regularly, allowing us to uncover securities that investors might want to investigate further. There will always be limitations to our process. We try to focus on managers that our fund analysts cover and on companies that our stock analysts cover, which reduces the universe of potential ideas that we can ultimately address in any given period. This emphasis is also the main reason we focus so much attention on large-cap fund managers, as they tend to be covered more broadly on the fund side of our operations and their stock holdings overlap more heavily with our active stock coverage. That said, by limiting themselves to the largest and most widely followed companies, our top managers may miss out on some big ideas on small companies that have the potential to generate greater outperformance in the long run.
Overall, 2021 was a challenging and volatile year for stocks, given the COVID-19 pandemic and inflationary pressure experienced. After a sharp drop in the second quarter, the market initially bounced back as increasing vaccination rates seemed to steady a wobbly global economy. And just as the market was looking to slowly recover as pandemic restrictions were lifted and a return to normality began, the Russian invasion of Ukraine threw another wrench into the global economy, elevating energy prices and creating inflationary pressures that have impacted food and energy markets. But with the omicron variant surfacing, the conclusion to that recovery seems to be on hold. The first quarter of 2022 has been defined by a tumultuous market, as selloffs in tech have reflected a depression in the aggregate market and fears of a potential recession linger. The Fed has already raised the federal-funds rate to a range between 1.5% and 1.75%, from near-zero levels that had been in place since the early days of the pandemic. 2022 continues to maintain a high degree of uncertainty given the inflationary pressure and potential of a recession.
Our own Morningstar Ultimate Stock-Pickers index has not been immune to the trend of underperformance of active management, as it still trails the S&P 500 index year to date.
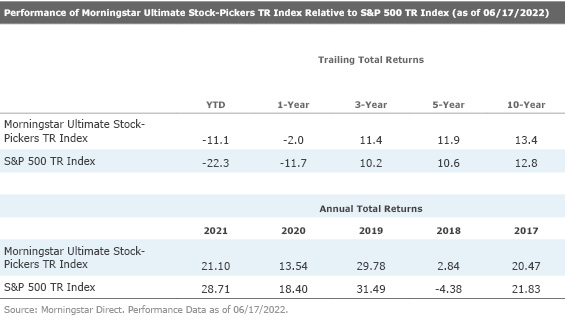
Aside from tracking the holdings, purchases, sales, and the ongoing investment performance of our Ultimate Stock-Pickers, we also follow the makeup and results of the Morningstar Ultimate Stock-Pickers TR Index. For those who may not recall, the Ultimate Stock-Pickers index was set up to track the highest-conviction holdings of 26 different managers, a list that includes our 22 top fund managers as well as the investment managers of four insurance companies—Berkshire Hathaway BRK.A/BRK.B, Markel MKL, Alleghany Y, and Fairfax Financial FRFHF. It is constructed by taking all the stock holdings of our Ultimate Stock-Pickers that are not only covered by Morningstar stock analysts but have either a low or medium uncertainty rating and ranking them by their Morningstar Conviction Score. The Morningstar Conviction Score is made up of three factors:
- The overall conviction (number and weighting of holdings).
- The relative current optimism (holdings being purchased).
- The relative current pessimism (holdings being sold).
The index comprises three sub-portfolios—each containing 20 securities—that are reconstituted quarterly on a staggered schedule. As such, one third of the index is reset every month, with the 20 securities with the highest conviction scores making up each sub-portfolio when they are reconstituted. This structure means that the overall index can hold anywhere between 20 and 60 stocks at any given time (because some stocks may remain as the highest-conviction score holders in any given period, meaning there can be overlaps in the holdings, reducing the total number of different stocks held). In reality, the index is usually composed of 35 to 45 securities, holding 35 stocks in all at the end of November. These stocks should represent some of the best investment opportunities that have been identified by our Ultimate Stock-Pickers in any given period. It can also have more concentrated positions than one might find in a typical mutual fund. The size and concentration of the portfolio do change, though, as this is an actively managed index that tries to tap into our top managers' movements and conviction levels over time.
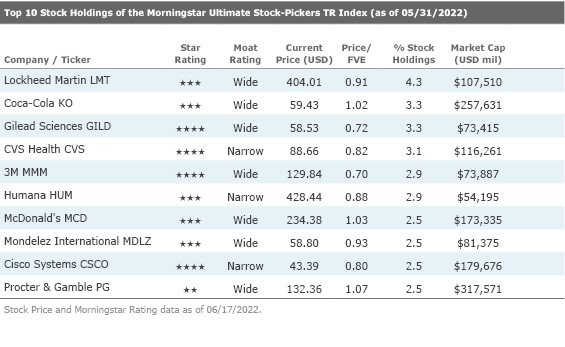
Looking at the top 10 stock holdings of the Morningstar Ultimate Stock-Pickers index, there are currently only a few names trading at approximately a 10% or more discount to our analysts' fair value estimates. One of these companies is narrow-moat-rated CVS Health CVS, which currently trades at an 18% discount to Morningstar analyst Julie Utterback's fair value estimate of $108 per share. As this company is both undervalued and a top stock holding on our index, we believe it merits further discussion.
After its acquisition of Aetna in late 2018, CVS Health provides an even more integrated healthcare-services offering for its members. Legacy CVS combined both the largest pharmacy benefit manager, processing over 2 billion adjusted claims annually, and a sizable pharmacy operation, including nearly 10,000 retail pharmacy locations primarily in the U.S. Adding a managed-care organization with 24 million medical members gives the company a strong position in the insurance industry and should help CVS better control overall healthcare costs for its clients.
According to Utterback, CVS appears uniquely positioned to improve health outcomes considering management's focus on better leveraging its medical insurance, pharmacy benefit management, and retail operations assets through digital and other means to bring a more consumer-centric approach to healthcare, which could provide many benefits. For example, when members use both CVS medical and pharmacy benefits, their medical costs decline 3%-6% over a three-year period through factors like fewer hospitalizations and emergency room visits. Driving savings like that would be attractive to many potential clients, like self-funded employers, and CVS' own at-risk operations, like its Medicare Advantage plans, by reducing medical costs.
Utterback assigns CVS Health a narrow economic moat rating. As a top-tier medical insurer, pharmacy benefit manager, and pharmacy retailer, we believe CVS possesses enough scale-related cost advantages to generate economic profits for the long run. With such significant scale in the fragmented health insurance market, CVS benefits from local scale advantage in specific metropolitan markets. Local scale advantages allow for greater negotiating leverage versus service providers than smaller insurers in each community, which contributes to cost advantages in each specific location. Also, when local scale advantages are significant enough, Utterback notes that CVS’ insurance operations benefit from a network effect.
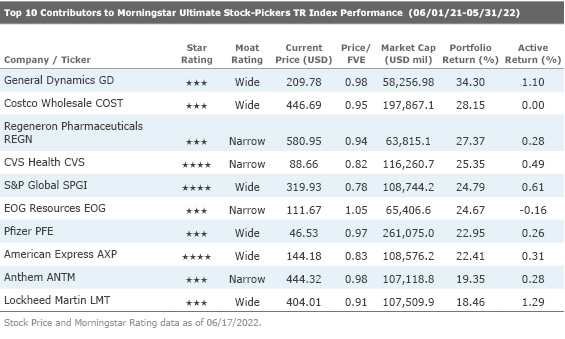
Looking at the Morningstar Ultimate Stock-Pickers index's year-over-year performance, we note that three of the top 10 names are undervalued according to Morningstar analysis. The list seems to be diverse by industry, with names in healthcare, financial services, industrials, and consumer. Wide-moat American Express AXP is one of the undervalued names on our list. The stock currently trades at a discount to Morningstar analyst Michael Miller's $173 fair value estimate.
American Express is a global financial institution, operating in 130 countries, that provides consumers and businesses charge and credit card payment products. The company also operates a highly profitable merchant payment network. Since 2018, it has operated in three segments: global consumer services, global commercial services, and global merchant and network services. In addition to payment products, the company's commercial business offers expense management tools, consulting services, and business loans.
American Express generates more than 80% of its revenue through noninterest income, with its largest source of revenue being the discount rate charged to merchants when they accept payment from one of its cardholders. This means that a reduction in travel and entertainment spending has a direct impact on the company’s revenue. Travel spending on the company's cards has become noticeably more resilient in the face of pandemic conditions, with purchasing volume continuing to recover rapidly in the second half of 2021, despite the onset of the delta and omicron variants. This is a symptom of the firm's success in repositioning its cards toward younger demographics, whose spending patterns are less affected by the pandemic.
Miller notes that American Express’ immediate prospects depend on the speed and timing of a full return to normalcy, but recent spending trends have set up the firm for a strong 2022. Consumer travel has rebounded strongly, but the impact on business travel could be longer lasting as companies reassess their travel needs. While a long-term impairment of business travel would affect American Express, the overall impact would be manageable as the company is not as dependent on this segment as it once was.
Miller assigns the firm a wide moat, due to its differentiated operating model allowing it to build maintainable competitive advantages.
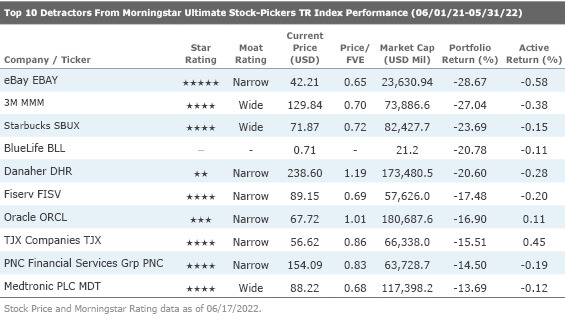
While lists of top-performing stocks are often composed of stocks that have already run up, our top detractors' list can sometimes be a good area to pick through the wreckage. Even though these names might not be performing well, it is possible that there could be some value plays in the long run. From our current list, we will highlight eBay EBAY, which currently trades at about a 35% discount to Morningstar analyst Sean Dunlop’s $65 fair value estimate.
EBay operates one of the largest e-commerce marketplaces in the world, with $87 billion in 2021 gross merchandise volume, or GMV, rendering the firm the sixth-largest global e-commerce company. It generates revenue from listing fees, advertising, revenue-sharing arrangements with service providers, and managed payments, with its platform connecting more than 142 million buyers and roughly 20 million sellers across almost 190 global markets.
EBay's Marketplace generated the sixth-highest GMV among global players in 2021, and renewed attention by management in core verticals like collectibles, used and refurbished goods, premium sneakers, and luxury jewelry—often products without a transparent benchmark average sales price, or ASP (limiting price comparison pressure and leaning into the marketplace's edge in price discovery)—appears clever. While eBay's emphasis on fixed-price listings and competing with B2C peers in the 2010s created space for niche competitors to gain traction in select categories, Dunlap believes that the e-commerce firm's deep pockets, 142 million active buyer base, and recent platform improvements should prove sufficient to solidify advantages in many targeted verticals.
Dunlop assigns eBay a narrow economic moat built around a network that grows increasingly valuable as more buyers and sellers enter its marketplace. As the original online auction market in the U.S., eBay has carved out a unique, enduring niche in non-new customer-to-customer, or C2C, products, with a customer base benefiting from an eclectic selection of collectible and one-of-a-kind goods, often lacking a definitive price index. Importantly, the firm has been able to effectively monetize its network, generating revenue from listing fees, advertisements, managed payments, and revenue-sharing agreements with logistics partners like narrow-moat FedEx FDX and wide-moat UPS UPS.
Disclosure: Eden Alemayehu and Eric Compton have no ownership interests in any of the securities mentioned above. It should also be noted that Morningstar's Institutional Equity Research Service offers research and analyst access to institutional asset managers. Through this service, Morningstar may have a business relationship with fund companies discussed in this report. Our business relationships in no way influence the funds or stocks discussed here.
/d10o6nnig0wrdw.cloudfront.net/05-31-2024/t_99626deb19c94bd4a5c406e19350f0ee_name_file_960x540_1600_v4_.jpg)
/cloudfront-us-east-1.images.arcpublishing.com/morningstar/U4OLR5WQ3JFYDHD76KVW6URKTU.jpg)
/cloudfront-us-east-1.images.arcpublishing.com/morningstar/DOFK3IUSBRF5XHSFKBZHOG4J5A.jpg)
:quality(80)/s3.amazonaws.com/arc-authors/morningstar/e03383eb-3d0b-4b25-96ab-00a6aa2121de.jpg)