7 min read
Why the European active ETF market is gaining momentum

The European active exchange-traded fund market has doubled in size over the past two years, reaching EUR 62.4 billion in assets as of August 2025, up from EUR 55.5 billion at the end of 2024. Despite this rapid expansion, active ETFs still represent a relatively small slice of the continent’s ETF universe, accounting for just 2.6% of total assets, compared with 10.2% in the United States.
Get deeper insight into how active ETFs are reshaping Europe’s investment landscape.
Download the new European Active ETFs report for market data, strategy breakdowns, and asset manager trends driving growth in 2025.
European Active ETF Market Asset Growth by Broad Asset Class | EUR Billion

Source: Morningstar Direct. Data as of Aug. 31, 2025
Equity strategies lead, holding EUR 43.9 billion, accounting for 70% of total assets, followed by EUR 14.8 billion in bond strategies and EUR 2.9 billion in allocation ETFs. Money market and alternative strategies account for the remaining share.
This steady rise highlights how active ETFs in Europe are gaining traction as more investors and asset managers seek flexible, transparent, and cost-efficient vehicles for generating alpha and implementing actively managed investment strategies.
European active ETF flows show growth, but slower than in the US
Active ETFs attracted EUR 13.4 billion in net inflows between January and August 2025, with EUR 8.3 billion directed to equities and EUR 3.7 billion to bonds. That followed EUR 18.4 billion in inflows in 2024.
These flows accounted for 6.3% of total ETF inflows in Europe, a stark contrast with the 36% share in the US over the same period. While demand for active ETFs is accelerating, adoption in Europe remains more gradual as investors continue to weigh active versus passive strategies in the ETF wrapper.
European Active ETF Annual Flows by Broad Asset Class | EUR
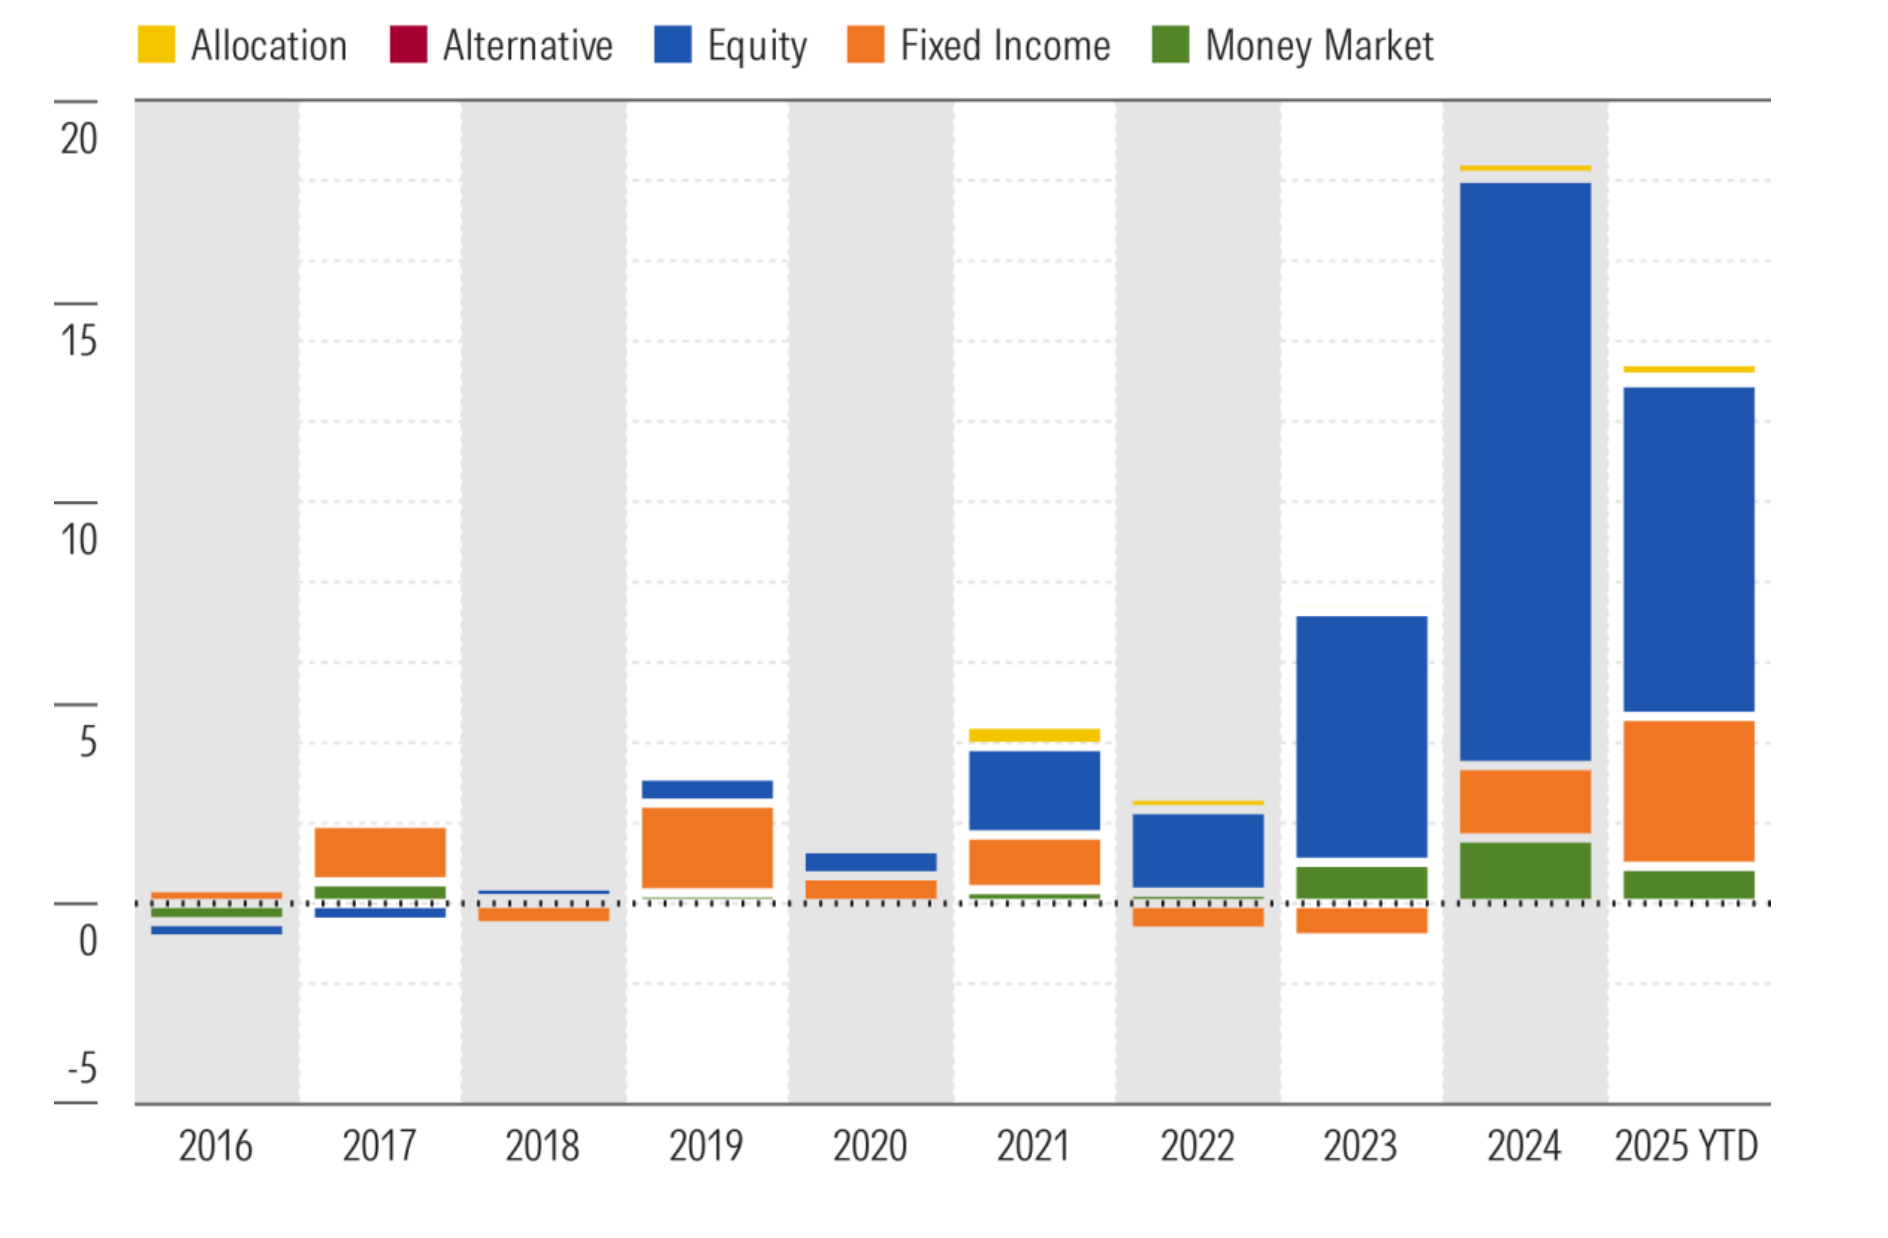
Source: Morningstar Direct. Data as of Aug. 31, 2025.
Active ETF Flows as % of Total Flows Into ETFs—Europe and US
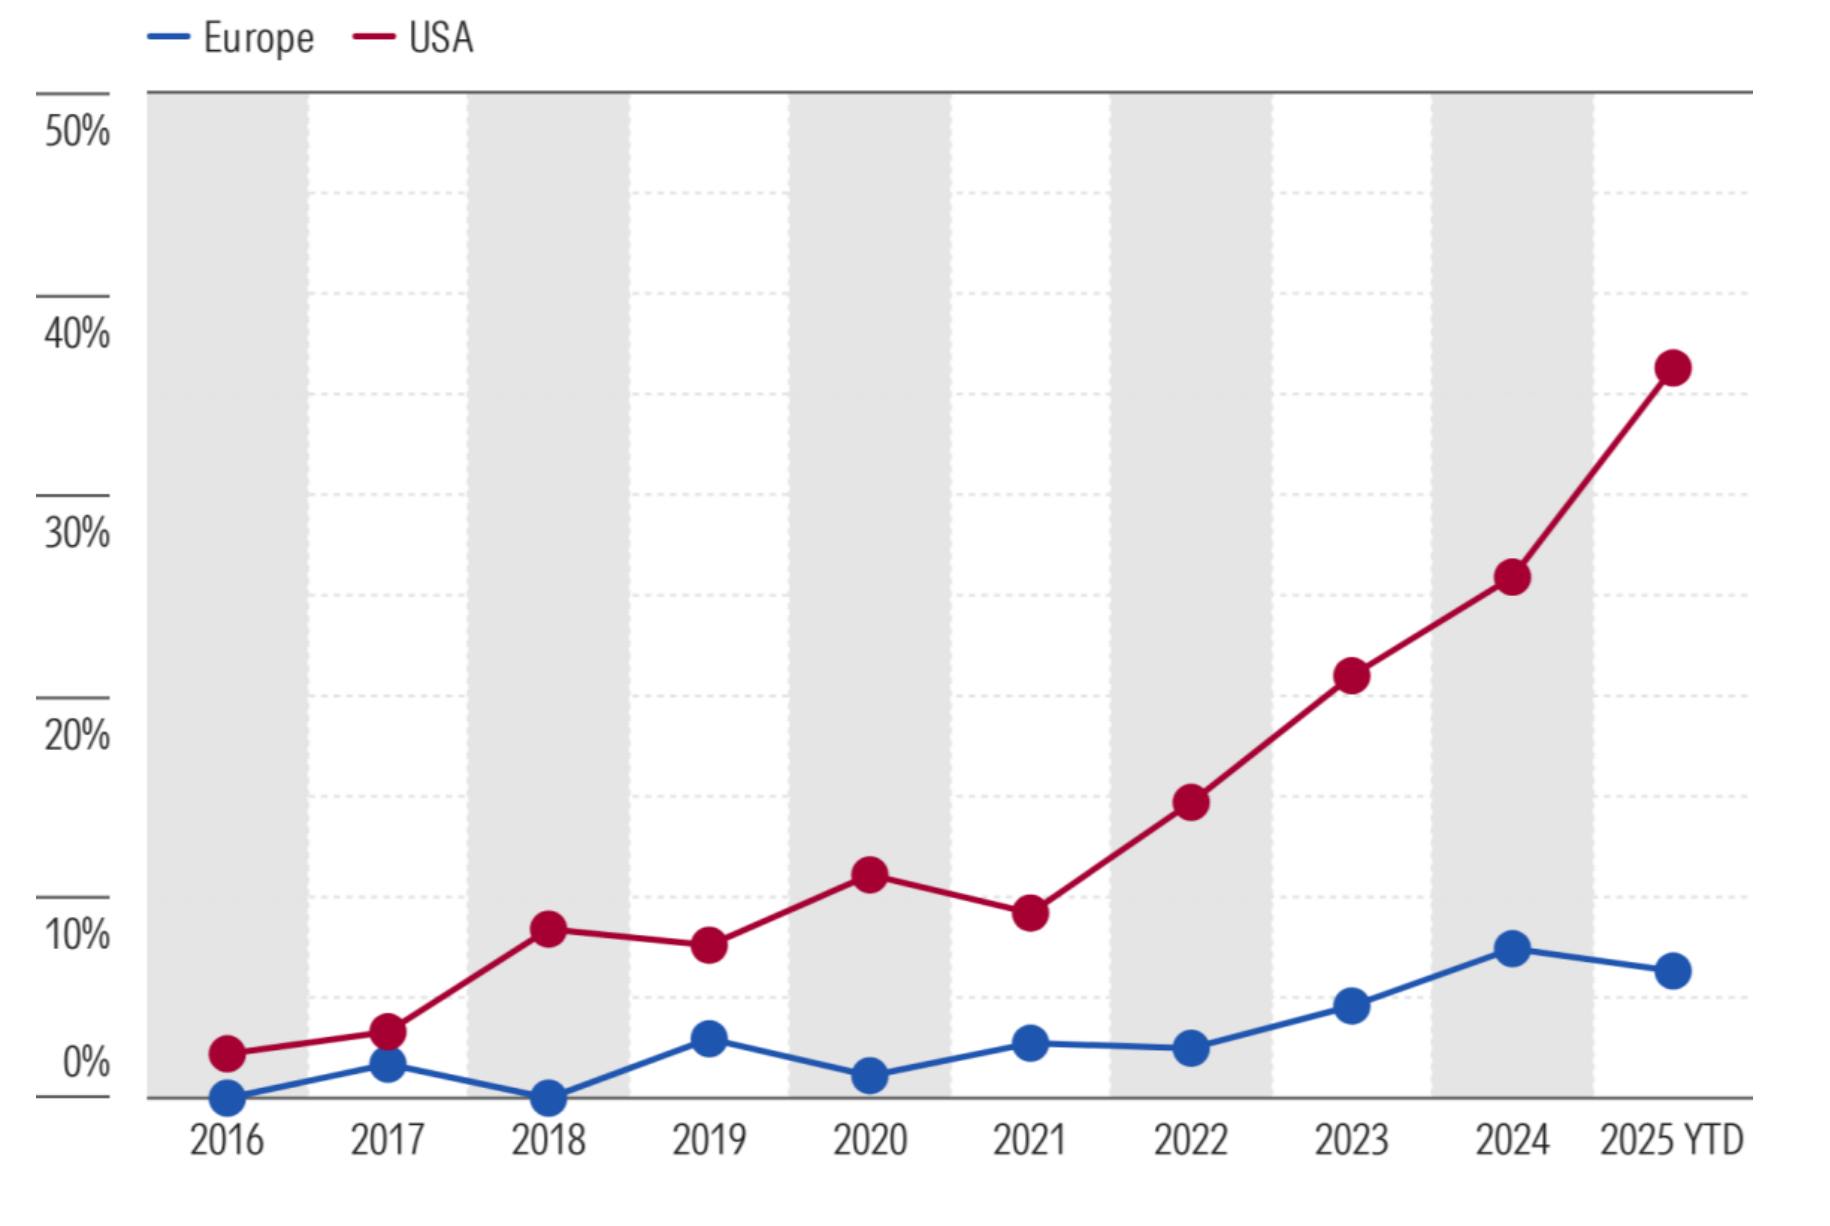
Source: Morningstar Direct. Data as of Aug. 31, 2025.
JPMorgan leads, but new players emerge
Competition within the European active ETF market is intensifying. J.P. Morgan Asset Management dominates a 56% market share, largely thanks to its suite of Research Enhanced Index (REI) ETFs that blend fundamental research with benchmark awareness.
Fidelity ranks second with an 11.1% share, using a similar research-enhanced framework but with slightly higher tracking error, while Pimco holds 7%, primarily in ultrashort-duration bond strategies.
Largest Providers of Active ETFs in Europe
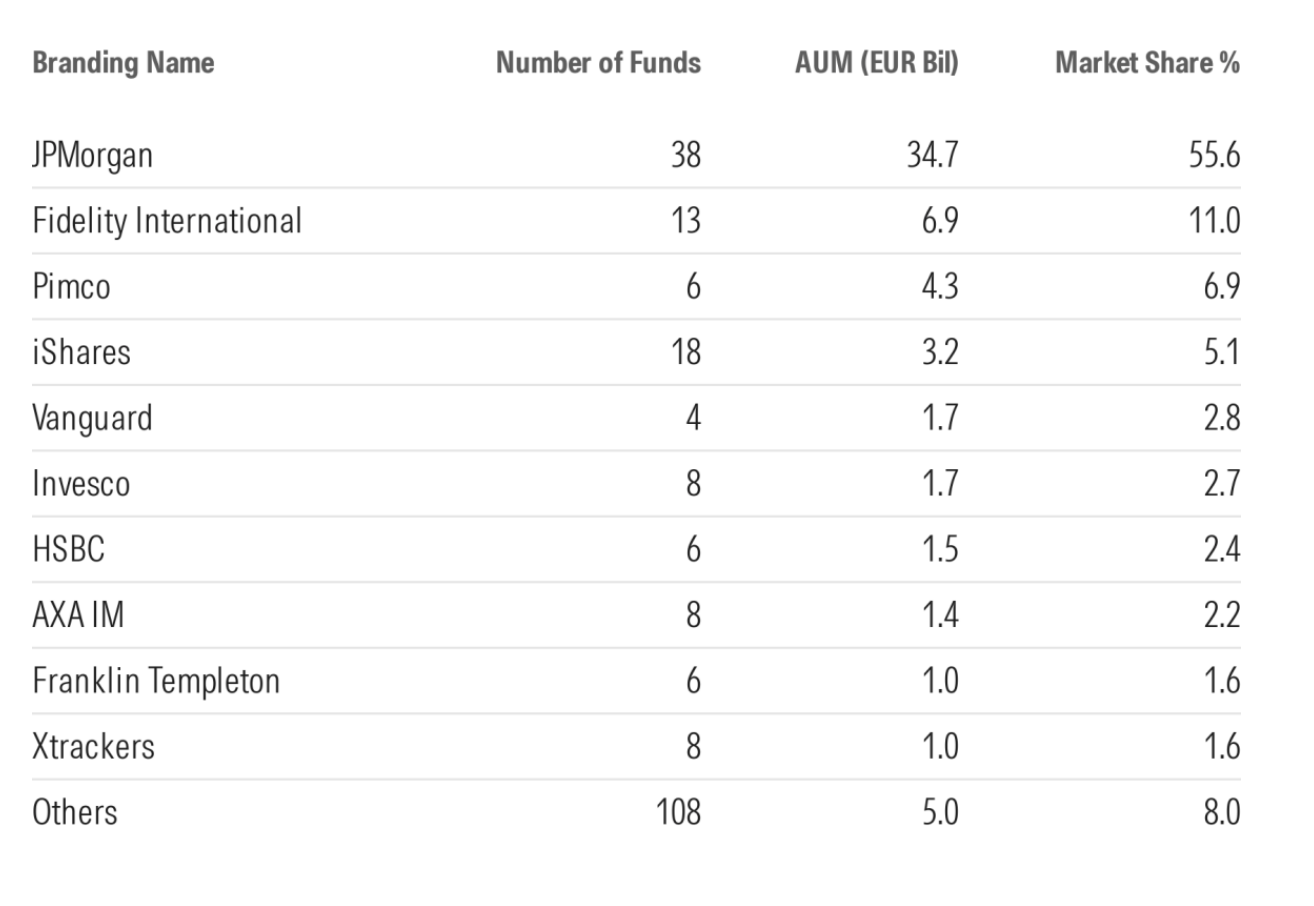
Source: Morningstar Direct. Data as of Aug. 31, 2025.
New entrants, including Avantis, HSBC, Robeco, and Goldman Sachs, have joined the market over the past two years, signaling broader interest from both active and passive fund houses eager to capture growth in UCITS ETFs.
Record fund launches signal a maturing market
Sixty new active ETFs launched in 2024, followed by 81 through August 2025, compared with an average of just 10 launches annually in the preceding eight years.
European Active ETFs Launches and Closures
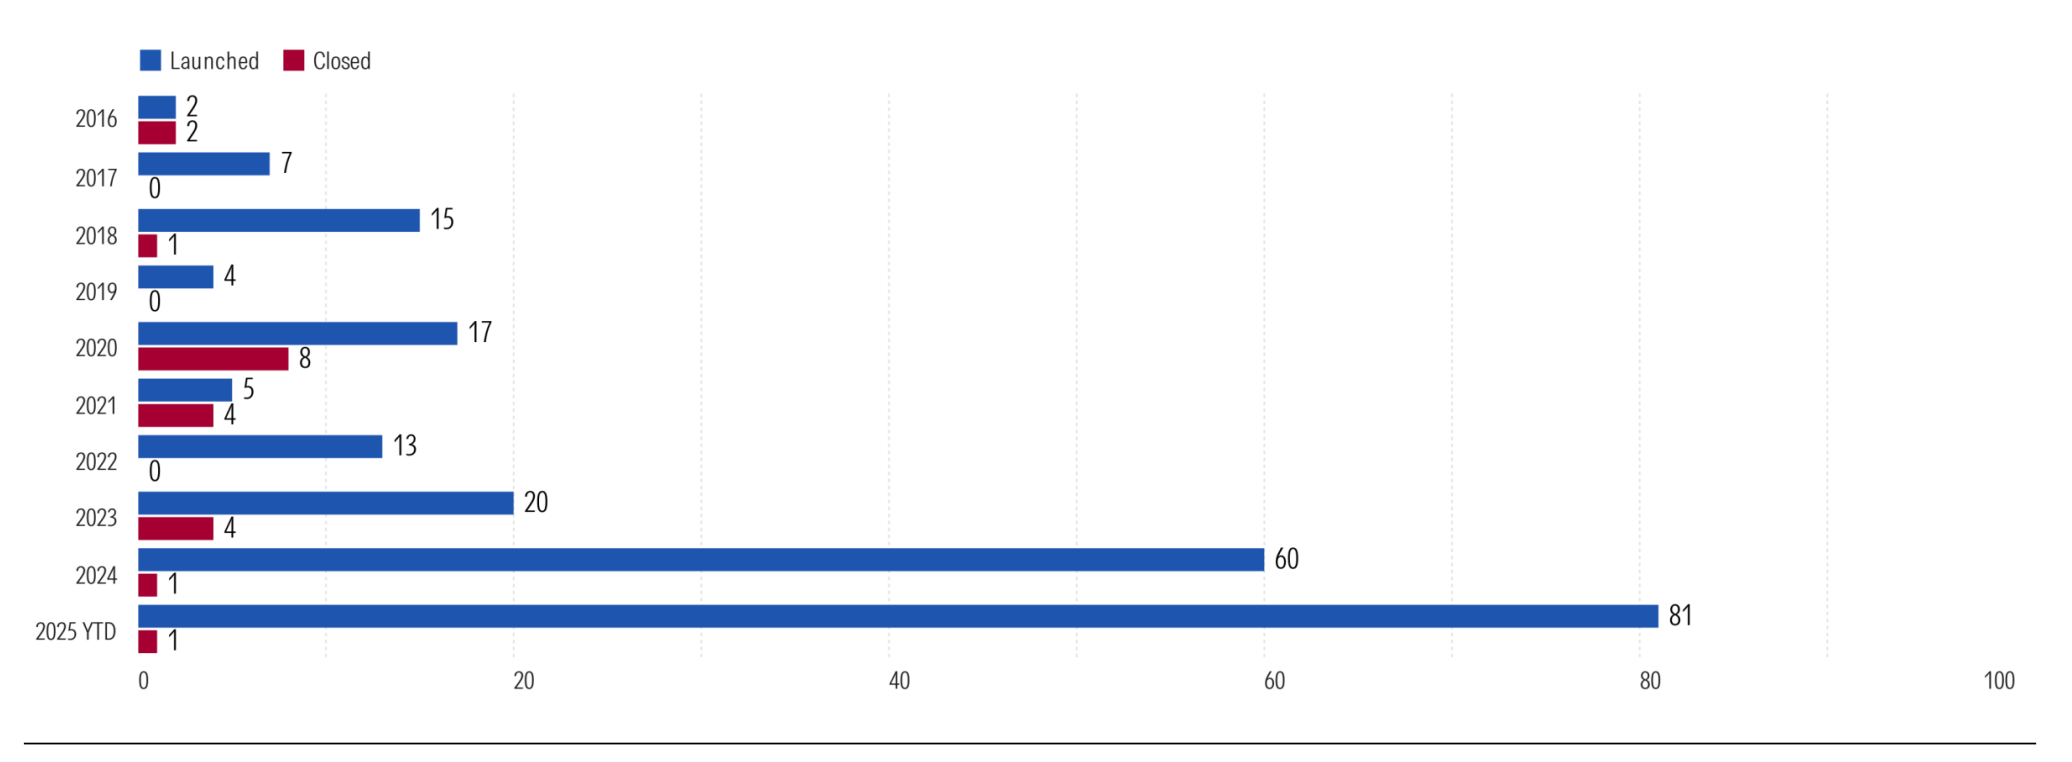
Source: Morningstar Direct. Data as of Aug. 31, 2025.
Closures remain rare, with the average lifespan of liquidated funds at four years. One notable example of structural evolution is the Lyxor Smart Overnight Return ETF’s transition from an active to a passive management style under Amundi in March 2025.
This wave of launches shows growing confidence among asset managers that active ETFs offer scalable opportunities to serve investors seeking both flexibility and cost efficiency.
Fee compression continues as competition intensifies
Pricing remains a key battleground. The average equity active ETF fee decreased from 0.43% in early 2022 to 0.37% in 2025, which is well below the 1.32% average charged by active mutual funds but still higher than the 0.27% typical of passive peers.
In fixed income, the average active ETF fee declined slightly to below 0.30%. As more asset managers enter the space, this trend of fee convergence is likely to continue, an encouraging sign for investors and a pressure point for issuers.
Investment strategies: Discretionary still dominant, but systematic gaining ground
Morningstar’s new classification framework categorizes active ETFs into two approaches: discretionary and systematic, helping investors better understand the process behind each strategy.
Morningstar’s Active/Passive Strategy Type Classification Framework
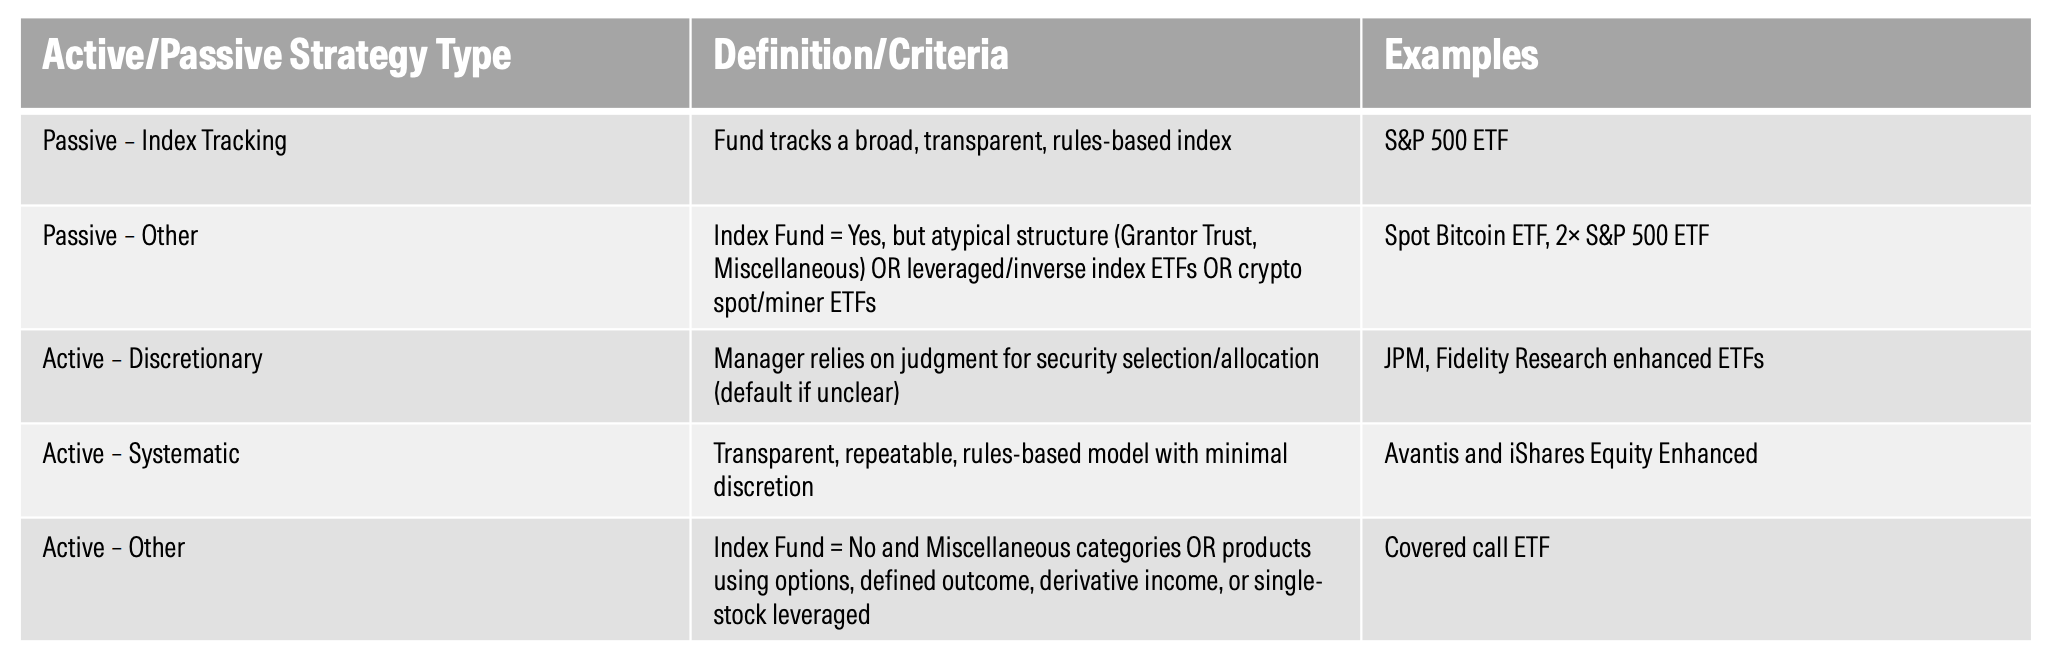
As of August 2025, EUR 53.6 billion, or 86% of all active ETF assets, followed a discretionary style, while EUR 8.0 billion (12.8%) was managed systematically. Within equities, discretionary assets totaled EUR 36.5 billion, versus EUR 7.3 billion in systematic approaches.
Fund flows show strong uptake of active-systematic equity ETFs
Flows data suggest that systematic strategies are gaining momentum: equity active-systematic ETFs drew EUR 3.5 billion in inflows through August 2025, more than triple their EUR 1.1 billion total in 2024.
Discretionary equity strategies remained ahead at EUR 4.7 billion, although down from EUR 13.5 billion the previous year.
European Active ETF Market Flows by Broad Asset Class and Investment Style
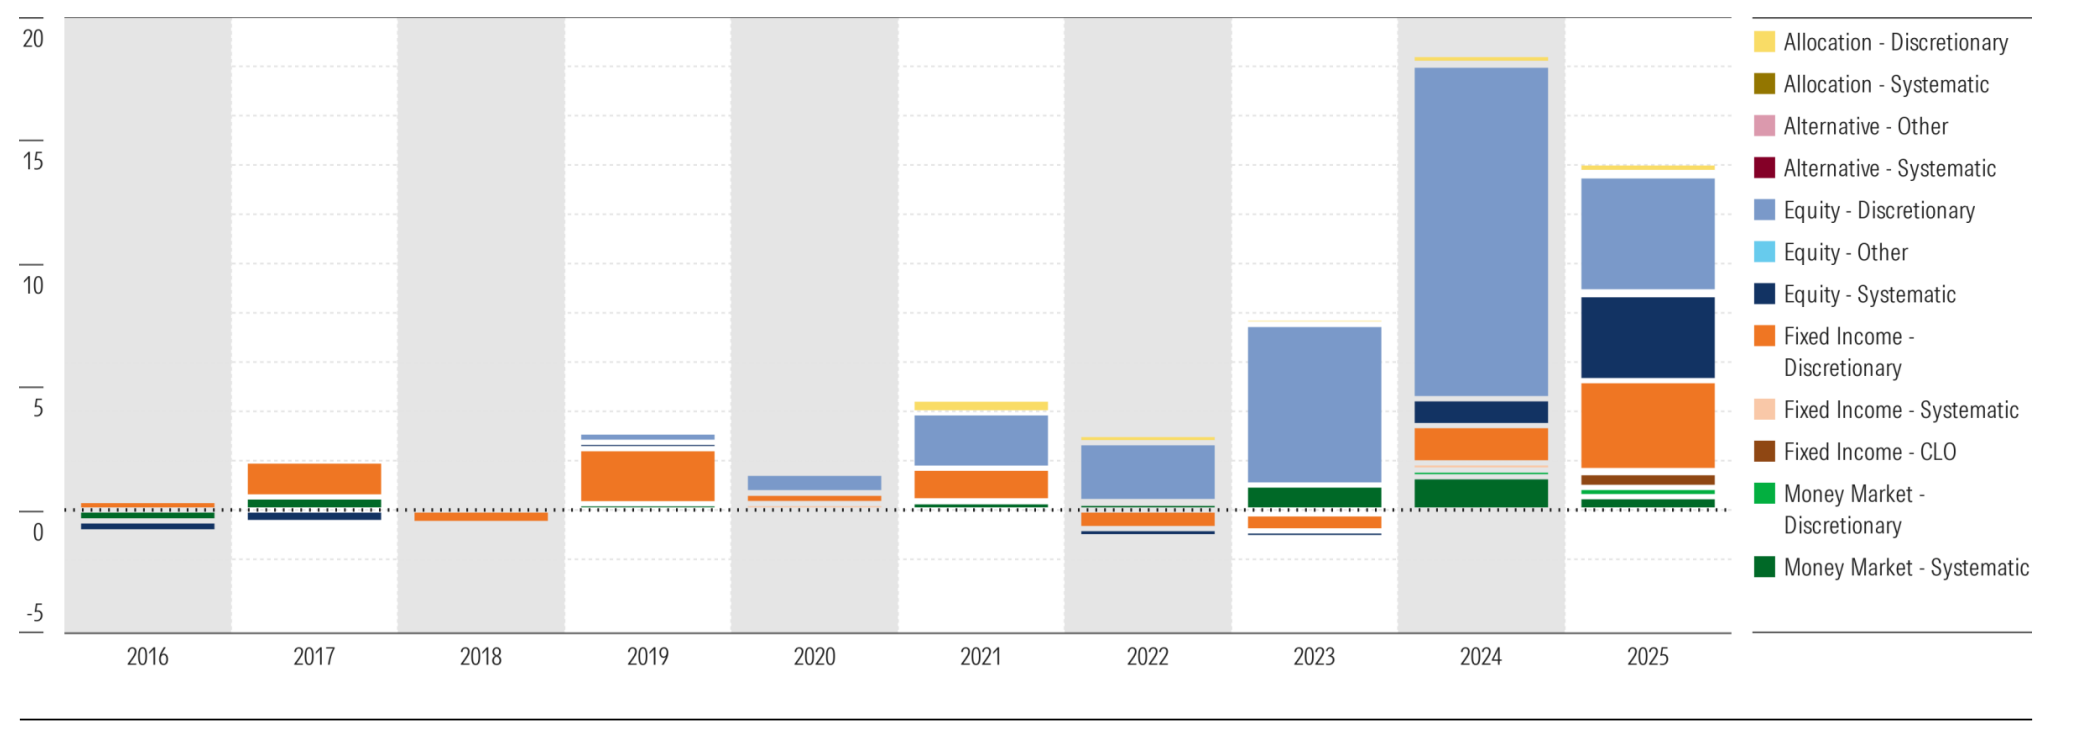
Source: Morningstar Direct. Data as of Aug. 31, 2025.
The shift to quant-driven, rules-based models is growing as investors seek repeatable alpha-generating processes with lower human bias.
Equity segment: Large-cap focus, small-cap breakthrough, and first semitransparent ETF
Active ETFs in Europe have entered a new phase. J.P. Morgan remains the market’s anchor, but a growing roster of entrants and record fund launches show that competition is intensifying.
The Avantis Global Small Cap Value UCITS ETF stands out as a successful small-cap entry, ranking among the top 10 active ETFs by inflows in early 2025 thanks to its diversified portfolio of over 1,000 holdings and strict liquidity controls.
In a milestone for product structure, Fidelity launched Europe’s first semitransparent active ETF in September 2025, the US Fundamental Small-Mid Cap UCITS ETF (FFSM). The structure provides daily transparency to market makers and authorized participants, subject to confidentiality agreements, with public disclosure lagging by three months.
Europe’s active ETF race is accelerating
For asset managers, the message is clear: success will hinge on the ability to balance cost efficiency, liquidity, and active insight while navigating investor expectations for transparency and performance.
With the market now at EUR 62.4 billion and expanding across equity and fixed income, European active ETFs are no longer experimental; they are becoming a popular part of portfolio construction.
Turn research into action with the Direct Advisory Suite. View fund flows and fund composition, allowing you to analyze markets, optimize portfolios, and communicate value with confidence. Discover how the Direct Advisory Suite supports smarter investment decisions.


