
27 min read
Australian and Global Market Outlook 2027
From expectations around artificial intelligence to the case for Australian small and mid-caps, the year ahead presents important questions about portfolio positioning and where Morningstar see possible opportunities.
APAC Overview
The past few years have rewritten the rules investors thought they knew. Trade wars have turned tariffs from a footnote into a standing policy instrument, while governments are putting self-sufficiency ahead of efficiency. Regulation is also struggling to keep pace with technological change, creating uncertainty around areas such as AI governance, data use and the infrastructure needed to support new technologies. Geopolitical flashpoints have multiplied, repeatedly reminding markets how quickly sentiment can turn. Together, these forces have made policy more consequential, less predictable and a persistent source of market uncertainty
We do not expect any of these forces to fade in 2027.
These shifts carry consequences for inflation and, in turn, bonds. The conflict with Iran has repeatedly unsettled energy prices, and questions are growing about the fiscal position of many developed countries. The disinflationary tailwind of cheap, efficient supply chains can no longer be taken for granted.
This backdrop may mean sporadic spikes in volatility, but we would not necessarily fear them. Both the Liberation Day tariff announcement in April 2025 and the onset of the conflict with Iran produced sharp selloffs that offered long-term investors the chance to buy good assets at cheaper prices. That is only true for investors who have prepared in advance, with a diversified portfolio and a time horizon long enough to wait.
Artificial intelligence adds a further layer, and it is now the dominant story in markets. It may well transform the economy, but it is also one of the largest investment programmes in modern history, and its capital needs add another claim on global savings. A great deal is being spent, which means a great deal must be earned, and how much of that spending will earn an adequate return is not yet knowable. Growing community resistance to data centres, in Australia as well as the US, is a further risk. In the meantime, AI has been a major driver of index returns, leaving indices concentrated in the theme. That concentration is the risk a diversified portfolio is built to manage.
AI is also changing what gives investors an advantage. Information is becoming easier to obtain, which weakens it as an edge, although proprietary data still sets investors apart. When everyone has access to the same facts and the same tools, the only way to outperform the market is to do something different.
That is where judgement becomes more valuable. A model can help build the valuation, but deciding what to do about it takes second-level thinking: asking not just what is happening, but what the market already expects, and where it may be wrong. AI is least helpful when there is too little data for the situation at hand, and those are often the moments that matter most.
Our edge is therefore behavioural. When fear or greed drive markets, we aim to keep our head. That discipline lets us see opportunity when others see only risk. In a market where information is abundant and conviction is scarce, patience, preparation and independent thinking are what we offer for the year ahead.
Beyond the Top 20: The case for Australian small and mid caps in 2027
Introduction
Big stocks have had their run, and smaller companies may be next. There is a strong case for active management in Australian small and mid cap names, particularly with a quality and valuation discipline. While large and mega-cap stocks have dominated market returns in recent years, more attractive valuation opportunities further down the cap ladder are showing up. But stock selection matters, because quality and risk characteristics vary widely among smaller companies. Investors should also watch the fund managers themselves. After years of underperformance, further consolidation among investment managers is possible, so business risk needs close monitoring.
Background
Increasing share market concentration has been a global phenomenon, driven by the outperformance of mega-caps and the ubiquitous “AI trade” over the past three years. Concentration is a familiar concept to Australian investors, where the benchmark indices have been dominated by the top 20 stocks for decades. Indeed, Australia is among the most concentrated stock markets in the world, dominated by financial and resources stocks.
The other prevalent trend has been the shift towards passive investing. The outperformance of large-caps has only encouraged flows into market-cap weighted index tracking vehicles. In Australia, the Your Future Your Super performance test has seen Superannuation funds increasingly allocate a core component of portfolios to passive, or low-tracking error strategies.
These trends have created a circular reinforcement, whereby larger outperforming companies achieve higher index weightings, which in turn attracts higher passive flows which are price-and-valuation insensitive. Meanwhile, companies further down the market-cap spectrum may be ignored, which has the potential to create valuation opportunities.
The Diversification Benefits of Mid/Small Caps
The table below compares the sector composition of the Morningstar Australia GR Index. Financials and basic materials dominate the overall index at a combined 61% weighting, but among the top 20 stocks these two sectors account for 70%. This drops to 45% when we look outside the top 20. Healthcare, Industrials, Communication Services, Technology, Real Estate and Utilities have a much higher representation in the ex20 cohort.
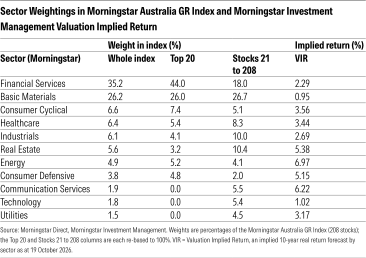
Source: Morningstar Direct, Morningstar Investment Management. Weights are percentages of the Morningstar Australia GR Index (208 stocks); the Top 20 and Stocks 21 to 208 columns are each re-based to 100%. VIR = Valuation Implied Return, an implied 10-year real return forecast by sector as at 19 October 2026.
Valuation Opportunities in Small and Mid Caps
Morningstar’s Valuation Implied Returns, which calculate an implied 10-year real return forecast at the sector level shows higher prospective return profiles in sectors that are more prevalent outside the top 20. This suggests an improved return profile is available by taking active risk away from the benchmark allocation at the sector level.
Looking deeper at the stock level, an analysis of Morningstar Equity Research price to fair value shows the top end of the market is fully priced, while the prevalence of discounted valuation opportunities improves. The top 10 stocks in the index are trading at an average premium to fair value of 20%. This compares to a 5% average discount outside the top 20, which increases to a 10% average discount outside the top 50.
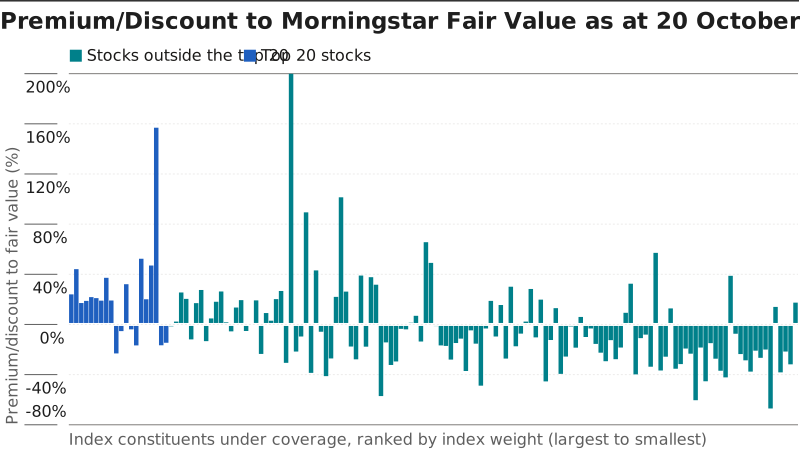
Source: Morningstar Equity Research, Morningstar Direct, as at 20 October 2026. Covers the 146 index constituents under Morningstar Equity Research coverage, shown in index-weight order from largest to smallest.
The Case for an Active Approach
While valuation metrics may appear attractive, there is a broad dispersion of quality and risk characteristics across the small and mid-cap universe. By their nature, smaller companies tend to be earlier in their business lifecycle, and while this may provide a longer growth runway, it poses additional risks around earnings and cashflow volatility, in addition to balance sheet strength. The smaller end of the Australian share market has a high weighting to resource stocks, which are commodity-price exposed and may have exploration and development risk. There are also a number of loss making companies represented in the index. Smaller companies are less liquid, and may have more concentrated share registers, which can exacerbate share price volatility, particularly during times of market stress (see Figure 3).
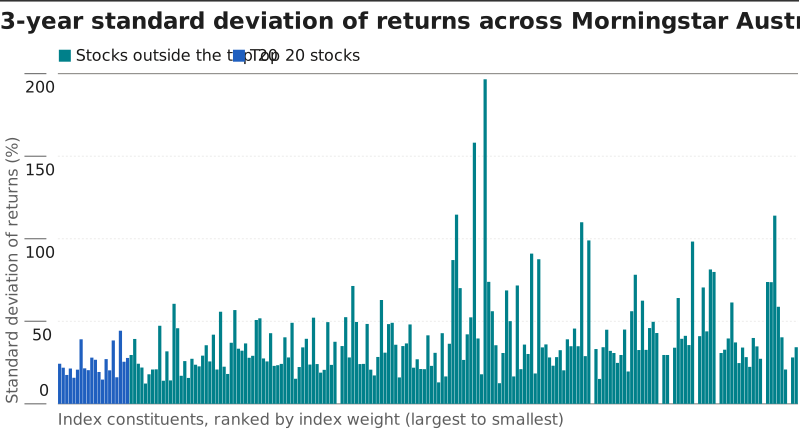
Source: Morningstar Direct. Stocks under Equity Research Coverage sorted by place in Morningstar Australia GR Index, from largest to smallest weight. As at 30 September 2026.
For these reasons, an active approach to stock selection is preferred over a passive, market-cap weighted approach for the small and mid-cap segment of the market.
Manager Selection and Business Risk
The trend towards passive investing and the underperformance of active management over the past few years has placed pressure on the business viability of many smaller active fund managers. There have been a number of fund closures over this period, including Novaport, Celeste, Touchstone and most recently Platypus. Therefore, investors should pay close attention to the assets under management, client concentration and strategic commitment of parent firms when assessing the use of active managers for small and mid-cap investing.
Conclusion
Overall, there is a strong case for active management in small and mid-cap Australian stocks, driven by diversification benefits and appealing valuations. However, investors must be conscious of the additional risks involved, and exercise prudence at both stock and manager selection levels.
2027 Outlook: Bonds Are Paying Again, If You Can Handle the Ride
2026 was a bruising year for global government bonds.
The US 10-year Treasury yield peaked at 5.3% in October, a level last seen more than two decades ago, and yields in Japan and the United Kingdom reached or neared multi-decade highs. Because bond prices fall when yields rise, investors have felt it directly.
Global Government Bond Yields Have Risen Broadly in 2026
Source: Morningstar. Data as of 11/02/2026. Yields represent the yield to maturity of the respective Morningstar Government Bond Indexes. Europe represents the eurozone aggregate.
The selloff has spread across countries with very different economies and central bank policies. Inflation explains part of it. The rest reflects investors rethinking the risk of holding long-term government bonds, against a backdrop of persistent deficits and fading support from traditional buyers.
Entering 2027, our view is that this is a change in the climate, not a passing storm. Rates have moved to a higher floor, and the ride from here will be bumpier. Neither is a reason to avoid bonds, but both should change how investors use them.
Why the Floor Has Moved Up
We raised our estimate of where rates settle over the long run this year. Three forces explain the shift, and all of them reach beyond the US.
- Everyone wants capital at once. AI data centers, rising defense budgets, reshoring and the energy transition are large claims on the world’s savings, and few are deterred by higher borrowing costs. When demand for money outpaces the supply, its price (the interest rate) rises.
- Governments keep borrowing. Deficits remain large across the developed world. The US is running one of about 6% of GDP even with a strong economy.
There is no magic debt level that sets off a crisis. Japan owes about twice as much as the UK and borrows more cheaply. The issue is the ongoing borrowing: as long as deficits stay wide, governments must keep finding buyers.
- And the buyer who never asked the price has left. In 2014, central banks and foreign governments, which bought almost regardless of yield, owned 57% of the US Treasury market. Today they own about 29%.
U.S. Treasuries Increasingly Reliant on Price- Sensitice Buyer
Source: Federal Reserve Financial Accounts of the United States (Z.1); U.S. Treasury International Capital (TIC). Data as of 03/31/2026. Less price-sensitive buyers are defined as the Federal Reserve, foreign official investors, and banks. Share calculated as a percentage of total outstanding U.S. Treasury securities.
Same Storm, Different Boats
Inflation is turning higher again almost everywhere globally, and the pressure is spreading beyond energy. But each economy came into this shock from a different place, and central banks are responding differently.
The Fed is weighing sticky inflation against rising growth risks. The UK and Australia face the most stubborn inflation and the most pressure to stay tight. Japan is still gradually raising rates after decades of deflation, while the eurozone, closest to target, can afford to wait.
Those differences shape what each bond market offers. US Treasuries pay well, but for real risks, including the loosest fiscal policy in the group. The UK offers the highest expected return and the strongest fundamentals. Australia is similar, with the healthiest public finances. Japan has the weakest fundamentals, but for investors who hedge from higher-rate countries like the US, the currency hedge adds meaningful return. In the eurozone, inflation is largely tamed, but government finances, particularly in France, remain the weak spot.
What It Means for Investors
Income is back, and it’s a cushion. The silver lining of a bruising year is that bonds are paying again. At today’s starting yields, income rather than price gains does the heavy lifting, and it gives investors a buffer: a portfolio can absorb a meaningful further rise in yields before its return turns negative. That was not true for most of the 2010s.
Improving Return Prospects Across Global Government Bonds
Source: Morningstar. Data as of 09/30/2026.
Plan for swings. With fewer patient buyers, larger moves in bond prices are the new normal rather than a warning sign. Owning the longest bonds isn’t the only way to earn a decent yield and investors can choose where they sit based on how much their volatility tolerance.
Diversify across governments. Central banks are responding to the same inflation shock in different ways, and each government is managing a different debt burden. Spreading interest-rate exposure across developed markets reduces reliance on any one of them. Currency is part of that decision as well, because hedging can add or subtract return.
Know what to watch. We don’t forecast where yields go next, but we know what would change the picture.
- Central bank credibility comes first. While it holds, inflation pressure shows up as higher real interest rates, which bonds can handle. If it cracks, inflation expectations could go higher, the outcome long-term bondholders should fear most.
- Government borrowing plans are second. Bigger deficits, or more issuance of long-term debt, would add pressure at the long end.
- Last is the pace of AI and other investment spending, which will decide how long the competition for capital lasts. Today, the build-out is adding to price pressure through demand for chips, power and construction. Over time, if AI makes businesses more productive, it could ease inflation, though how much remains debated.
The near-zero rates of the 2010s now look like the exception, not the norm. For bond investors, that means less certainty about prices but likely far more reward for holding them.
SpaceX Is a Vertically Integrated Conglomerate
Launch Cadence Drives Profitability for SpaceX’s Rocket Business
Profit drivers for the space launch business are basically launch cadence times payloads minus the steadily decreasing average cost to launch before reinvestments in research and development.
The unit invested over $3 billion in research and development in 2025, with a focus on its large next-generation rocket, the Starship, on which much of its future business rests. Its enormous lift capacity and potential for full reusability, if it proves out, will provide a meaningful further step change downward in SpaceX’s average cost to launch, especially per unit of payload mass.
It may happen behind schedule, but we assume that the engineering of the reusable upper stages of Starship will eventually pan out.
The challenge is to develop heat-shield materials that can withstand 1,800 degrees Fahrenheit and the stresses of atmospheric reentry without requiring time-consuming or costly remanufacture before they can repeat the journey.
We point to advanced materials science and manufacturing techniques that enable turbine jet engine components to withstand thousands of flight cycles at temperatures above 3,000 degrees. We don’t think the turbines’ technology is transferable; we only point out why we think a solution is within the realm of possibility.
Once paying customers use Starship, the company’s research and development costs will diminish as a percentage of sales, and we expect the launch business’ margin profile to improve over time, reaching $18 billion in revenue at a 20% operating margin by 2035 in our base-case scenario, as provided by PitchBook.
What Are the Profit Drivers and Outlook for Starlink?
We expect Starlink to continue as the primary cash generation engine and internal funding source for other ambitious projects the firm has underway in the medium term.
Starlink benefits from the firm’s extensive launch cost advantage, and a majority of the company’s future launches will be allocated to scaling Starlink deployment by launching tens of thousands of communications satellites into low Earth orbit. We expect Starlink’s revenue and profits to compound at a high rate, supported by its unmatched ability to provide connectivity in remote areas worldwide.
SpaceX, Morningstar estimates, PitchBook, Anthropic, United Nations, DESA Population Division, World Urbanization Prospects 2025. Data as of Dec. 31, 2025.
Our thesis does not depend on the company achieving all or even most of its stated aims.
In SpaceX’s registration statement, it identifies a combined $1.6 trillion total addressable market for its mobile and broadband services. The figures equal or exceed all current global spending on mobile and broadband services outside Russia and China.
Our forecast does provide for aggressive growth and very high incremental margins for Starlink service, and based on Starlink’s 2025 reported 50% revenue growth to $11.3 billion and 58% (positive) operating income growth exceeding $4.4 billion or 39% margin, we see the business model validated.
We can see a path to further tens, not necessarily hundreds, of billions of dollars in annual revenue growth in the coming decade, and operating margins potentially exceeding 75%, driven by the company’s leading operating cost advantage and the negligible incremental cost of adding users to existing network infrastructure.
An important consideration is that the biggest structural difference between a scaled satellite network operator such as Starlink and traditional cable, fiber, or wireless operators is that an investment in SpaceX’s orbital telecom infrastructure increases its utility to all users globally, whereas investments by fixed-line and wireless operators apply locally.
Limitations on the amount of data that can travel to and from orbit over the available radio spectrum mean that Starlink faces meaningful barriers to adoption in the densest population centers, as well as a disadvantage in the latency of the signals it can maintain, especially relative to cable and fiber transmission.
However, we don’t think Starlink has to solve these limitations or necessarily face them to succeed. Nearly one-fifth of the Earth’s population resides in the least-densely populated areas, providing close to 2 billion potential customers.
A growing array of services, such as powering onboard Wi-Fi for airlines, plays directly into Starlink’s capabilities that incumbents cannot match. We call these niche-plus growth opportunities, and they include jobs such as telemetry and fleet connectivity that tend to operate across wide swaths of terrain and may not require the lowest latency.
Our base-case forecast entails $56 billion in revenue for Starlink in these niche and growth areas by 2035, representing about 45% of the identifiable market we’ve sized.
Another area where Starlink has seen rapid adoption is offering direct-to-cellular service. We don’t think the company will necessarily take on incumbent wireless providers, nor do we think it would be likely to succeed in doing so.
However, we think that a global market opportunity amounting to $67 billion by 2035 exists, largely for Starlink’s taking: striking deals with mobile providers across the globe to offer an add-on service that provides satellite-based wireless connectivity where cell tower coverage is insufficient or nonexistent.
We see this wireless “add-on” opportunity as requiring only a few dollars per user across many hundreds of millions of potential users, using existing providers’ radio spectrum. We estimate Starlink could generate $24 billion in such revenue by 2035, 36% of the market we identified.
For more on the factors driving our initiation of SpaceX, download the full PDF here. When Unicorns Fly: SpaceX Prepares History's Largest IPO
Starlink Market Potential: How Big Can the Business Be?
Given the centrality of Starlink to SpaceX's financial prospects and its long-term ambitions, we focus on how big the Starlink market can potentially be. Starlink's technology is well suited for providing connectivity in low-density areas and we do not anticipate the service disrupting the core telecom market.
Despite this, we think that there is a significant global market opportunity of around $129 billion as of 2025, predominantly complementary to existing connectivity providers. Our revenue projections for Starlink imply that the company will penetrate 45% of these niche market opportunities by 2035.
Source: Morningstar estimates. Data as of May 31, 2026.
Starlink has accounted for most of SpaceX's growth and profitability in the past three years and will be the main driven for SpaceX in the medium term. In our opinion, the central question with Starlink's is about how big can the market be for this service.
Starlink Will Continue to Be the Main Money Maker for SpaceX in the Foreseeable Future
Starlink has accounted for most of SpaceX's growth and profitability in the past three years. We expect most of the company's profits to come from the Starlink business in the foreseeable future. Starlink will essentially be the financial engine that will make other ambitions projects at SpaceX possible.
We expect Starlink to generate substantial cash in the coming years, and that capital will be used for other priorities, such as Starship development and artificial intelligence infrastructure buildout.
Given the importance of Starlink, SpaceX has prioritized the business in allocating its launches. Starlink satellites account for most of the mass SpaceX places into orbit each year, and the firm is steadily increasing its constellation, which now exceeds 10,000 satellites, according to the latest estimates.
Source: PitchBook, Morningstar, Company filings. Data as of Dec. 31, 2025.
Source: PitchBook, Morningstar, Company filings, Jonathan McDowell, planet4589.org, WSJ. Data as of Mar. 31, 2026.
SpaceX Claims a Massive $1.6 Trillion TAM for Starlink, But We Are Skeptical
SpaceX's $1.6 trillion TAM figure appears to aggregate the total connectivity market across most countries (excluding China and Russia) and all segments, including wireless, broadband, and enterprise.
The firm's quoted figure implies that Starlink is a credible competitor to incumbent telecom providers across all geographies and market segments. We think that this significantly overstates any realistic market opportunity for Starlink. As we discuss below, satellite-based connectivity faces physical and technological constraints that are very difficult to overcome in densely populated areas.
Source: Company filings. Data as of June 3, 2026.
Starlink's infrastructure and technical constraints make its services best suited to serving lower-density environments where we estimate that about one-fifth of the global population lives.
Based on more granular data, we estimate that about 5% of the global population lives in highly dispersed environments, which are least suitable for terrestrial infrastructure and ideally suited for satellite-based connectivity.
This report focuses on a detailed market sizing analysis for Starlink. Based on even the most simplistic analysis, applying the 5% share discussed above to the $1.6 trillion TAM claimed by SpaceX, we can establish a conservative estimate of at least $80 billion in directly addressable global market for Starlink.
Doing a similar analysis on US population density shows a similar trend (Exhibit 8), exhibiting a striking concentration of population. According to an analysis by CNT, more than two-thirds of the US population lives in less than 2% of US land areas, and the remaining third lives in 98% of land area.
Source: Morningstar estimates, US Census Bureau. Data as of Dec. 31, 2021.
Starlink's Infrastructure Serves Global User Base: We Estimate Size Around 3 Times US Market
The biggest structural difference between a scaled satellite network operator like Starlink and traditional cable, fiber, or wireless operators is that an investment in SpaceX’s orbital telecom infrastructure increases utility for all users globally, whereas investments by fixed-line and wireless operators apply locally.
An important consideration for Starlink is to accommodate its potential to serve customers globally and the impact of that dynamic on its unit economics. Starlink is already gaining meaningful market share among customers switching internet providers in rural areas of countries such as Australia, Indonesia, and the Philippines.
These are all countries where rural populations are sparsely distributed, and existing connectivity infrastructure is weak.
Source: Opensignal, Morningstar. Data as of Dec. 31, 2025.
We note that Starlink's unit economics are not equally attractive across all geographies.
The cost of serving a subscriber is driven primarily by the satellite constellation, launch infrastructure, and network operations, which are largely independent of income levels across countries. In other words, the costs of serving a customer in the US are similar to those of serving a customer in Africa.
However, consumers' ability and willingness to pay for connectivity varies dramatically across markets. For instance, we see wireless ARPUs in a developed market like the US around $65 per month, while comparable figures in lower-income countries such as India are often as low as $3 per month.
Even with a consistent average cost to serve a global user base, we think lower available unit revenue constrains Starlink's long-term global market opportunity. Although the service may be technically available worldwide, many use cases in lower-income markets may not support pricing levels sufficient to generate attractive returns, limiting the portion of the global population that is realistically addressable.
Source: Omdia, Morningstar, company filings. Data as of Dec. 31, 2025.
We expect Starlink's main constraint to be its ability to increase capacity in the next few years. Given this dynamic, we think Starlink will prioritize scaling in high-income countries and will be limited to high-impact use cases in lower-income countries for the foreseeable future.
The chart below shows that Starlink has allocated a larger share of its limited capacity to higher-ARPU countries such as Australia and Canada. This has resulted in relatively lower performance in markets such as Indonesia and the Philippines.
That said, Starlink's reliability has been steadily improving across all markets as its constellation, capacity, and network infrastructure grow.
Source: Opensignal, Morningstar. Data as of Jan. 31, 2026.
Connectivity markets vary significantly across countries in terms of population density, income levels, broadband penetration, competitive intensity, regulatory frameworks, and existing telecommunications infrastructure.
Thus, Starlink's market potential in each could vary considerably. We leveraged the US as our primary analytical framework given the high availability of reliable data. We then extrapolated our findings to other international markets.
We think the US can serve as a reasonable proxy for other high-income countries, given the maturity of its connectivity market. We adjusted our global estimate to account for less-developed infrastructure (a plus) with lower average revenue per user in developing markets.
While this approach simplifies a highly diverse global landscape, we believe it provides a reasonable framework to globalize our estimate of Starlink's realistic addressable market.
Source: Morningstar, OECD, Broadband Portal. Data as of Dec. 31, 2024.
Source: Morningstar, company filings, US Department of Justice, USTelecom, Federal Communications Commission. Data as of Dec. 31, 2025.
As a starting point, we compare the US connectivity market with SpaceX's quoted TAM figure.
We estimate SpaceX's $1.6 trillion TAM is about 4 times the size of the US connectivity market in 2025. SpaceX's TAM figure appears to aggregate the entire connectivity market across most countries (excluding China and Russia). As we think about extrapolating Starlink's realistic US market opportunity to international markets, we think that the 4 times multiplier is on the optimistic side.
Compared with other global markets, we consider the US as a more favorable market for Starlink due to high household incomes, large sparsely populated regions, high ARPU, strong consumer willingness to pay for premium connectivity, and a regulatory environment that has been supportive of the nation's own preeminent private satellite operator.
In our opinion, the main reasons for Starlink's market share not being as high in other international markets as the US are the following:
- In lower-income countries, affordability is a major constraint and ARPUs are significantly lower than the US. Starlink's cost to provide the service remains roughly similar
- Other high-income areas like Europe and South Korea have much higher population densities. This makes existing terrestrial networks more competitive.
The regulatory environments in many other countries are likely to be less permissive than the US, especially where telecom infrastructure is deemed linked to national security.
On the other hand, we think the case for Starlink penetration strengthens when we compare the maturity of US infrastructure to that of other countries. Remote areas in many low- and middle-income countries lack basic connectivity services and will benefit significantly from Starlink's service. We expect Starlink to remain a global leader, with a very high share of satellite connectivity services.
Source: SpaceX company filings, Rocketlaunch.org, Brycetech, Morningstar estimates. Data as of Dec. 31, 2025.
Based on our analysis of various international markets, we estimate that Starlink's target high-income population is 850 million, about 2.5 times the US population. This includes relatively high-income regions of the world such as Europe, Canada, South Korea, Australia, and Japan.
Additionally, we consider that other less densely populated areas within low- and middle-income regions of the world would also represent a sizable market for Starlink, given the lack of alternatives in those areas. We exclude Russia and China from our analysis due to geopolitical concerns.
After accounting for variations in ARPU, population density, prevailing terrestrial connectivity infrastructure, and regulatory regimes, we estimate that Starlink's global market opportunity is about 3 times its US opportunity.
Our estimate is lower than the 4 times factor implied in SpaceX's quoted TAM, and we think that our estimate gives the firm sufficient credit for penetrating international markets and existing technological constraints.
Framework for Starlink's Market Size: Niche Plus Add-On Versus Core Telecom
Our framework segments the total US connectivity market into three distinct tiers based on how much penetration we think Starlink can achieve in each tier and grounds each tier in the structural economics of satellite versus terrestrial connectivity.
The first tier, which we classify as Niche, represents Starlink's most natural and economically attractive markets. This segment includes customers that terrestrial telecom providers have historically struggled to serve efficiently, such as rural and remote households lacking cable or fiber access, maritime and aviation operators, energy and mining sites, government and defense users in remote regions, as well as specialized applications such as recreational vehicles, disaster recovery, and other emerging Internet of Things connectivity use cases.
What makes this market particularly compelling is that Starlink is often addressing unmet demand rather than competing for existing customers. In many cases, there is no viable terrestrial alternative, which reduces competitive intensity and customer acquisition costs. We expect Starlink to have high penetration and attractive economics in this tier.
We estimate the Niche Wireless market to be around $3 billion, Niche Broadband market to be around $10 billion and Niche Business Services market to be around $15 billion in the US as of 2025. Adding these numbers together gives us a combined US market size of $28 billion (3+10+15) in the Niche category.
The second tier, which we classify as Add-on, represents a complementary opportunity primarily within the wireless market. Under this model, Starlink is not a direct substitute for terrestrial mobile networks but rather serves as an extension of existing carrier coverage into areas where terrestrial coverage is weak. The recent partnership between T-Mobile and Starlink provides a useful example.
In a model like this, carriers strike a wholesale agreement with Starlink to extend its services to all their customers, or their subscribers can pay an additional monthly fee for satellite connectivity when they move beyond the reach of traditional cellular networks. In this model, traditional mobile carriers manage customer relationships and often (crucially) permit the use of their spectrum, while Starlink provides complementary satellite capacity and receives a small share of the revenue stream.
We project that the Wireless Add-On market size will reach $15 billion.
The third tier, which we classify as Core Telecom, includes the established markets served by wireless operators, broadband cable and fiber providers, and enterprise networking firms. The fact that Starlink faces structural disadvantages compared with terrestrial networks in densely populated markets supports our view that it would not be able to meaningfully penetrate this segment.
We estimate that the realistic US market size in the Niche tier is $28 billion and the market size in the Wireless Add-On tier is $15 billion. Excluding the Core Telecom segment, we estimate Starlink's market potential at around $43 billion. If we extrapolate this number using a factor of 3 to estimate the global market size, we arrive at a realistic figure of around $129 billion as of 2025.
For a detailed look at the market size within each tier, download the full PDF: Testing the Sky's Limits: Our Realistic Starlink Market Sizing
How to Play the SpaceX Story Without Buying SpaceX
The SpaceX IPO has put a spotlight on the rocket launch supply chain, sparking investor interest in companies with exposure to the commercial space boom. We see industrial gas firms as a low-risk play on the commercial space race. Although we estimate that the space end market currently accounts for only a low-single-digit percentage of revenue for the three industrial gas firms we cover, we expect it to become a meaningful driver of revenue growth, particularly for Linde LIN.
Source: Company press releases, Morningstar estimates.
Linde is the primary industrial gas supplier to SpaceX, which conducts the majority of commercial space launches. Furthermore, the industrial gas firm has invested in additional capacity to support SpaceX's launches in Texas and Florida. We believe that Linde is poised to capitalize on SpaceX's ambitious launch cadence plans as well as transition from Falcon 9 and Falcon Heavy rockets to more propellant-intensive Starship megarockets.
- We forecast Linde's space revenue increasing sevenfold over the next five years, helping boost the firm's annualized revenue growth profile by around 100 basis points. That said, we note that revenue growth from space has a higher degree of uncertainty than Linde's other revenue streams.
- We estimate that the space end market currently accounts for only around 1% of Linde's revenue, but we expect it to grow to around 8% by 2040.
We See SpaceX's IPO as a Major Catalyst for the Space Supply Chain
Industrial gas firms have supplied the space end market for decades. Air Products APD has worked with NASA since 1957, supplying liquid hydrogen and other industrial gases for the Apollo, Space Shuttle, and Orion missions. Linde has supplied liquid oxygen to the Kennedy Space Center since the Apollo program. Nonetheless, the space end market has been a relatively small and largely overlooked part of industrial gas firms' portfolios.
We expect the SpaceX IPO to change that, putting a major spotlight on the rocket launch supply chain. Although none of the three industrial gas firms we cover (Air Liquide AI, Air Products, and Linde) explicitly disclose their space exposure, we estimate that the space end market currently accounts for a low-single-digit percentage of revenue for all three firms, with Linde being the largest player in absolute dollar terms.
Source: Morningstar estimates.
All three industrial gas firms we cover play an important role in SpaceX, NASA, and other launches. Linde is currently SpaceX's main partner, serving as the primary supplier of liquid oxygen and liquid nitrogen, as well as other industrial gases, for the launch complexes in Florida and Texas. Air Products plays an important role as a helium supplier, while Air Liquide acts as a supplemental supplier.
Industrial gas firms have been expanding their capacity to support increasing launch activity at SpaceX's launch sites in Starbase, Texas, as well as the Kennedy Space Center and Cape Canaveral Space Force Base in Florida.
Linde is expanding its industrial gas facility in Mims, Florida, with additional capacity starting up in the first quarter of 2027, following two previous expansions in 2020 and 2024. In the first quarter of 2026, Linde also started up a new air separation unit, or ASU, in Brownsville, Texas, which will provide liquid oxygen and liquid nitrogen for SpaceX's Starship launches from the Starbase facility.
Air Products announced a new ASU in Cocoa, Florida, that will produce liquid oxygen, nitrogen, and argon for space launch providers, including SpaceX. Management expects Cocoa ASU to come on-stream in the second half of 2028.
Rockets Run on Liquefied Industrial Gases
Industrial gas firms supply propellants for rocket launches, as well as other industrial gases that play an indispensable role in the space end market. For SpaceX's Falcon 9, Falcon Heavy, and Starship launches, propellants (including liquid oxygen, liquid methane, and RP-1 kerosene) account for over 90% of the rocket's total mass at liftoff.
Industrial gases play a variety of different roles in rocket launches, as illustrated below:
Cleared for Takeoff: We Expect Rapid Growth in the Space End Market
Although the commercial space launch industry is still in a nascent stage, the total number of launches has already increased meaningfully over the last decade, and the Federal Aviation Administration, or FAA, forecast indicates a further acceleration over the next 10 years.
Over the next decade, the FAA forecast implies the number of launches will almost triple in the base case scenario and increase fourfold in the bull case scenario. SpaceX is currently responsible for almost 85% of all launches, so we believe that Linde, its main industrial gas partner, is well-positioned to benefit from this expected growth.
Source: FAA Aerospace Forecast Fiscal Years 2025-45.
In addition to the accelerating increase in the number of launches, we also expect a trend toward more propellant-intensive launches as SpaceX ramps up its Starship megarocket launches. Starship launches use significantly more propellant than Falcon 9 and Falcon Heavy launches.
Source: SpaceX, Wevovler, Morningstar estimates.
The relative propellant intensity of different SpaceX vehicles is important from the perspective of industrial gas firms, because we forecast SpaceX to quickly ramp up the number of more propellant-intensive Starship launches.
Source: SpaceX, Morningstar estimates.
We forecast that an increasing number of total launches, combined with a growing share of Starship megarocket launches, will drive tremendous growth in overall demand for propellants such as liquid oxygen and liquid methane. Linde does not supply RP-1 or liquid methane, so we expect liquid oxygen to be the primary driver of revenue growth for the firm.
Source: SpaceX, Morningstar estimates.
The Market Underappreciates Linde's Upside From SpaceX
As the largest industrial gas supplier to the space end market and the main partner to SpaceX, we expect Linde to significantly benefit from the accelerating number of commercial space launches as well as the transition to more propellant-intensive Starship megarockets. Linde's management recently said that the company currently supports around 70% of all SpaceX launches.
Although we expect Linde's market share to gradually decline in the long run, we think the company is by far best positioned to capitalize on the commercial space boom.
Source: FAA Aerospace Forecast Fiscal Years 2025-2045.
We believe the market underappreciates the upside potential of SpaceX's rapidly increasing launch cadence. We think that Linde's space revenue could increase as much as sevenfold by 2030. While we estimate the space market currently accounts for only about 1% of Linde's revenue, we forecast it could grow to about 8% of total revenue by 2040.
Linde is rarely cheap, but the stock is currently trading roughly 6% below our fair value estimate, which we consider an attractive entry point for a wide-moat industrial gas firm with a resilient business model, which we also consider a low-risk play on the commercial space race.
Download as a PDF: Fueling the Future of Space Exploration