
4 min read
US Fund Flow Streak Snaps in September
Explore our monthly breakdown of fund flows to understand the short- and long-term trends affecting equity funds, sector-equity funds, bond funds, and more.

Key Takeaways
Long-term US funds gathered just $27 billion in September, their lowest mark since tariff-driven outflows in April 2025.
Taxable-bond funds collected inflows despite a significant bond selloff, though their $37 billion intake was underwhelming relative to recent history. Ultrashort bonds accounted for $21 billion in new assets. Investors also leaned into long-dated Treasuries, given their historically high yields.
US equity funds suffered a $32 billion outflow in September, their first since May and largest since January.
Explore our monthly breakdown of fund flows to understand the short- and long-term trends affecting equity funds, sector-equity funds, bond funds, and more. September ended a five-month streak of $100 billion-plus months, as long-term US funds collected just $27 billion in net inflows, their lowest total since an April 2025 outflow.
Rising interest rates and inflation concerns pushed investors toward more conservative positioning, while US equity funds posted their largest outflow since January.
For a complete view of fund flows in September, download the free US Fund Flows report.
A Lackluster Month Brings Long-Term Fund Flows Back Down to Earth
Long-term US funds accumulated less than $27 billion in September, their lowest total since an April 2025 outflow, ending a five-month streak of inflows over $100 billion. Taxable-bond funds carried inflows once again, while US equity funds experienced their largest outflow since January. Higher interest rates, inflation concerns, and rich valuations likely drove conservative-allocation decisions in September.
Monthly Long-Term US Fund Flows

Source: Morningstar Direct Asset Flows. Data as of Sept. 30, 2026.
Ultrashort Bond Funds Stay Hot, The Rest of Taxable-Bond Funds Do Not
Taxable-bond funds brought in an underwhelming $37 billion in September, the second-lowest figure since the tariff-driven outflows of April 2025.
Ultrashort bond funds continued their hot streak, raking in $21 billion for the month—the second-largest figure in history, trailing only March 2026’s intake. With heightened inflation and rising rates, many investors leaned into these funds, which carry less interest rate risk.
Increased Uncertainty Drives Investors Out of Corporate Bonds
Amid rising rates, high-yield and corporate bond categories experienced the largest outflows across the taxable-bond category group as investors pulled $5 billion and $4 billion from these credit-sensitive categories, respectively.
High-yield bonds were also hurt by significant spread widening in September. This wasn’t the case for all corporate-backed debt; bank-loan funds gathered over $1 billion during the month, their largest figure since February 2025.
Investors may have been persuaded to invest in these lower-quality assets because of their negligible interest rate sensitivity.
Navigating Market Volatility Through Fund Flows Data
International-Equity Funds Post Sixth Straight Quarterly Inflow
International equity funds’ $2 billion inflow in September contributed to a $9 billion gathering for the quarter, their sixth straight positive quarter despite some recent weaker monthly flows.
The foreign large-blend category led, unsurprisingly, with a $23 billion quarterly inflow, largely into passive funds, while focus-region funds aimed primarily at South Korea and Canada added $8 billion.
The foreign large-growth category led net losers with a $29 billion outflow, while two other growth categories combined for an additional $7 billion.
Sector-Equity Funds Return to Inflows, Even as Industrials Go Off-Track
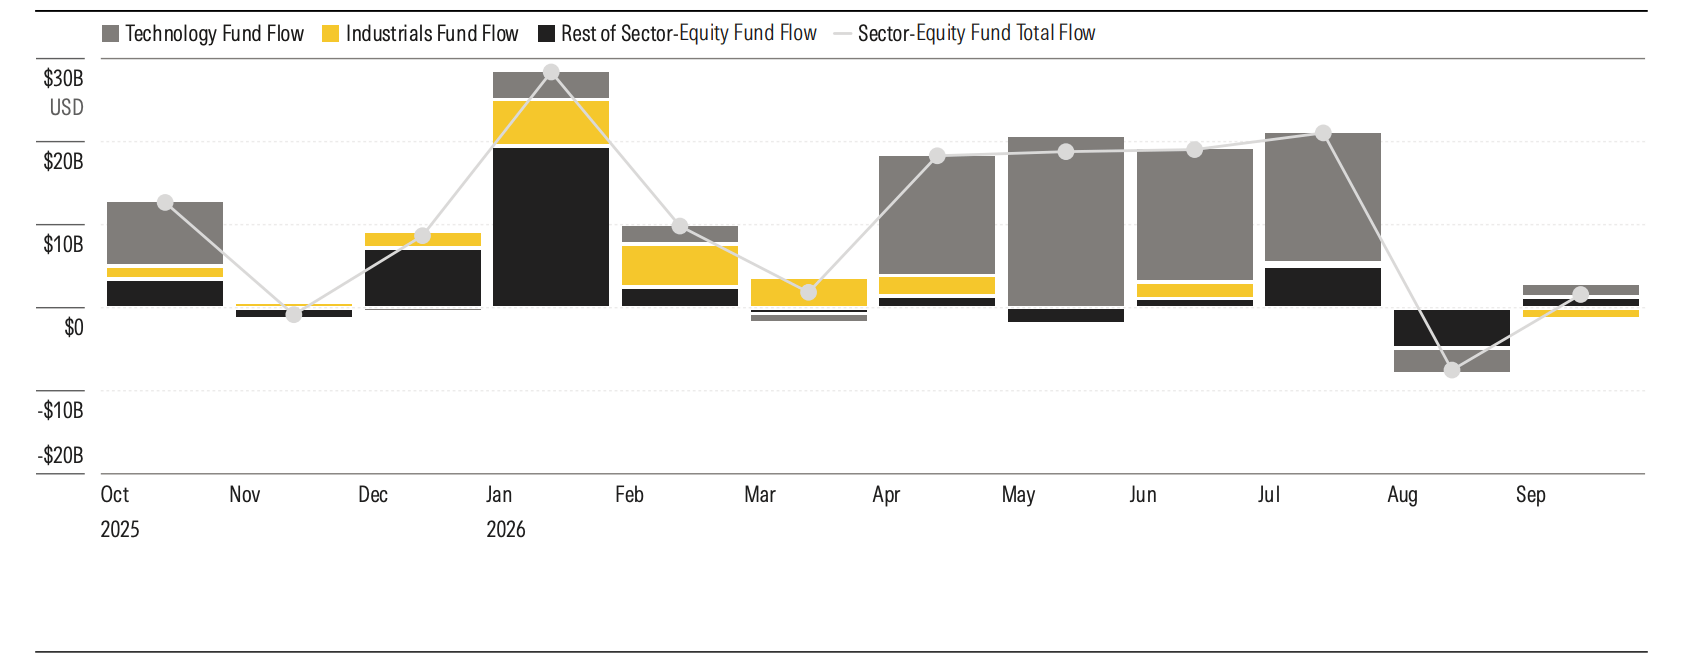
Sector-equity funds secured a small $2 billion inflow in September, contradicting an $8 billion outflow in August. Technology sector funds also returned to inflows, with a similarly sized intake as the category group.
A semiconductor ETF led the category, but other top fundraisers represented a broad array of tech themes. Roundhill Memory ETF suffered the largest outflow of nearly $2 billion, tempering its high-velocity gains earlier this year.
Meanwhile, industrial funds shed $1 billion, their first meaningful outflow since April 2025 and largest since May 2022.
Sector-Equity Fund Flows
Source: Morningstar Direct Asset Flows. Data as of Sept. 30, 2026.
Investors Flee US Equity Funds in September
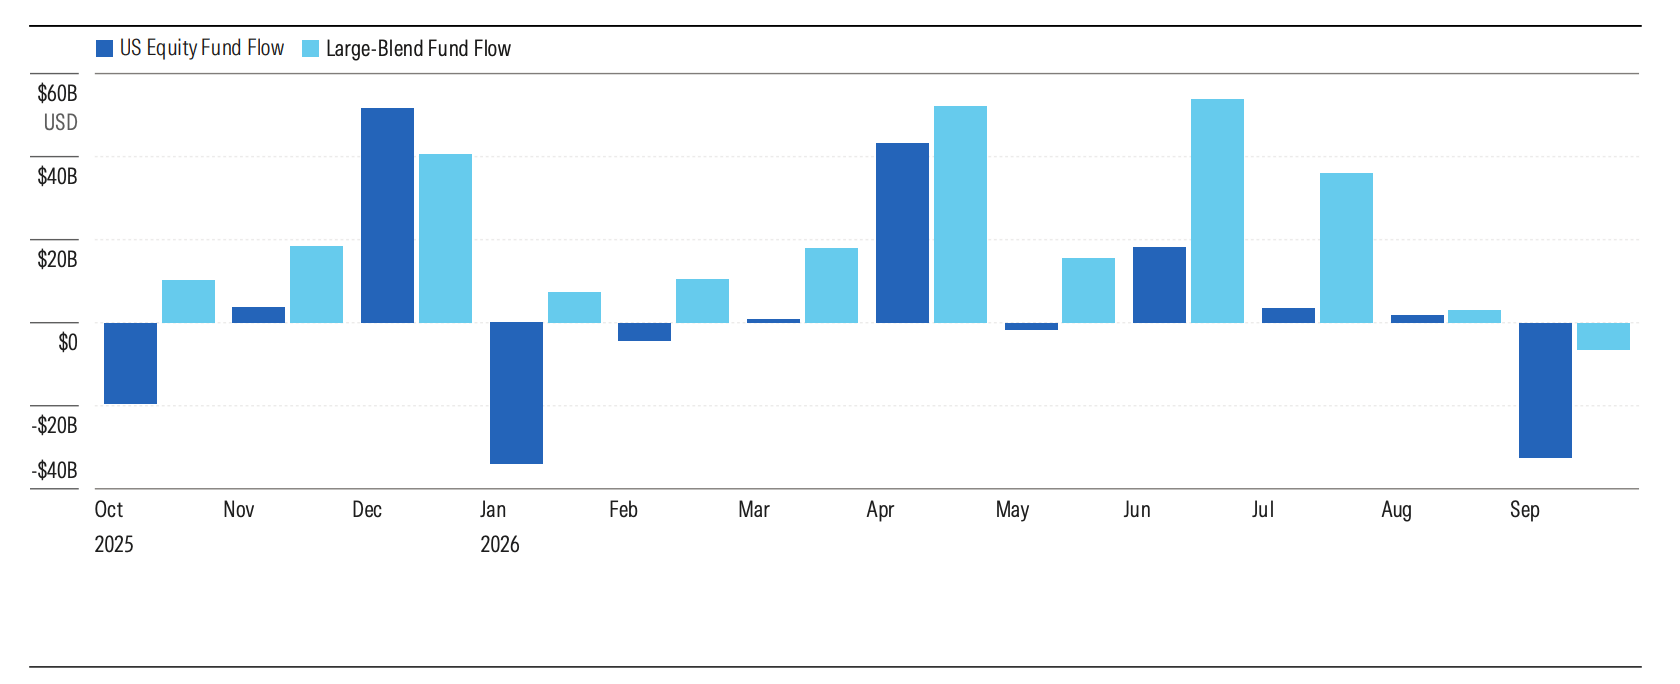
US equity funds suffered a $32 billion outflow in September, their first since May and largest since January. The normally resilient large-blend category also saw a $6 billion outflow, its first since September 2025, while large-growth funds had the biggest outflow at $17 billion.
Their opposing fortunes over the quarter saw large-blend attracting $33 billion and large-growth shedding $22 billion, with $27 billion leaving the broader category group.
US Equity Fund Flow vs. Large-Blend Fund Flow
Source: Morningstar Direct Asset Flows. Data as of Sept. 30, 2026.
How Financial Advisors Can Use Fund Flows Data
How Financial Advisors Can Use Fund Flows Data
Fund flows data offers a real-time window into how investors are positioning portfolios in response to changing market conditions.
September’s data points to several important trends:
- A pullback in long-term fund flows, as higher rates and renewed inflation concerns drove more conservative allocation decisions.
- Continued but underwhelming demand for taxable-bond funds, with ultrashort-bond funds staying in high demand among investors seeking less interest-rate risk.
- A rotation out of municipal open-end funds and into lower-fee ETFs, as a muni-bond selloff presented a tax-loss harvesting opportunity.
- A sharp reversal in US equity funds, which posted their largest outflow since January, led by large-growth funds.
- Continued support for international equities, marking a sixth consecutive quarter of inflows.
- A rebound in sector-equity funds, as technology funds returned to inflows even as industrials posted their first meaningful outflow since April 2025.
Advisors can use these insights to:
- Understand how investors are positioning portfolios amid higher rates and inflation concerns.
- Compare portfolio exposures against broader market trends.
- Identify emerging areas of investor demand and potential concentration risks.
- Prepare for client conversations around fixed income, equity positioning, and international diversification.
More on Fund Flows From Morningstar
Monitor overall market sentiment, research sector movements, and perform competitive analysis in Morningstar Direct, our investment analysis application.
Morningstar’s fund flows data covers more than 17,000 share classes and $23.5 trillion in total net assets in the United States. Stay current on market trends with a comprehensive picture of collective investment trusts, money-market funds, separate accounts, open-end funds, and ETFs.
Direct offers daily snapshots as well as historical time-series data at monthly, quarterly, and annual frequencies.




Note: The figures in this report were compiled on July 13, 2026, and reflect only the funds that reported net assets by that date. The figures in both the commentary and the extended tables are survivorship-bias-free. This report includes both mutual funds and exchange-traded funds but not funds of funds unless specifically stated. It does not include collective investment trusts or separate accounts.
Important methodology note: Morningstar computes flows using the standard approach in the industry: Net flow is the estimated change in assets not explained by the performance of the fund. Our method assumes that flows occur uniformly over the course of the month. Adjustments for mergers are performed automatically. When liquidated funds are included, the fund's final assets are counted as outflows. Reinvested dividends are not counted as inflows. We use fund-level reinvestment rates to improve accuracy in this respect. We make ad hoc adjustments for unusual corporate actions such as reverse share splits, and we overwrite our estimates with actual flows if managers are willing to provide the data to us. When possible, Morningstar offsets outflows caused by transfers to other investment vehicles that share an identical mandate since they are not indicative of a change in investor interest.