36 min read
The State of Semiliquid Funds 2026
The State of Semiliquid Funds 2026
The semiliquid fund market is nearing $600 billion in assets, but its growth has come with important lessons. Since our 2025 State of Semiliquid Funds, the market has pivoted. After clamoring to enter private credit funds in late 2024 and early 2025, investors are now looking to exit them in droves. A reminder that access to private markets is valuable only when investors understand what they own.
That understanding is improving, but investors need a clearer, more consistent language for evaluating these funds' trade-offs. Morningstar is trying to help; we have assigned forward-looking Morningstar Medalist Ratings to 19 semiliquid funds and are rating more to assist in evaluating these vehicles. Just 16% of advisors feel very familiar with them, according to our 2026 Investor Perspectives Survey.
This year's report examines the forces that matter most to investors: fees, liquidity, leverage, and their combined impact on results. While fees are higher than public market counterparts, early signs point to meaningful fee competition within 401(k)s, where the US Department of Labor is focusing on fiduciary duties around private markets.
Our goal is to give investors the clarity, context, and common language they need to make better decisions in a market where innovation often outpaces education.
Source: 2026 Morningstar Investor Perspectives.
Key Takeaways
- Semiliquid funds are approaching $600 billion in net assets as of the end of March 2026, more than double the amount at the end of 2022.
- Private credit funds drove most of the growth but have fallen out of favor in 2026 as software exposure and credit quality concerns spurred redemption requests.
Investors have turned their attention—and wallets—toward private equity and venture capital semiliquid funds.
- Semiliquid fund fee transparency is improving as more unlisted BDCs include incentive fees in their prospectuses after Morningstar pushed for better disclosure.
There are hints of fee competition in the 401(k) market: Blackstone will let plans choose between collective investment trust share classes with an incentive fee or a flat-fee share class that could be a better deal for retirement savers.
- Liquidity profiles across semiliquid funds are wide, driven by both asset class and manager preference.
- Morningstar analysts rated 19 semiliquid funds over the last year, but only four earned a Medalist Rating of Bronze or Silver, reflecting our view that beating public market indexes is a high bar given high fees and cash balances.
- Flows, fair value hierarchies, payment-in-kind, leverage ratios, and pre-launch data are now available for semiliquid funds in Morningstar Direct.
- Lending spreads and net investment income are falling for private credit funds.
Source: Morningstar Direct.
Assets, Flows, and Competitive Landscape
Semiliquid Fund Assets Approach $600 Billion
Net assets in semiliquid funds approached $600 billion at the end of March 2026, up more than 120% from the end of 2022.
Until recently, strongdemand for direct lending private credit—40% of all assets—drove the growth.
Private credit fund demand began to slow in 2025's second half as concerns over software exposure and lower base rates cooled investors on the asset class. In the first quarter of 2026, net assets for that Morningstar Category dipped by about $1 billion.
Interest in semiliquid venture capital funds has increased, owing to investor enthusiasm for popular companies like SpaceX SPCX, Anthropic, and OpenAI. Assets in the category nearly tripled in 2025, and the trend continued in 2026's first quarter.
The private equity category also saw heightened demand as a wave of recently launched private placement semiliquid funds attracted inflows.
Source: Morningstar Direct, PitchBook, SEC filings. Data as of March 31, 2026. Author’s note: The 2025 State of Semiliquid Funds report used GAAP Net Assets for Direct Real Estate. This year’s version uses the management’s NAV calculation.
A Sharp Reversal in Private Credit Demand
Investor fears that the artificial intelligence boom will have a negative impact on software companies led to a stampede out of private credit semiliquid funds in the first quarter of 2026. It’s the first real liquidity test these funds have faced since gaining popularity.
Private credit semiliquid funds typically cap quarterly liquidity at 5%, but redemption requests swamped the largest funds in the first quarter. Blackstone and Oaktree went above and beyond to honor all withdrawals, but in the second quarter, Blackstone capped withdrawals at 5%.
Redemption Requests Spiked for Direct Lending Funds in the First Quarter of 2026
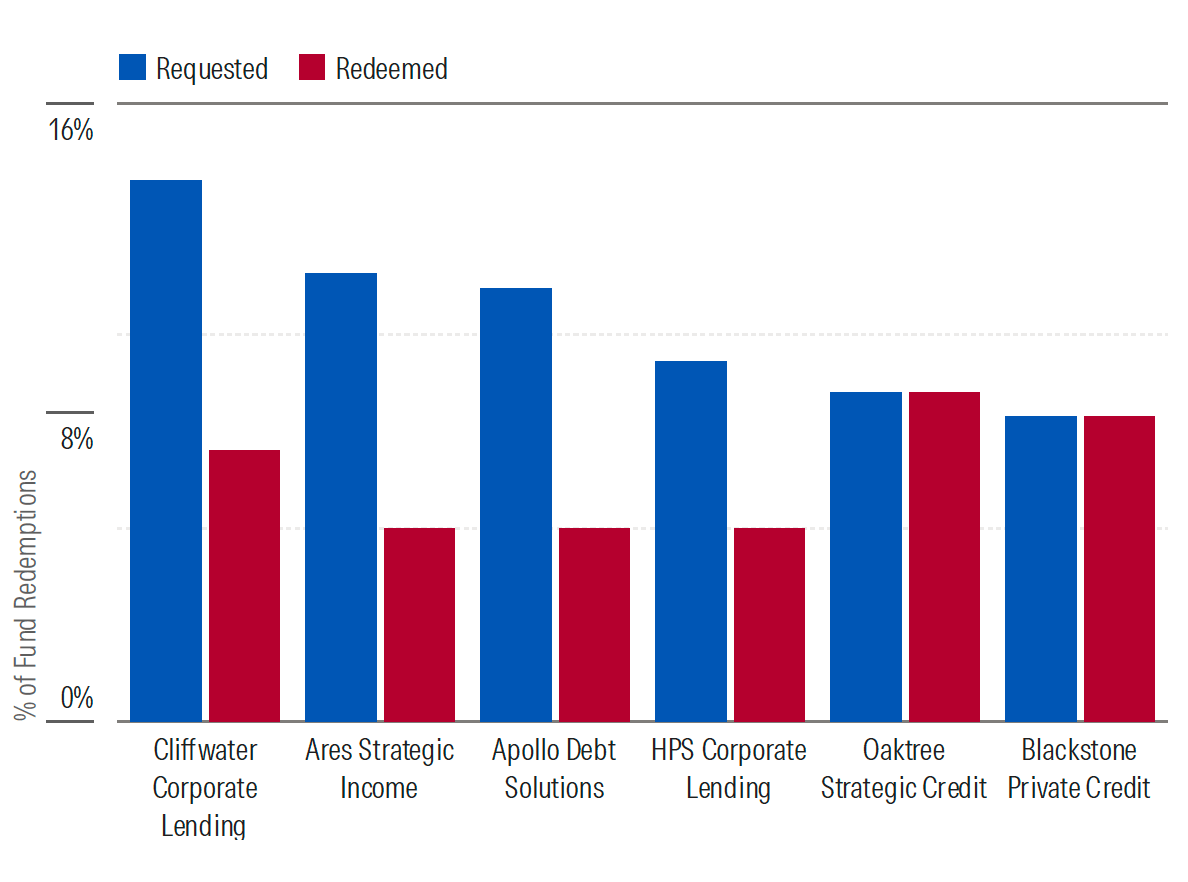
Source: PitchBook, SEC filings, Bloomberg News.
Private Equity and Venture Capital Are on the Rise
- Investor excitement over AI and space exploration spilled over into semiliquid funds over the 12 months ending March 2026.
The venture capital category saw net inflows of approximately $8 billion over that period, up from almost zero for the 12 months ending March 2024, as investors scrambled for pieces of companies like SpaceX, Anthropic, and OpenAI, each of which plans initial public offerings in 2026 at valuations of more than $1 trillion.
There was also demand for traditional private equity, where net inflows rose to about $14.5 billion from $6 billion two years ago. The strong early returns of funds that invest in secondary funds helped them garner interest, even though the accounting practices driving those returns may not be tenable (see the section on secondaries).
Private debt—direct lending saw a stiff drop in interest, particularly in the last six months, as investor redemption requests spiked.
Source: Morningstar Direct, SEC filings. Data as of March 31, 2026.
Semiliquid Funds Are Moving Upstream
Semiliquid funds, including interval funds, nontraded BDCs, nontraded REITs, and tender-offer funds, have expanded access to private markets to investors who don't meet accredited investor or qualified purchaser requirements. They work well for many alternative asset classes, but private equity and direct infrastructure are more challenging.
There are two issues. First, the Investment Company Act of 1940 was not built for private equity strategies that often take large stakes in companies and exert considerable control over them. When a 1940 Act fund owns more than 25% of a company, the law considers that company as an affiliate and limits future transactions. Second, registered funds face restrictions on co-investing alongside a manager's private drawdown funds, and even with SEC relief, a new semiliquid fund is often too small to receive meaningful allocations to the same deals.
These constraints help explain why the industry is increasingly launching semiliquid funds through private placement structures rather than registered vehicles. Many widely available private equity semiliquid funds avoid the regulatory hurdles by investing as minority shareholders or allocating capital to other funds. But those workarounds can dilute the very features that have historically driven private equity returns: operational control, active ownership, and direct access to attractive deals. Fund-of-funds structures also add another layer of fees. For managers seeking to preserve their traditional investment approach, limiting access to accredited investors and qualified purchasers is often the more attractive option.
The Most Popular Semiliquid Asset Managers and Funds
Blackstone dominates the semiliquid landscape. Its 2017 launch of Blackstone Real Estate Investment Trust, the first semiliquid vehicle from a major alternatives firm to gain meaningful advisor traction, gave it a first-mover advantage still unmatched by competitors, and it held the two top spots by trailing 12-month net inflows even as investors sold its private credit fund in early 2026. The 2023–24 launches of KKR Private Equity Conglomerate and Blackstone Private Equity have since sparked broader appetite for private equity, while Coatue Innovative Strategies has quickly become the largest semiliquid venture capital fund since its June 2025 debut, with holdings that include Anthropic and OpenAI.
Source: Morningstar Direct, PitchBook, SEC filings. Data as of March 31, 2026.
Coming Soon: A Look at Pre-Inception Product Trends
Morningstar now tracks semiliquid funds in registration prior to their inception. At the end of May, there were approximately 100 semiliquid funds lined up to launch. Private credit continues to be a popular strategy, but private multi-asset funds that invest across multiple private markets, typically through existing semiliquid funds, are also on the rise. Interval funds remain the most popular vehicle thanks to their ease of use relative to other semiliquid vehicles, such as no subscription documents and set withdrawal windows.
Source: Morningstar Direct. Data as of May 30, 2026. Category assignments are based on portfolio holdings. Pre-inception categories are based on language in registration documents and are subject to change when actual portfolios are reported.
The Morningstar Medalist Rating for Semiliquid Funds
Morningstar qualitatively assigns forward-looking Medalist Ratings for registered vehicles such as interval funds, tender-offer funds, unlisted BDCs, and unlisted REITs.
We began releasing ratings in 2025. Analysts covered 19 semiliquid fund strategies as of May 30, 2026. Morningstar expects coverage to double by the end of 2026.
Only four share classes earn a Medalist Rating of Bronze or Silver, reflecting our view that beating public market equivalents is a high bar.
Managing portfolios with intermittent liquidity and private assets introduces significant operational complexity, particularly around deal sourcing, security valuation, and governance.
Because success depends on these factors, Morningstar’s rating methodology for semiliquid funds places extra weight on the investment Process and the Parent company overseeing the strategy. Fees are also critical.
Ratings can move up, down, or not at all depending on if they look cheap, expensive, or average compared to peers. (See the methodology document for more details.)
For the full list of Medalist ratings, see the Appendix.
Source: Morningstar. Data as of May 30, 2026.
How Much Do Semiliquid Funds Really Cost?
Semiliquid Funds Cost Significantly More Than Public Market Mutual Funds or ETFs
Investors used to mutual funds and ETFs who look at semiliquid optionsare in for sticker shock. The average annual report net expense ratio, adjusted for borrowing costs, for semiliquid funds was just over 3%. That number, however, understates the true costs on account of inconsistently disclosed incentive fees and, at funds of funds, acquired fund fees and expenses.
Source: Morningstar Direct. Borrowing costs are excluded from Morningstar’s adjusted net expense ratio calculations. Excludes outliers in each category that are more than 3 standard deviations from average.
Fee Structures Are More Complex in Semiliquid Vehicles
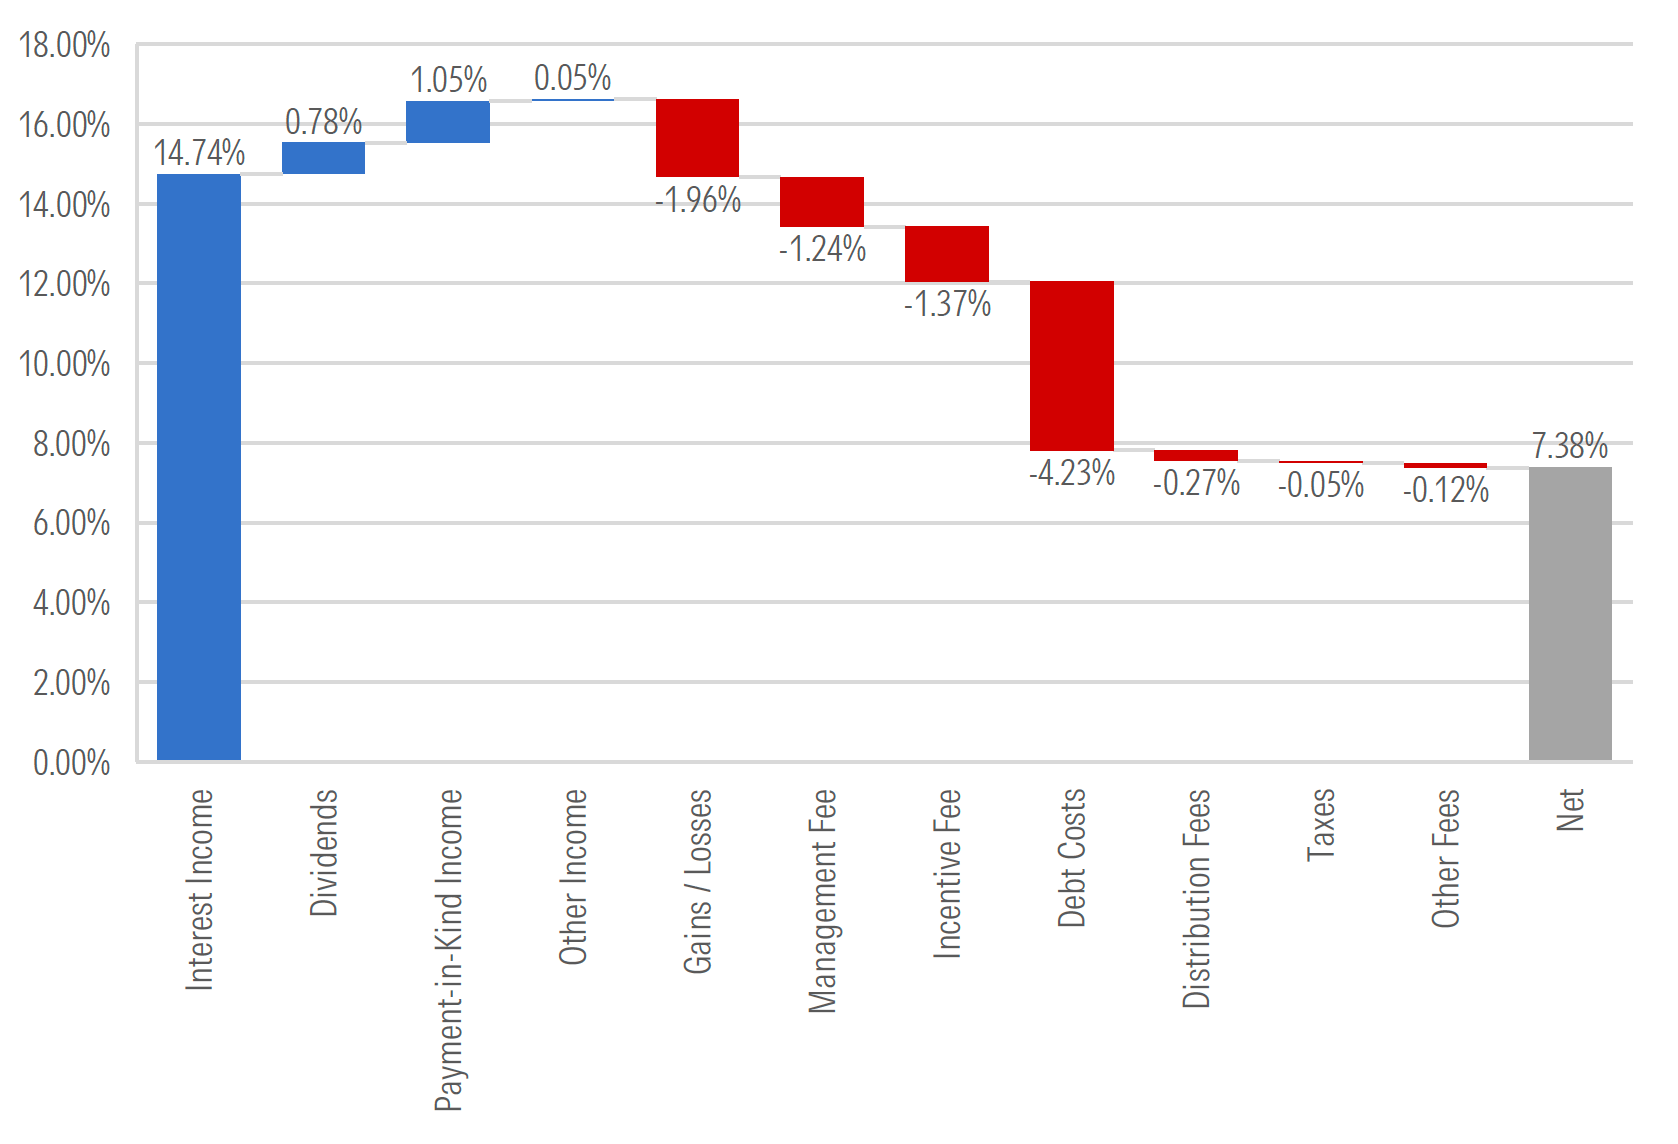
Semiliquid funds have more complex fee structures than mutual funds or ETFs. First, many employ leverage or use debt or debtlikeinstruments to increase their asset bases. That leverage comes with costs. Semiliquid funds also often charge incentive fees, which can rival—or even exceed—management fees. The charts below compare the impact of various fees on the returns of Blackstone Private Credit with SPDR Blackstone High Income ETF HYBL.
Semiliquid Fee Waterfall: Blackstone Private Credit (Calendar 2025)
ETF Fee Waterfall: SPDR Blackstone High Income ETF (June 2024–June 2025)
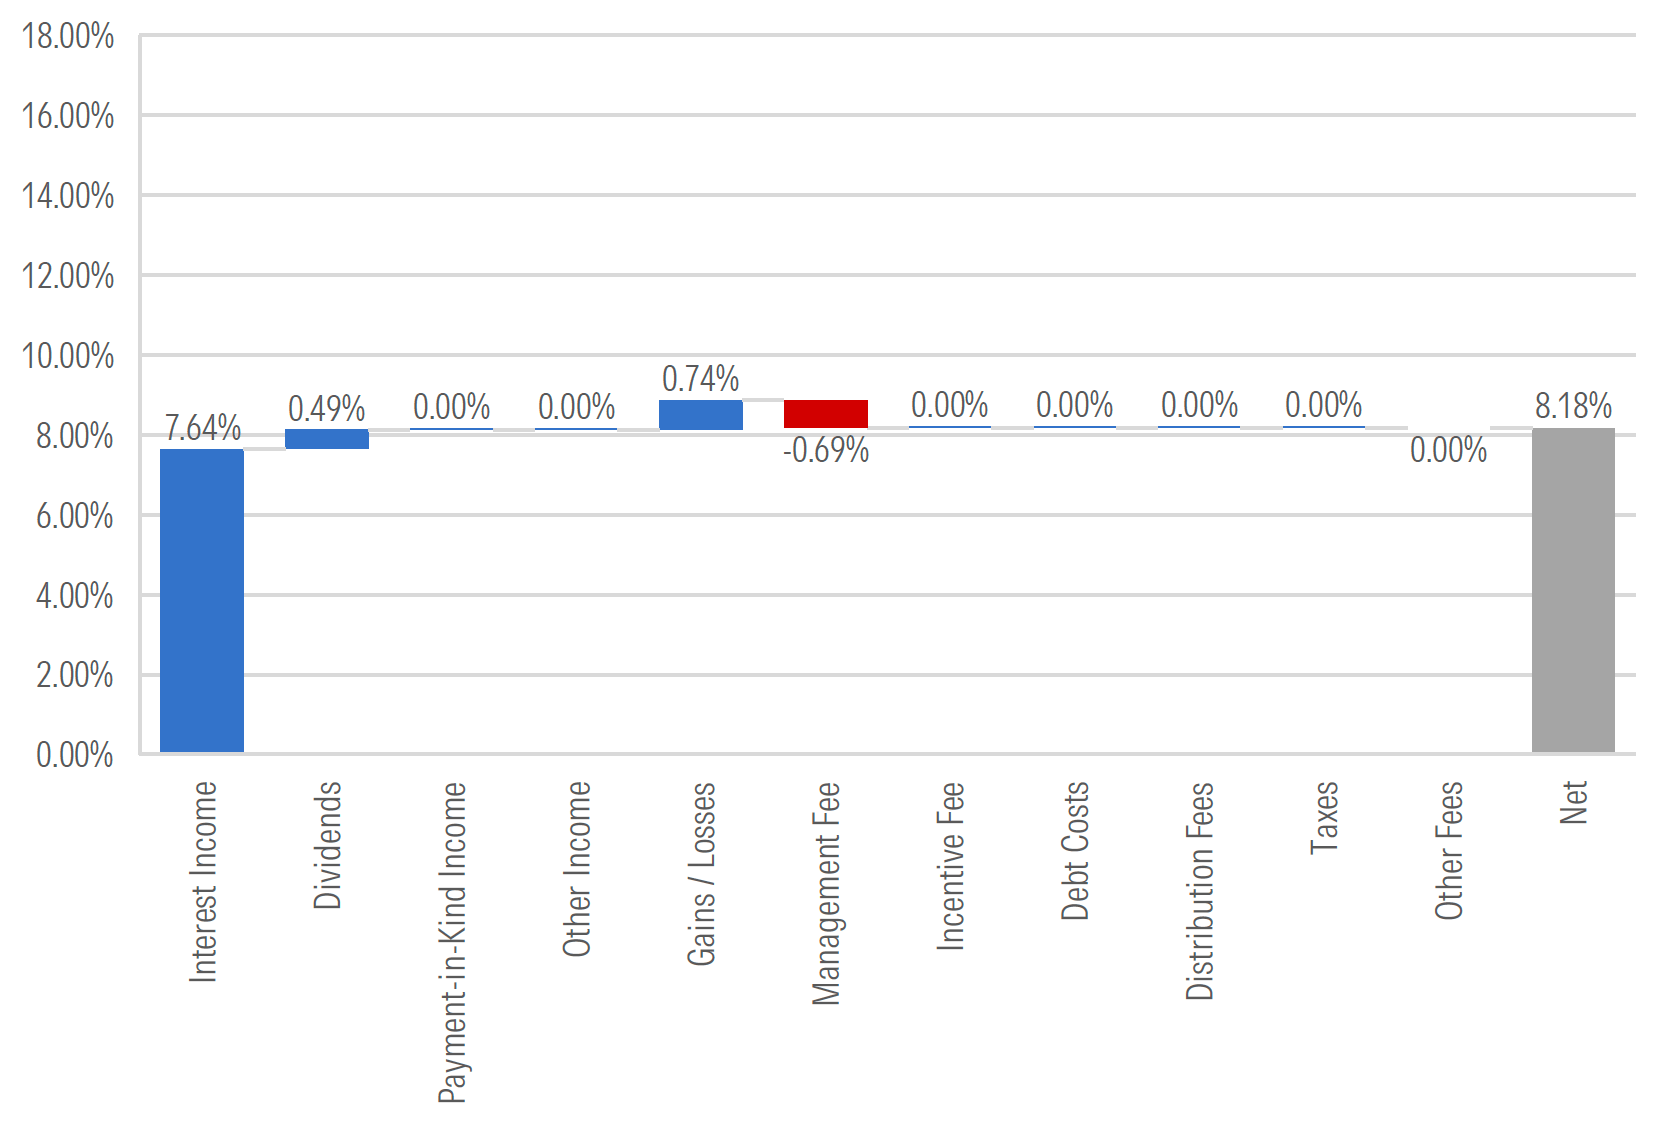
Source: SEC filings. Data is for illustrative purposes only. Data as of the last annual report. For Blackstone Private Credit, the annual report is as of December 2025, while SPDR Blackstone High Income ETF is as of June 2025. Income and expenses expressed as a percentage of implied average daily net assets.
BDC Fees Are Rising Owing to More Frequent Incentive Fee Disclosure
Until recently, many private credit funds, especially unlisted BDCs, did not include incentive fees in their prospectus fee tables because fund companies often considered them unpredictable (which is questionable, as the next section shows). That has complicated fee comparisons with funds that did show their incentive fees. More BDCs, however, updated their prospectuses to include incentive fees after Morningstar pushed for better disclosure in early 2026.
Source: Morningstar Direct. Annual figures based on latest updated prospectuses filed in each year.
Incentive Fees Rarely Reward True Skill
Investors should expect to pay full incentive fees whether the funds disclose them in their prospectuses or not. In private credit especially, incentive fees are effectively additional management fees since they almost always lend at floating interest rates at or above their fixed hurdle rates. As shown below, as long as base interest rates are above zero and funds employ some leverage and avoid serious credit issues, clearing their hurdles is not challenging.
Percentage of Maximum Possible Incentive Fees Earned by Base Rate and Leverage Scenario
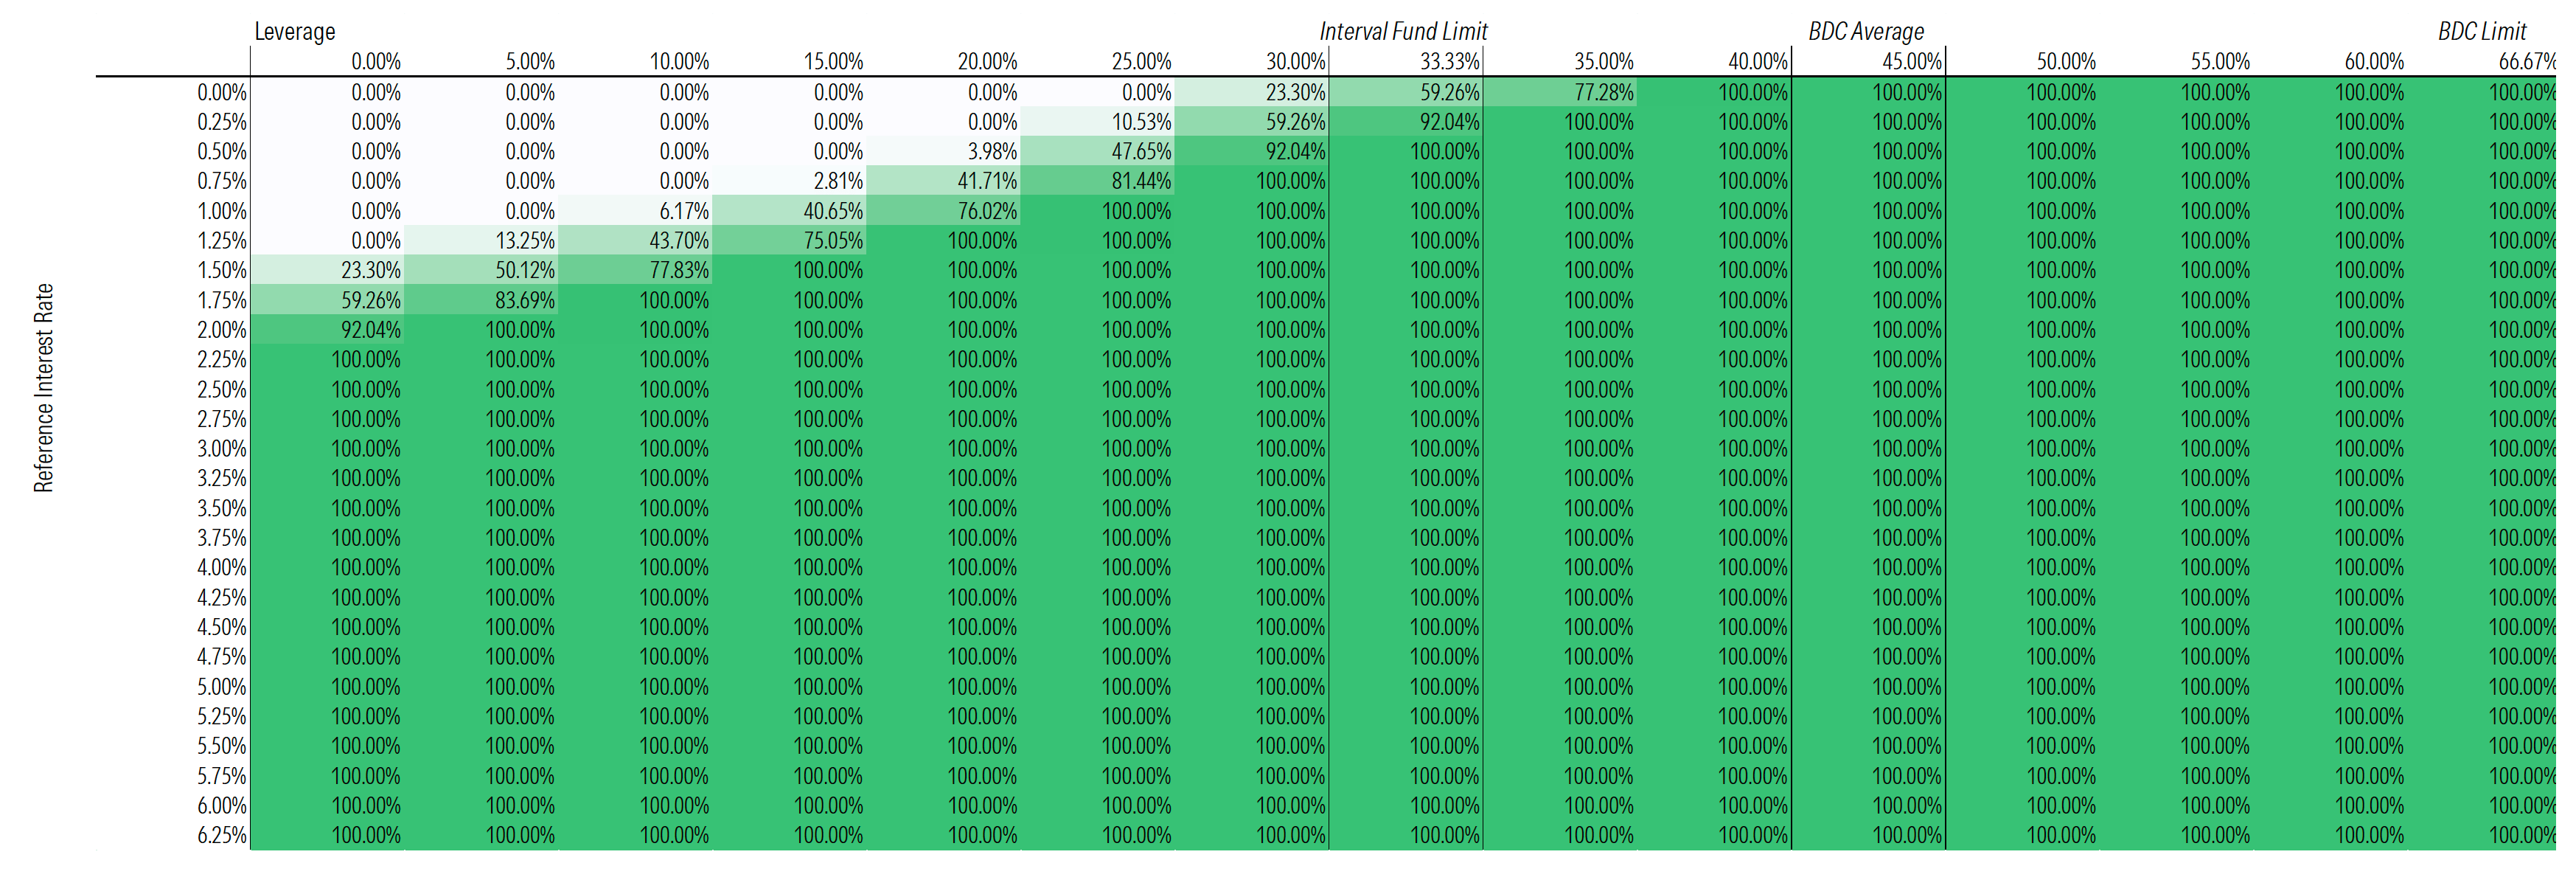
Source: Author's calculations. Assumes typical BDC fee structure (1.25% management fee, 12.5% incentive fee with full catchupover 5% hurdle). Funds are assumed to lend at 5.5% spread and borrow at 2% spreads.
Acquired Fund Fees Can Often Mislead
Acquired fund fees are supposed to capture the operating expenses of underlying funds that parent funds pay. Disclosure, however, is inconsistent. For instance, a parent fund must report the incentive fees of the BDCs it owns but can do so only if the BDCs disclose those fees in their prospectuses—something they don't always do. Private equity funds can entirely exclude incentive fees from their acquired fund fees and expenses disclosures, making private equity funds of funds’ AFFE look comparable to public market funds of funds when the underlying private funds are much costlier.
Source: Morningstar Direct, SEC filings. Public asset cohort includes funds with 75% or more of assets in actively managed underlying strategies. Funds with 0.1% AFFE or lower are excluded from each group to account for potentially low fund ownership on the PE side and to account for public funds of funds that own zero-cost share classes in order to charge fees at the fund level.
Morningstar’s Semiliquid Fee Methodology Will Create Apples-to-Apples Comparisons
Given the different fee structures and disclosure practices, it is difficult to make pure apples-to-apples comparisons on what semiliquid funds costs. To solve for this, Morningstar created a framework to normalize fees across funds. By applying the same gross return assumptions to each fund’s individual fee structures, all-in fees (and thus, net returns) can be compared with one another.
Source: Morningstar Direct. Data is illustrative. Prospectus data excludes borrowing costs. This assumes the underlying investments all generate the same 10% gross return. Funds are assumed to borrow at the same interest rate (7%), as this methodology is designed to surface fee differences rather than financing advantages.
The Role of Leverage in Semiliquid Portfolios
Fund-Level Leverage Is Common in Private Credit, Less Common in Private Equity
Many private credit funds borrow to boost their asset bases and income- and yield-generating potential. Leverage is costly, though, and adds risk. Private equity funds will sometimes use leverage, often to help meet redemptions or finance company acquisitions. Investing with leverage in private equity or venture capital is particularly risky because their holding periods and returns are long and lumpy.
Source: Morningstar Direct, PitchBook. Excludes private placement 10-12G funds. Leverage is defined as total debt divided by total assets. Average excludes funds that do not utilize leverage.
The Downside of Leverage Has More Impact Than the Upside
Leverage magnifies both gains and losses—but not equally. On account of compounding math, a leveraged portfolio needs to earn more than the leverage ratio suggests just to break even after a loss. In credit investing, where big recoveries are rare, this math is especially punishing. Thus, private credit managers are incentivized to limit downside volatility in particular. Income, not asset appreciation, drives private credit returns. Real losses show up only as write-downs, but managers and borrowers have tools to delay them, including payment-in-kind interest and liability management exercises. These tactics can defer the pain of leverage—but they don't eliminate it.
Source: Data for BDCs is taken from annual reports. Scenarios assume leverage levels, cost of debt, and total assets as of the latest filing.
How Downside Volatility in Leveraged Credit Portfolios Can Hurt Returns
Bank loans and private credit offer similar gross yields, but private credit charges higher fees. So why not just buy a bank-loan fund on margin and pocket the fee savings? Two problems: First, daily price swings erode leveraged returns over time, a phenomenon called volatility decay. Second, private credit funds borrow cheaply in ways most investors can't match, and low borrowing costs are critical to success in leveraged portfolios, as the underlying assets need to generate at least enough to cover debt costs. Private credit’s real edge is in avoiding drawdowns, which, thanks to infrequently changed valuations, is much easier for them than bank-loan funds.
Source: Morningstar Direct. Leveraged return based on 1-to-1 debt/equity ratio and assumes paying a margin rate of SOFR + 2% each period to reflect BDC borrowing costs. In practice, most investors would face higher borrowing costs.
Creating an Apples-to-Apples Return Comparison
It's possible to create apples-to-apples return comparisons by taking the amount and cost of leverage from a semiliquid fund and applying it to public market equivalents. Because this data is disclosed only in periodic filings, this analysis won't recognize the timing of changes to leverage or its cost between filings. But it's a necessary first step at assessing whether leveraged semiliquid funds offer true value. Because of reporting dates and data availability, this chart cuts off market selloffs in 2022 and 2026, which, combined with different leverage and cost assumptions, explains any differences from the prior chart.
Source: Morningstar Direct for leverage ratios and returns, SEC filings and authors' calculations for cost of leverage. Data as of December 2025. Leverage calculations for the Morningstar LSTA US Leveraged Loan Index and Invesco Senior Loan ETF use the same cost of leverage as Nuveen Churchill Private Capital Income and use an average of the BDC's beginning and ending period leverage ratio.
With Leverage, Less Frequent and Shallower Drawdowns Are Critical to Success
Private credit funds post losses almost a third as often as bank-loan funds—and for leveraged portfolios, that consistency matters a lot. Frequent losses accelerate volatility decay and make recovery harder. Timing matters, too: Early losses are especially damaging, since the math of leverage makes deep holes very hard to climb out of. There is thus implicit pressure for private credit funds to keep losses small and infrequent, something that is much easier to do when assets are not actively traded.
Source: Morningstar Direct. Data as of April 2026.
The Road to Redemptions
Most Semiliquid Funds Offer Quarterly Liquidity
Most semiliquid funds offer quarterly liquidity, but the details vary. Tender-offer funds, unlisted BDCs, and REITs can reduce or suspend redemptions at their discretion. Interval funds are the exception: They must honor their stated redemption terms unless shareholders vote to change them, though managers have flexibility in setting those terms upfront. How much investors can redeem in a period also varies. Interval funds must offer to repurchase at least 5% of shares in each repurchase window. Other semiliquid structures can vary their amounts, but most target 5% quarterly. Liquidity terms should match asset liquidity, and greater liquidity offers in private equity or venture capital could be a challenge.
Source: Morningstar Direct.
Private Equity Funds Hold Far More Cash Than Private Credit Funds
Holding cash is the simplest way to guard against unexpected redemption requests, but cash, a low-risk/low-reward asset class, drags on performance. Private credit funds hold far less cash, on average, than private equity funds, which is consistent with the liquidity profiles of each asset class. The more than 30% cash stakes in some private equity funds are likely yet-to-be-deployed inflows, but it is still common for them to have 10%–15% of assets on the sidelines.
Equity Funds Hold Far More Cash Than Credit Funds
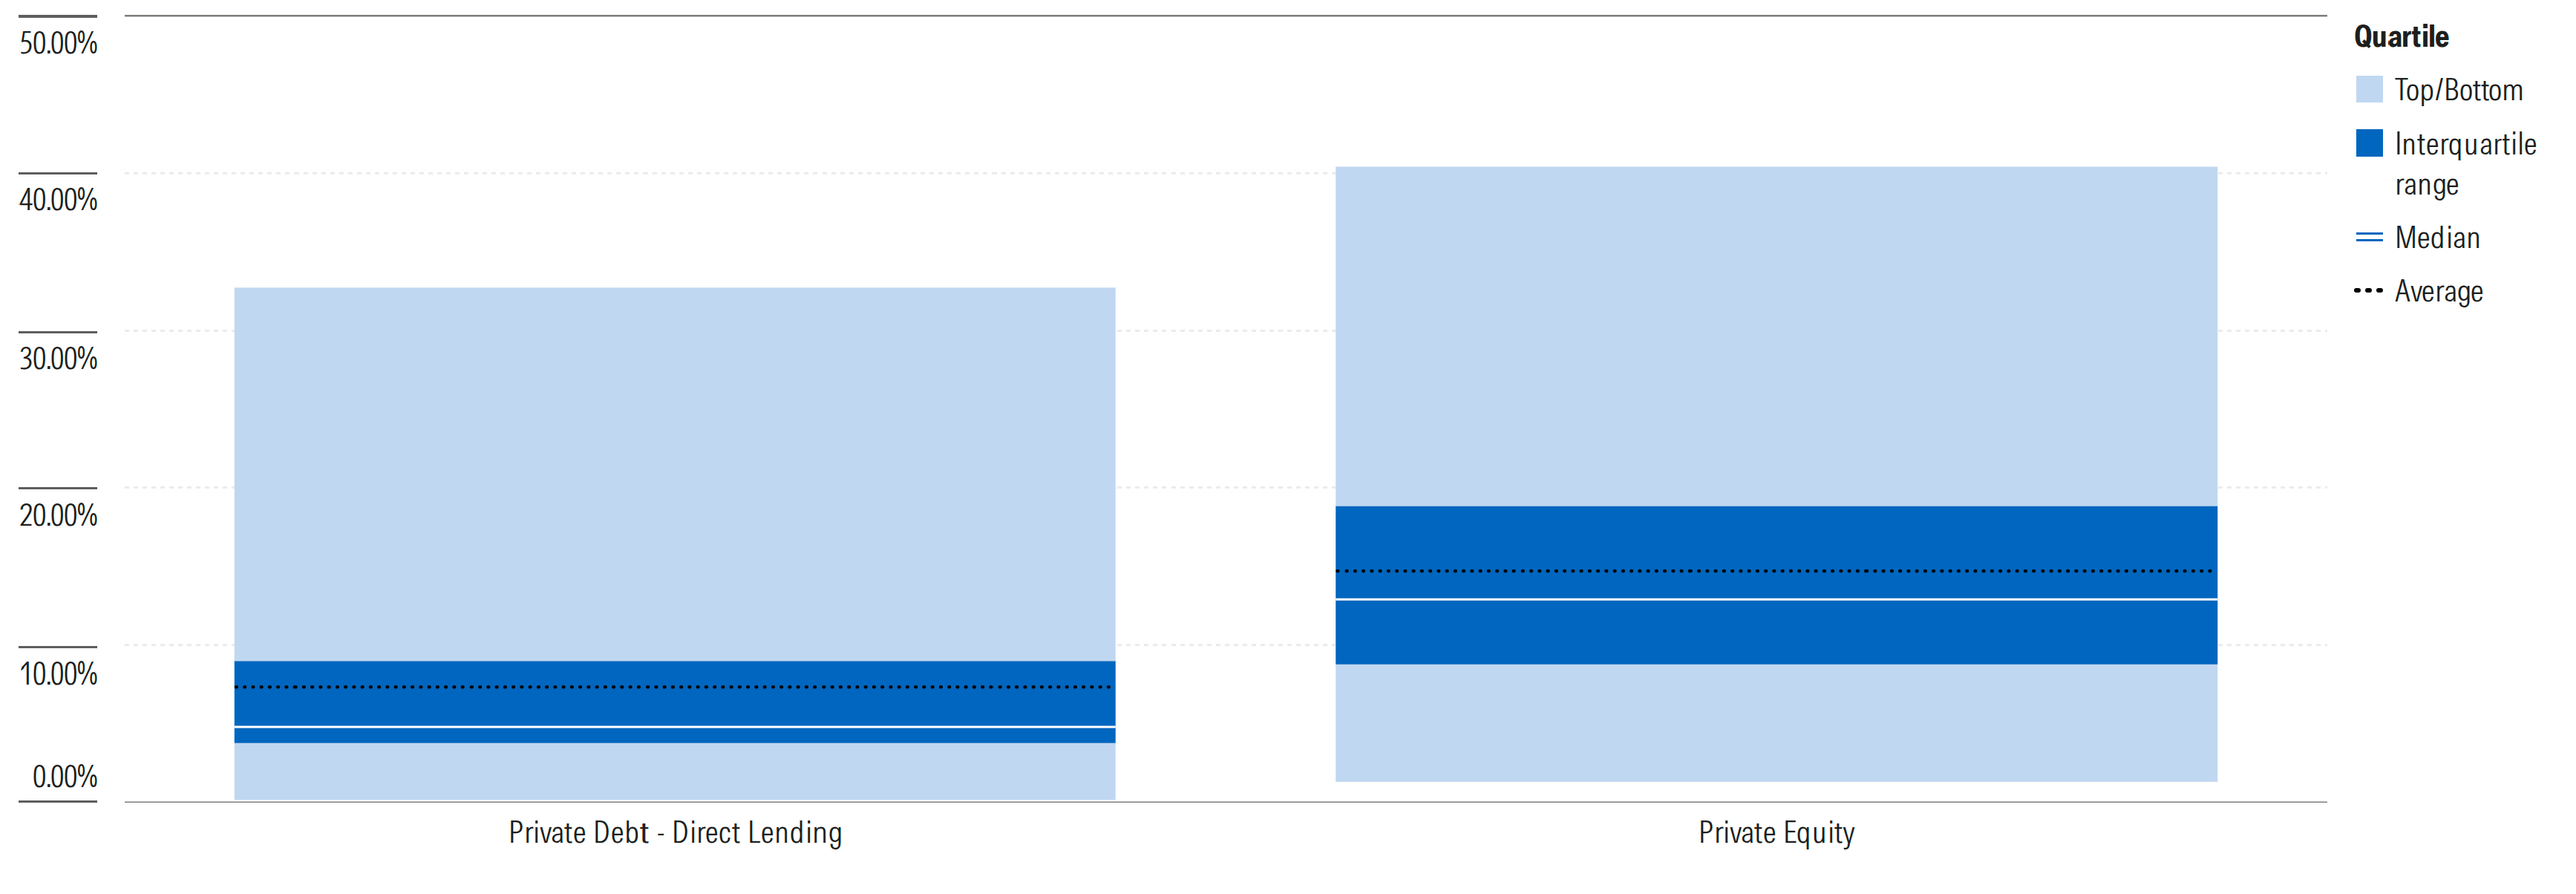
Source: SEC filings. Data from latest 10-k or 10-Q for BDCs and the latest annual or semiannual report for others. Excludes 3+ standard deviation outliers.
Semiliquid Funds Must Balance Cash Drag Trade-Off With Liquidity Sleeves
While cash can be prudent from a liquidity standpoint, it also drags on a portfolio’s return, potentially eroding any excess return. This is especially the case in private equity, where higher cash balances are common. As illustrated below, a fund that charges a 3% fee and holds 10% cash effectively needs to generate 5% annualized gross excess returns to break even with the S&P 500. Generating those kinds of returns is easier said than done, and exceedingly few public equity managers have been able to hit that mark.
Source: Morningstar Direct, author’s calculations. Assumes cash earns money market return from MFS US Government Money Market.
Organic Liquidity Is Critical for Liquidity Management; Equity Funds Are Typically Falling Short
“Organic liquidity,” or the cash funds can raise to meet redemptions without selling holdings, is critical for liquidity management. In equity, it often comes in the form of distributions from underlying funds. Those distributions are down from historic levels, but even a decade ago they were not enough to meet annual redemptions of 20% of assets. This means private equity funds hold slugs of return-diluting cash. Private credit portfolios generate their own liquidity as loans mature or get repaid early—typically when a company is sold or refinances. Direct lending portfolios typically carry 4- to 5-year average maturities, implying that roughly 20%–25% of the portfolio naturally rolls off each year.
Source: Morningstar Direct, SEC filings. Private equity distributions sourced from funds’ statement of cash flows. In cases where funds break out distributions received from the sale of PE positions, only the distributions are included. Some funds combine the two into a single line item. Given that, if anything, these figures overstate the organic liquidity being provided.
But Funds Must Redeploy Capital
Organic liquidity helps but doesn't immunize funds from cash crunches. Managers must constantly decide whether to redeploy the cash their holdings generate or sit on it, and getting the timing wrong creates problems. One useful signal is the retention ratio, which measures how much of a fund’s returned capital (such as loan repayments or fund distributions) is reinvested versus held on the sidelines for other uses. Before 2025, unlisted BDCs were reinvesting more than they were getting back, a sign they were still deploying earlier inflows. Recently, retention rates have risen, suggesting that managers are quietly building cash buffers in anticipation of more investor withdrawals.
Source: Morningstar Direct, PitchBook. Organic liquidity retention rate is defined as 1 minus the amount of capital deployment not attributable to net new equity and debt issuance divided by the total amount of investment repayments and sales.
Unfunded Commitments and Private Equity Semiliquid Funds
The drawdown funds, delayed draw term loans, or lending facilities in which semiliquid funds invest often oblige investors to send them more money at unknown future dates. The funds do not book these obligations as liabilities, though they arguably are. The commitments are critical in assessing funds' ability to manage liquidity. They can suffer legal and reputational consequences if they fail to meet their obligations. The capital calls may not come for years, but managers should have plans for meeting them.
Source: Morningstar Direct, SEC filings. Data as of the latest semiannual or annual report as of May 2026.
How Funds Can Source Liquidity for Redemptions and Unfunded Commitments
- JPMorgan Private Markets is a tender-offer private equity fund. The manager intends to provide quarterly liquidity, though it is not obligated to.
- The fund is well-positioned from a liquidity standpoint, as its sources of cash exceed what it expects in annual redemptions. Still, each bucket is not equal, and the lighter green reflects riskier or more uncertain sources of capital.
- The fund’s cash position is on the high side, reflecting yet-to-be-invested capital, so while it is not expected to remain that high, the fund has other levers to pull should it need to.
- Organic liquidity is tough to predict for equity funds, and fund managers must consider if they should hold onto returned capital (such as loan repayments or distributions from fund holdings) and risk cash drag on returns, or reinvest the capital.
- Finally, funds can use debt, but it adds risk, especially if the debt had to be drawn due to a lack of organic liquidity that otherwise would have paid the debt.
- Unfunded commitments must also be considered, though it is unlikely all will be called in a given year. Still, it theoretically could be.
Example Liquidity Analysis: JPMorgan Private Markets
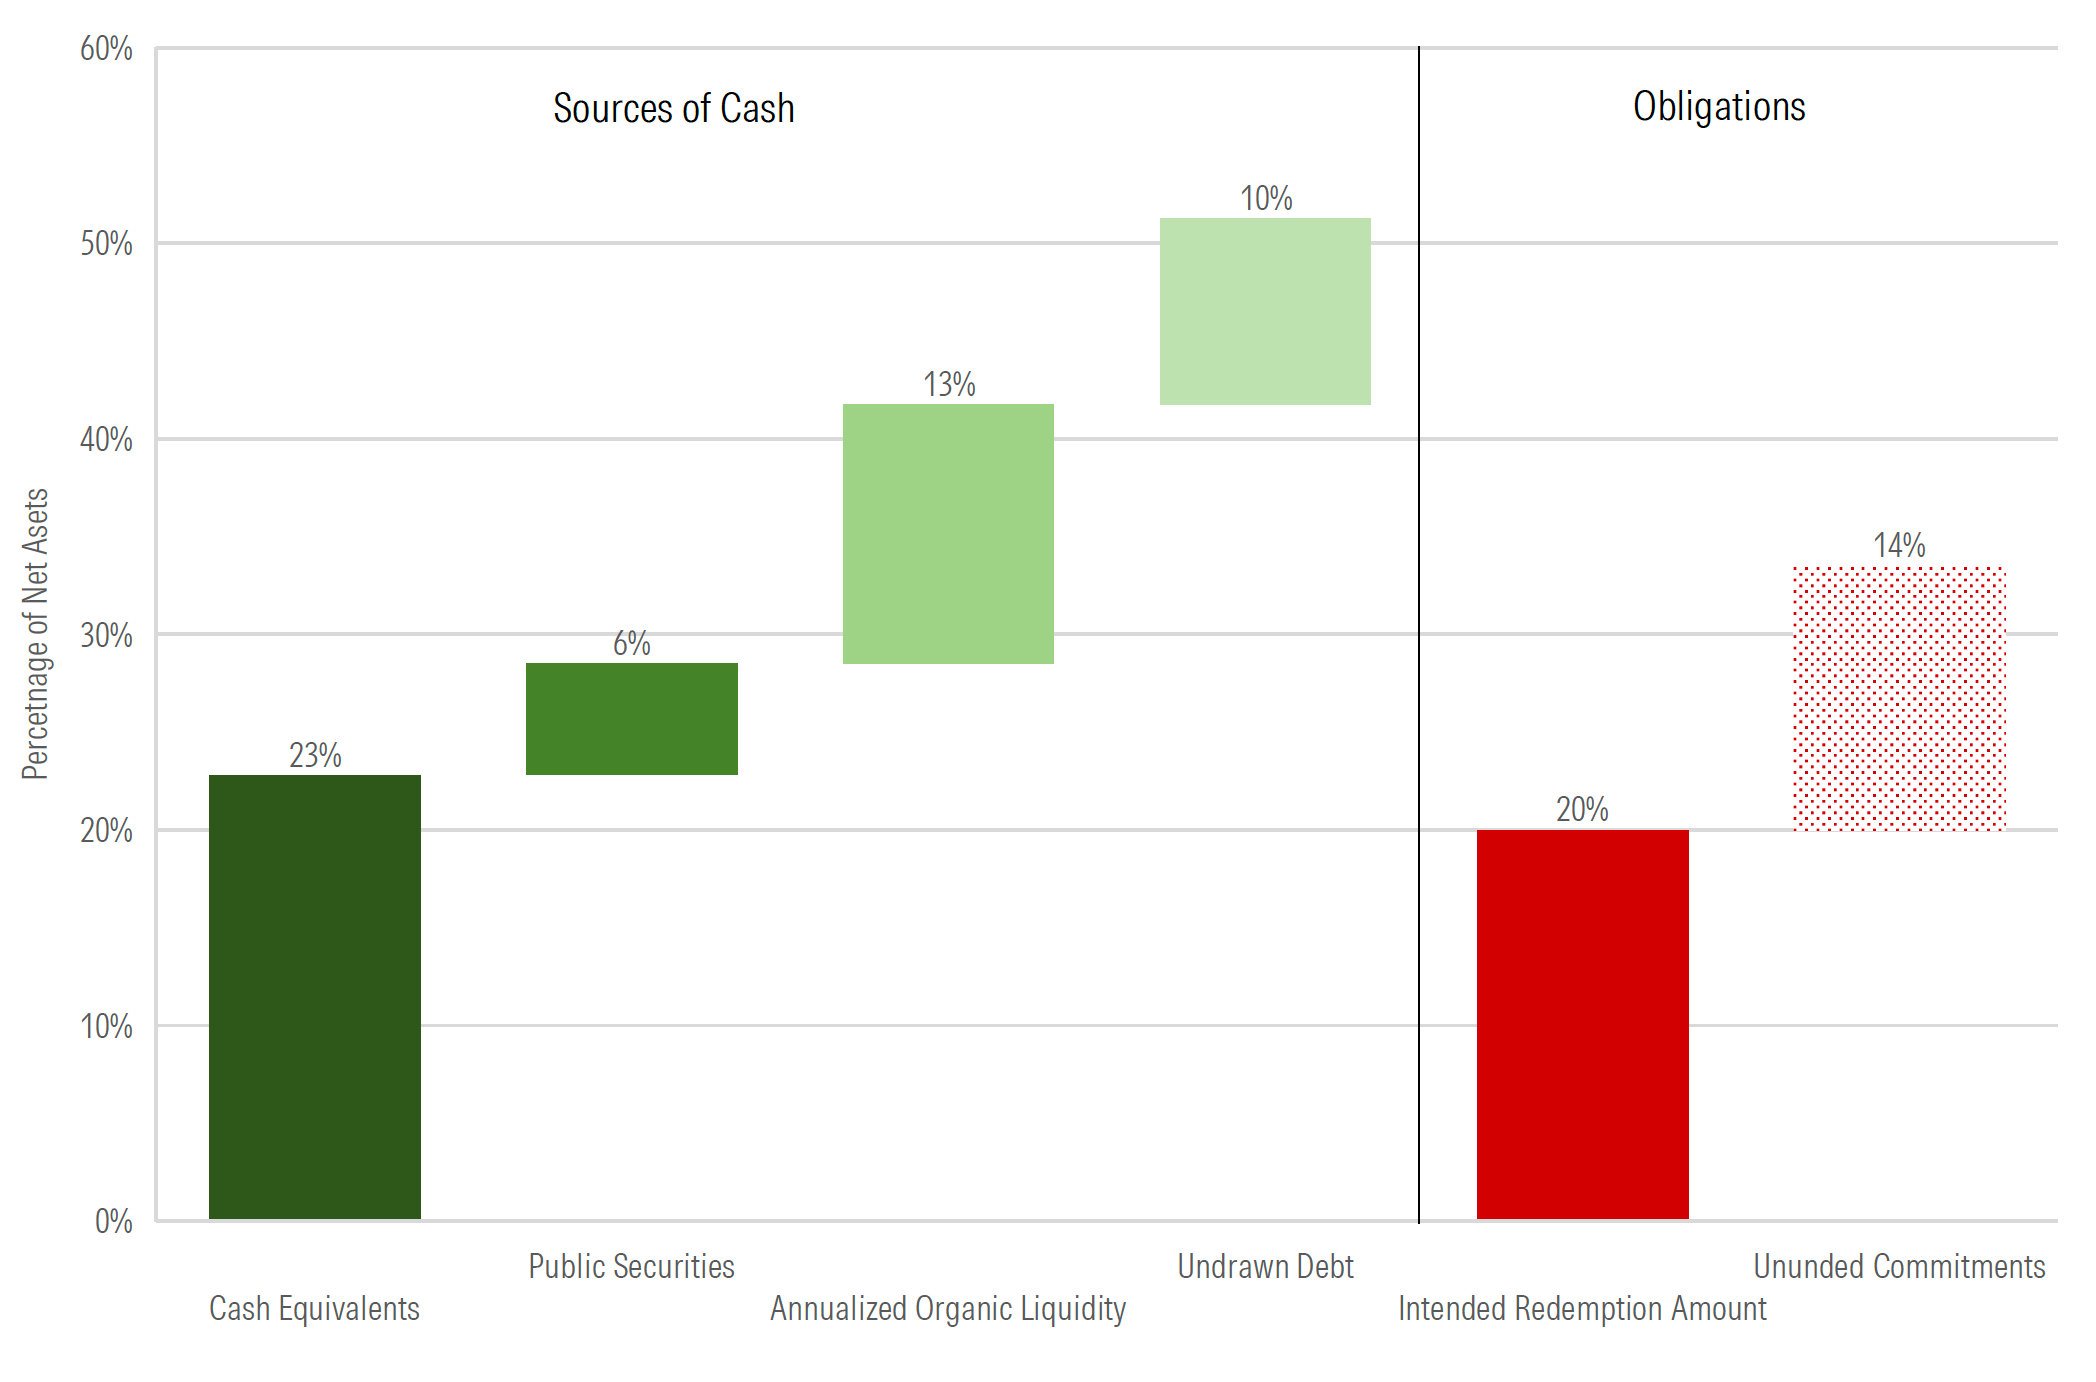
Source: Morningstar Direct, SEC filings.
Fair Value Hierarchy—A Measure of Liquidity Risk
- One of the best and most accessible measures of a fund's liquidity risk is the percentage of assets it has in each level of what regulators call the fair value hierarchy. This data, which is now available in Morningstar Direct, sorts holdings based on the inputs the fund uses to arrive at its fair values, or estimated market prices.
- There are three buckets or levels ordered from 1 to 3 according to their objectivity: Level 1 relies on quoted prices, such as listed securities and ETFs. Level 2 relies on observable inputs like dealer quotes or broker pricing and comprises most publicly traded credit. Level 3 relies on unobservable inputs, such as internal models and valuation assumptions, and includes most private assets, especially direct lending.
- The portfolios of semiliquid funds with more money in Level 1 and Level 2 are more liquid. But if illiquid securities do offer potentially higher returns, then Level 1 and Level 2 heavy funds may lag their less-liquid rivals, a trade-off investors must consider.
Source: Morningstar Direct and authors' calculations. Data as of Dec. 31, 2025. Unlisted BDC Average includes all unlisted BDCs, not just the sample in the table. Level 1 includes cash and money market funds.
Unlisted BDCs' Level 3 Exposure Has Been Growing
Many unlisted BDCs' Level 3 exposures have been rising slowly but steadily since March 2021. The unlisted BDC market is young, and the list of products is short, so outliers can push around averages. For example, new funds gradually getting fully invested could explain the growing Level 3 exposure, or recent redemptions may be forcing managers to sell more liquid assets. Either way, unlisted BDC portfolios are, on average, more illiquid than they were in the past.
Source: Morningstar Direct. Data as of Dec. 31, 2025. Unlisted BDC Average includes the full unlisted BDC universe, not only the six included here.
Measuring Illiquidity in the Largest Interval Fund Categories
Interval fund disclosure includes the standard Levels 1, 2, and 3 and an "Other" bucket in Morningstar Direct. Other includes investments in funds priced at NAV, whose holdings can be as illiquid, or more, as Level 3 assets. So, it makes sense to combine them. Consistent with expectations, doing so shows that direct lending and direct real estate funds are, on average, more illiquid than private debt—general funds.
Source: Morningstar Direct. Data as of Dec. 31, 2025. Counts and Averages exclude interval funds where this data is missing or incomplete.
Private Equity Trends
Public Equity Managers Own More Companies Now Than Ever
Much has been made about the apparent trend of companies “staying private for longer” or the declining number of publicly listed companies since the mid-1990s. However, public equity managers within Morningstar’s Style Box categories (which account for nearly 75% of all US mutual fund and ETF equity assets) own more unique stocks now than they did in the mid-1990s. Much of the decline in the oft-cited number of listed public companies comes from micro-caps that virtually no professional managers, and thus most end investors, owned in the first place. The number of unique US companies held by mutual funds and ETFs fell by just 7% in the 30-year period, while non-US ownership increased significantly.
Source: Morningstar Direct, author’s calculations. Data includes all funds, including obsolete ones, from the nine main Morningstar Style Box categories. Portfolio data represents the last known portfolio for each fund in each year.
The Older the Private Equity Fund, the Worse Relative Performance Gets
Against a broad public equity index like the S&P 500, semiliquid private equity funds have largely underperformed. They are not without company: Most public equity managers also fail to beat passive options. Still, the asset class is frequently sold as a better-than-public-markets option, and against the most popular public equity benchmark it has not impressed. High fees and significant cash drag, over the long run, can eat away at any gross excess return potential the underlying investments offer. Younger secondaries-focused funds have shown excess returns, though that is to be expected given the accounting quirk embedded in secondaries investing.
Source: Morningstar Direct. Includes all funds in the private equity category with performance data. Data is the oldest share class per fund.
Secondaries-Focused Strategies Are Gaining Traction, but Early Performance Is Skewed
Secondaries strategies account for much of the assets in semiliquid private equity funds. There are a few reasons they’re popular in semiliquid vehicles: First, the duration of the assets is shorter. That is critical for perpetual vehicles that need to generate regular liquidity for redemptions. Finally, these secondary interests are purchased at discounts to their NAV and marked up immediately back to the NAV. But this practice incentivizes firms to sell the firm early in its life, as greater, earlier inflows create better paper performance thanks to the accounting markup. Investors should not project early performance into the future, as they all should look good early on.
Fund Flows Can Dictate Secondaries Fund Performance, Especially Early On
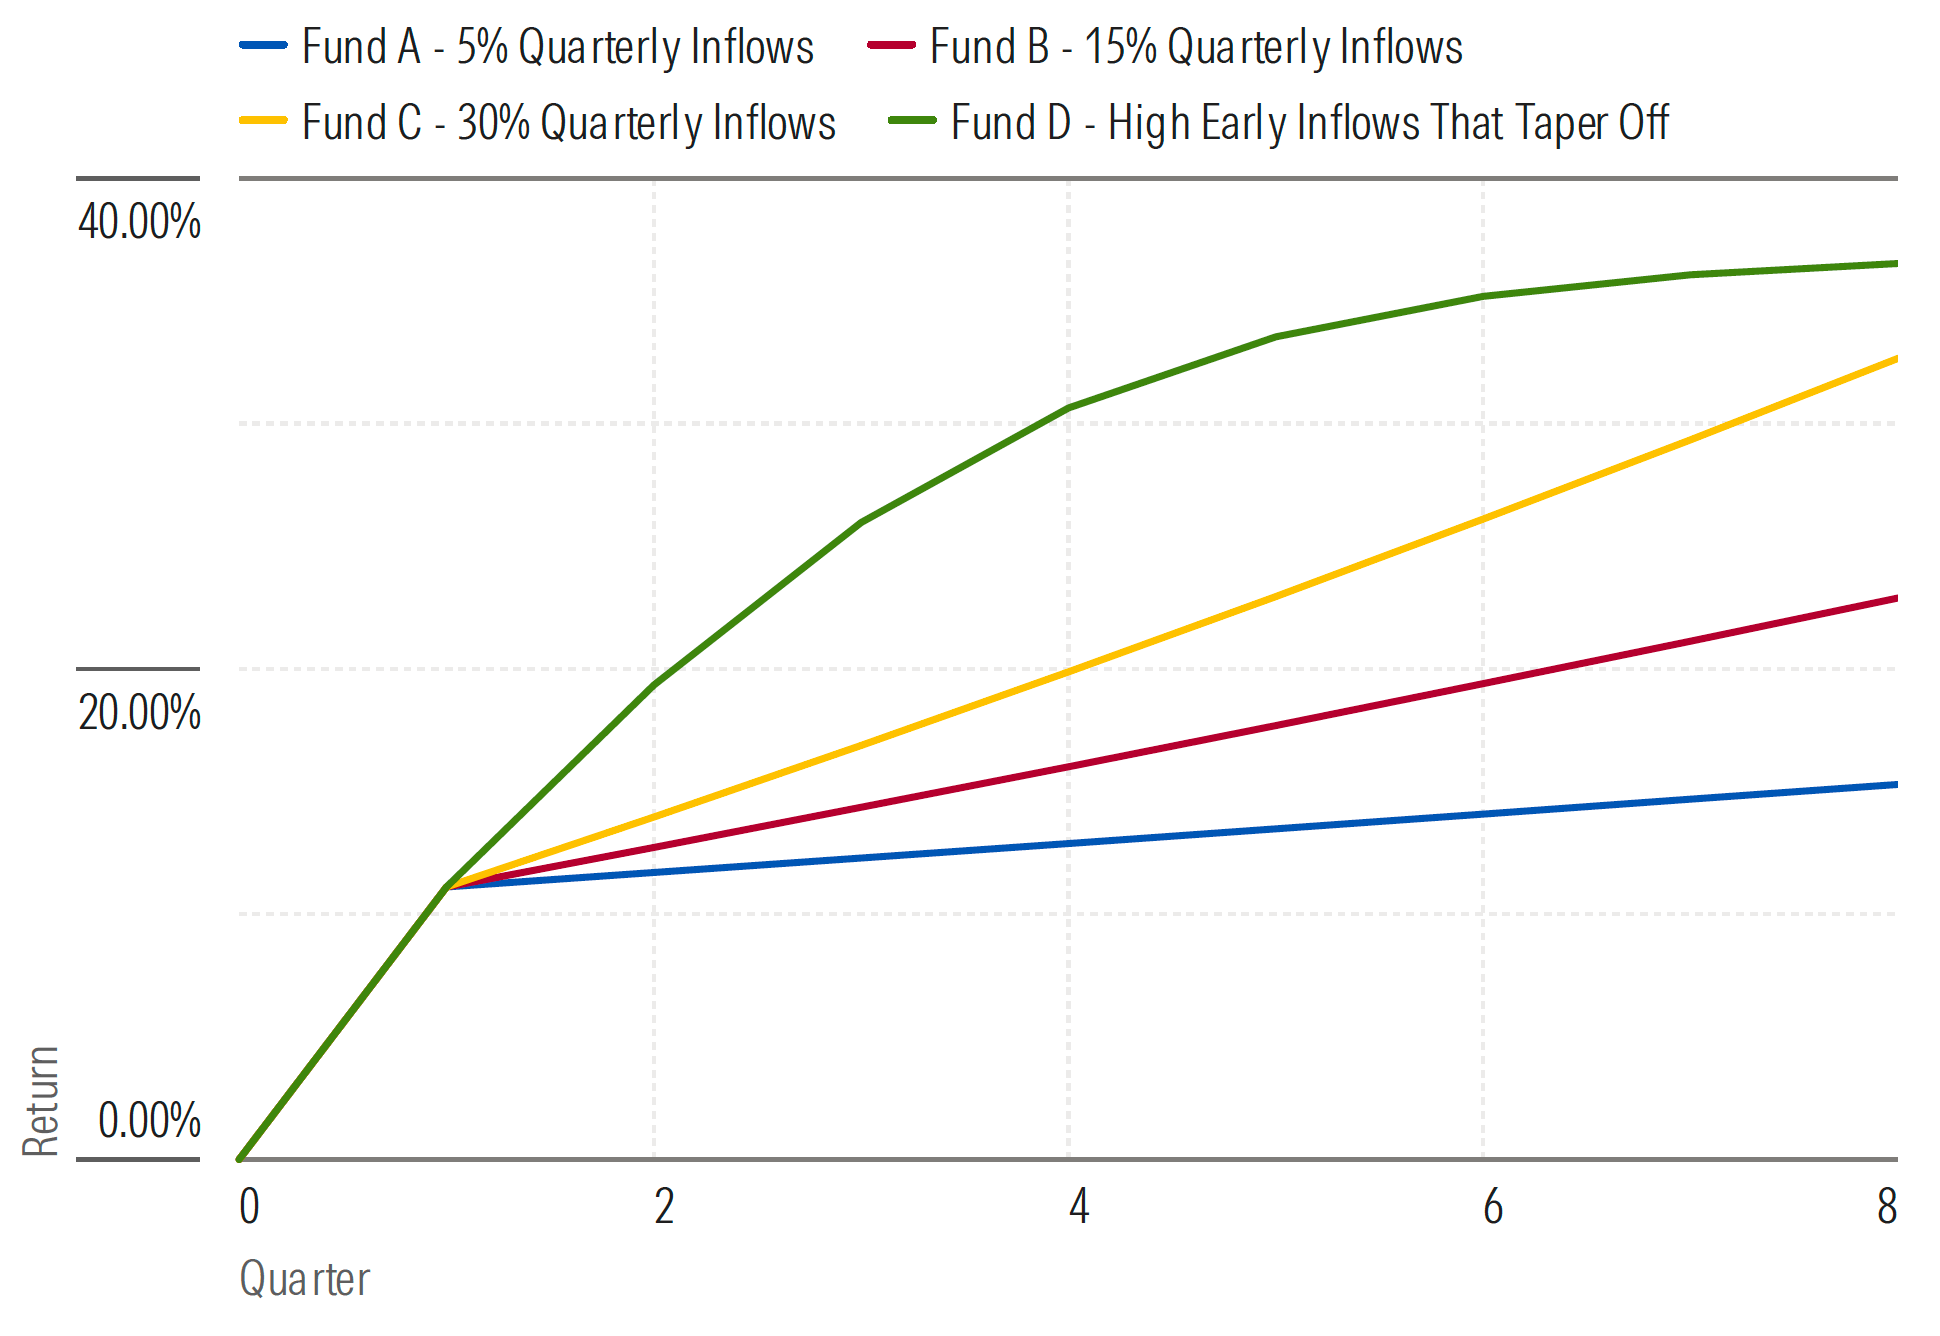
Source: SEC filings, fund websites. Data as of April 2026.
How Big Are the Discounts? It Depends on the Fund
Not all secondaries funds pursue the same strategy. Some focus on buying deeper discounted assets and generating more of their return via a convergence thesis. That is, if they pay $0.70 for an eventual cash flow of $1, they don’t need NAV increases to make a good return. Others pay milder discounts and hope to make most of their return off NAV appreciation rather than the discount itself. Both could be effective, but the deeper-discount strategies are almost sure to put up better early returns thanks to bigger writeups.
Source: SEC filings. Data includes only the positions marked as acquired as of the fund’s latest semiannual report, which is typically Sept. 30, 2025. Weighted average based on postmarkup values.
Is There an Alternative to the NAV Practice? Accounting Guidance Is Being Challenged
The practice of same-day markups on NAV discounts has justifiably drawn scrutiny. It seems especially hard to defend in cases where the same underlying private fund sees regular secondary trades. For example, eight different semiliquid funds purchased interests in CVC Capital Partners VII, a 2017 vintage buyout fund since mid-2022. While not every transaction price is known, and each individual LP interest can have unique terms, the known ones all transacted at similar discounts. Given the growing volume of trades in the secondary market, there is a burgeoning movement to push the Financial Accounting Standards Board to update its fair value guidance for NAV-based valuations.
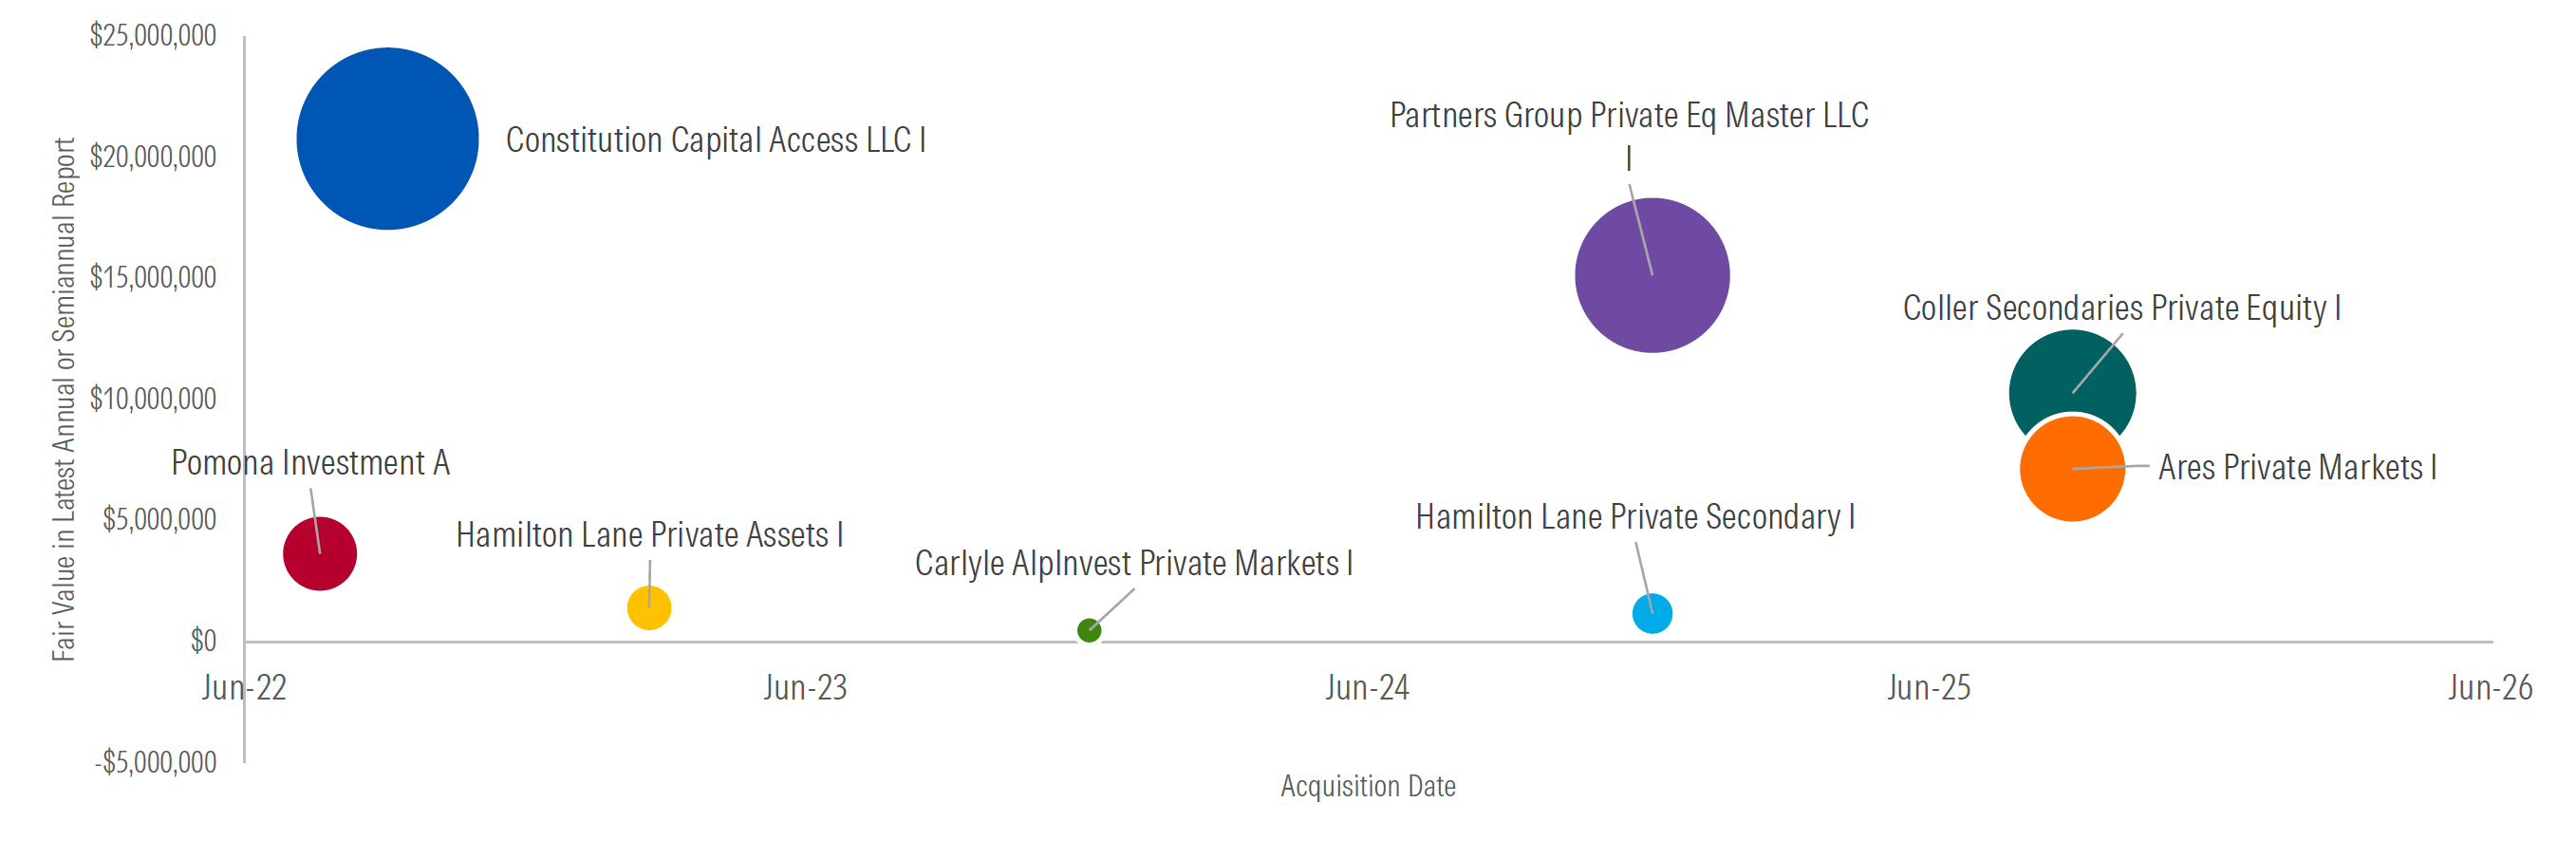
Source: Morningstar Direct, SEC filings. Bubble sizes scaled by the latest fair value amount per semiannual or annual report.
Funds Trade Below Their NAVs All the Time—Just Look at Listed BDCs
Proponents argue that secondary discounts reflect the liquidity preferences of the sellers and not the underlying value of the portfolios. But if virtually every transaction goes off at a discount, that suggests there is something structural at work beyond simple liquidity preferences. The reality is that when most portfolios trade, they transact below their NAV, especially those filled with private assets whose valuations are uncertain. Take listed CEFs or BDCs as an example. Fundholders in Blue Owl Capital Corp would have much preferred to value their position at NAV rather than its market price. These dynamics also point to why unlisted structures have become a vehicle of choice for private asset managers.
Source: Morningstar Direct, PitchBook. Assumes dividends reinvested.
Private Credit Trends
Private Credit Borrowing Spreads and Net Investment Income Are Falling—Lower Distributions May Follow
Private credit funds tend to have good asset-liability matching, in that their assets and debt obligations are both floating-rate. That means when rates fall, these funds will see lower borrowing costs, but they’ll also collect less income from the loans in their portfolio. The spread between the two has compressed, though, as more capital coming in has increased competition among private credit lenders, lowering their top-line yields. For semiliquid private credit funds, this spread is the main component of their income, which is often the whole return. This means that tightening lending spreads will squeeze their profits, and ultimately their distributions to investors.
Source: PitchBook, SEC filings. Data as of March 31, 2026.
Unlisted BDCs and Payment-in-Kind
Morningstar Direct users now have access to payment-in-kind data for unlisted BDCs. Payment-in-kind is when a borrower pays the interest on its debt in the form of more debt, growing the total loan balance instead of paying cash. Borrowers do this when they don't have the cash on hand to pay interest, or when matching the cash flow of a project with the interest payments on the loan.
PIK can be risky because it means the borrower may not have the cash to cover its interest payments and is digging a deeper debt hole instead.
The table shows those unlisted BDCs with the highest average PIK as a percent of total investment income. The average calculation begins in March 2021, or later for BDCs that launched after that date. Blue Owl BDCs occupy three of the top five spots.
The level of PIK income may be a function of age. The seven unlisted BDCs launched before 2023 have an average PIK of 4.88%, while the eight launched in 2024 and 2025 average just 1%.
One possible explanation is that managers of newer BDCs are more sensitive to investor concerns about PIK and have limited the PIK loans in their portfolios. Another explanation is simply that older BDCs have had more opportunities for their loans to run into trouble and switch from cash payments to PIK.
Source: Morningstar Direct. Data as of Dec. 31, 2025. Average calculation starts in March 2021 or from the first available date for BDCs with later inception dates.
A (Short) History of Payment-in-Kind
Payment-in-Kind as a Percent of Total Investment Income for the 10 Largest Unlisted BDCs (From March 2021 through December 2025)
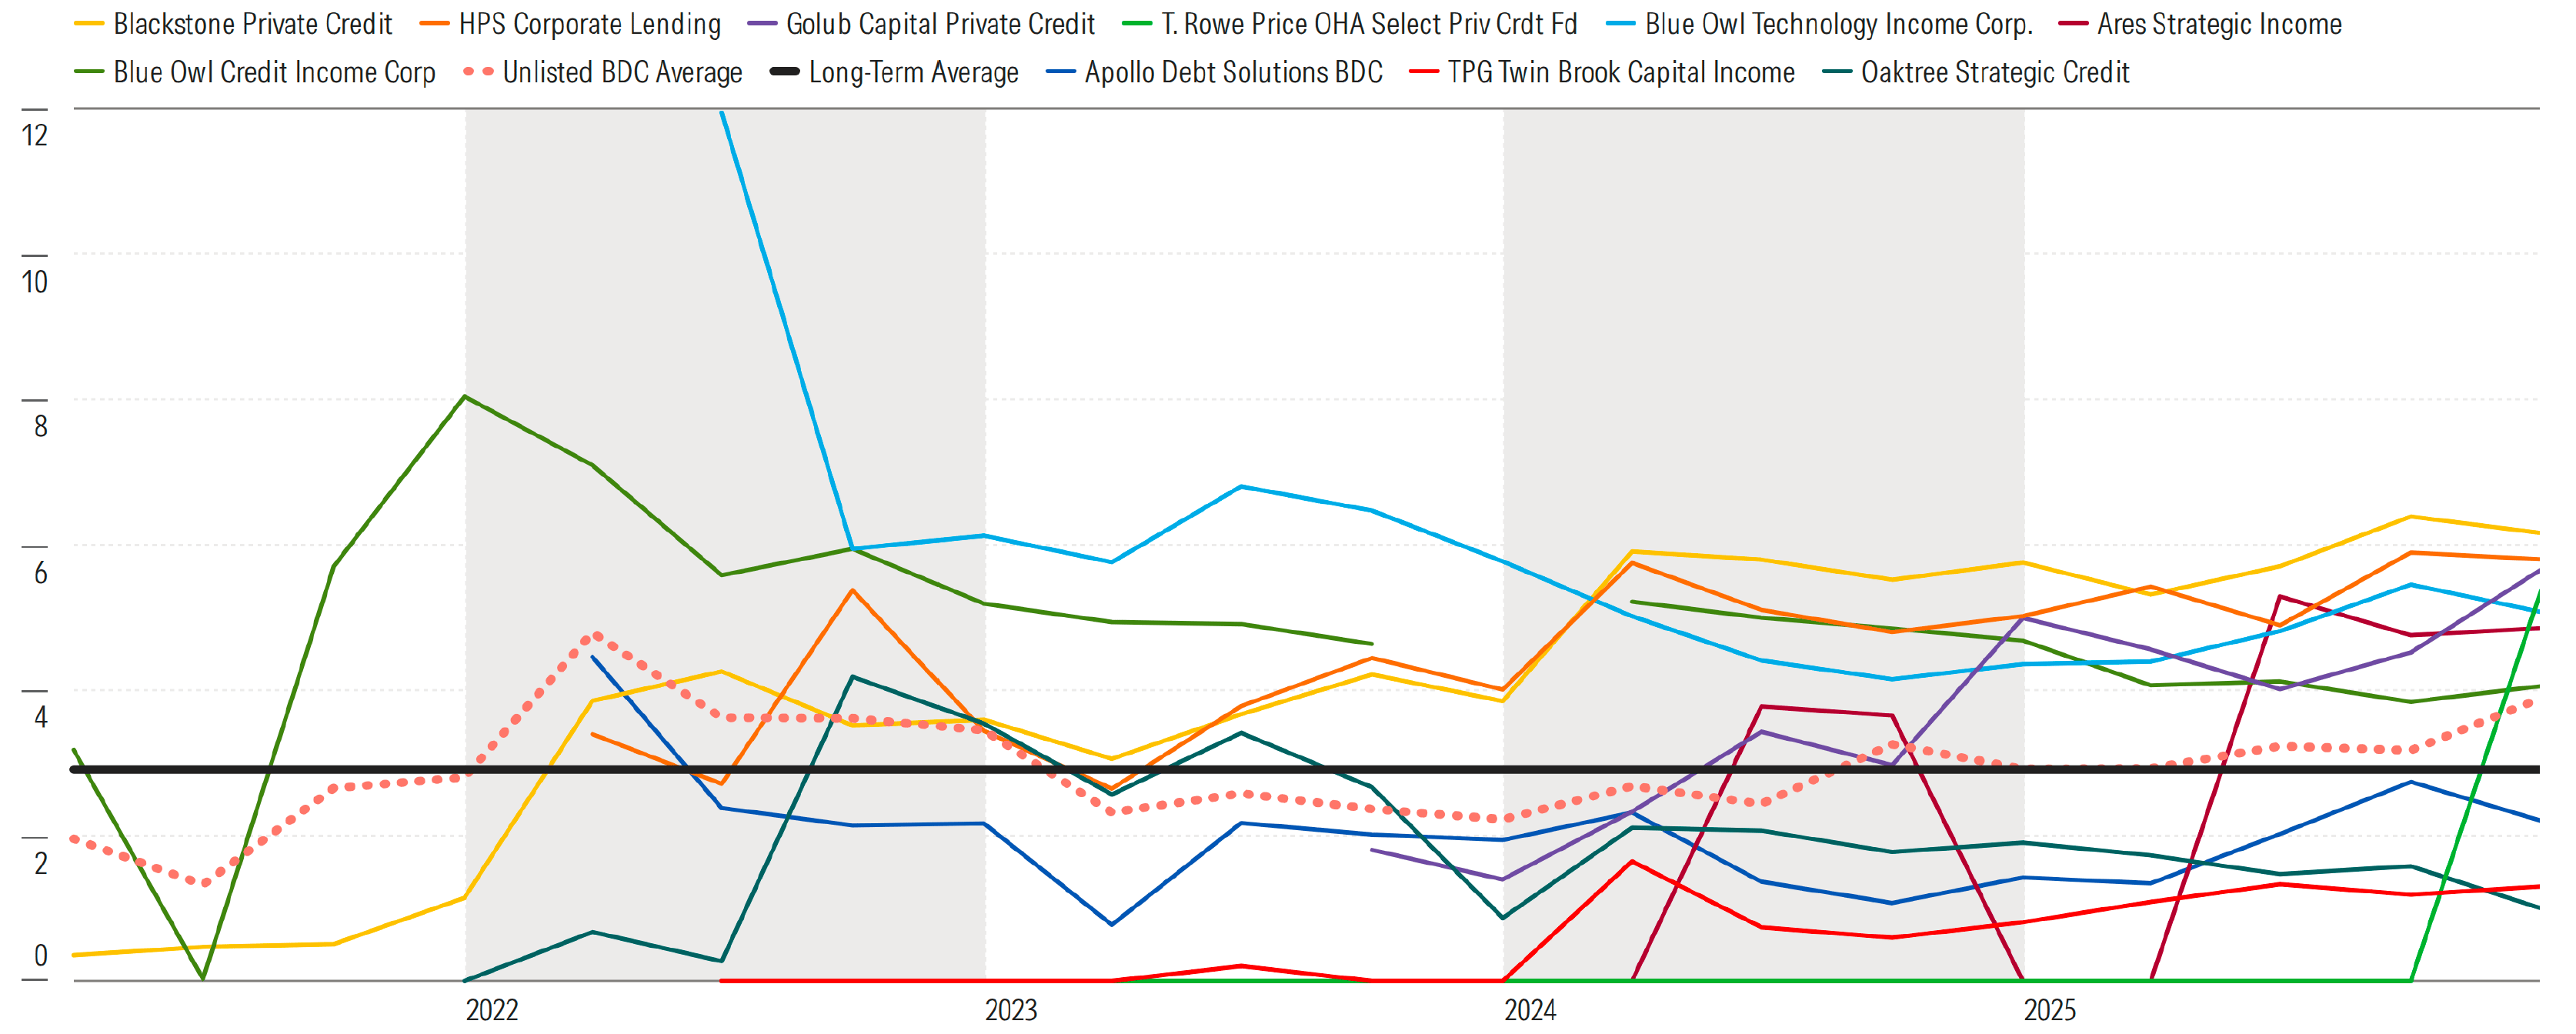
Source: Morningstar Direct. Data as of Dec. 31, 2025. Unlisted BDC Average and Long-Term Average series are calculated using the full unlisted BDC universe, excluding 10-12G BDCs.
A Different Look at PIK in Interval and Tender-Offer Funds
Morningstar Direct also has PIK data for interval and tender-offer funds, but it's different from unlisted BDC PIK data. We use data from N-PORT filings to calculate the percentage of interval and tender-offer holdings that might resort or have resorted to PIK to cover interest payments, or "PIK-able" assets. This includes borrowers that pay interest in cash but can switch to PIK, that once used PIK but now pay cash, or that currently use PIK. The data is a useful way to gauge risk.
Source: Morningstar Direct. Data as of Dec. 31, 2025.
Asset-Backed or Asset-Based?
- Asset-backed finance, or asset-based lending, has been a growing semiliquid fund segment.
- These terms have become vague catch-alls. In practice, they mean any lending where the returns come from identifiable assets. Compared with corporate credit, such as direct lending, where the returns come from the corporate entity.
- They can involve lending against a company's assets, such as receivables or inventory, or lending facilities on which the borrower periodically draws, or bankruptcy-remote securitizations of data centers, royalty streams, or equipment leases.
- This includes both privately arranged deals and public asset-backed securitizations that occasionally appear in mutual funds and ETFs.
- The terms are so broad that they are perhaps more easily defined by what they are not, which is direct corporate credit risk.
Source: Morningstar Direct. Data as of June 1, 2026. Asset-backed finance and asset-based lending are not distinct categories. Of the 10 funds listed, eight are classified in the private debt—general category, one in the nontraditional bond category, and one in the securitized bond—diversified category. They were identified by checking names and portfolio holdings.
The 401(k) Goes Private
Private Markets Get a Green Light For 401(k)s
For alternative asset managers, the more than $12 trillion sitting in 401(k) plans has long been out of reach, but new regulatory developments and the increased adoption of CITs may finally change that.
In March 2026, the US DOL unveiled its anticipated rule proposal to address the inclusion of private investments, lifetime income, and cryptocurrencies in 401(k) plans. The most likely access point will be either through a target-date strategy or a managed account.
The Framework
The proposed rule offers legal protections to plan fiduciaries who follow clear processes around six required factors when selecting plan investments:
- Performance
- Fees
- Liquidity
- Valuation
- Performance Benchmark
- Complexity
The proposal presumes fiduciaries who document how they consider each factor have acted prudently. If finalized, the rule could reduce the risk of being sued for offering higher-cost or complex alternatives.
Private Markets Are Coming to 401(k)s Through Collective Investment Trusts
Why Collective Investment Trusts Are Winning
CITs have surpassed mutual funds as the dominant 401(k) vehicle, driven by lower costs and flexibility. They are regulated under Erisa and the DOL, not the 1940 Act, giving plan sponsors more fee negotiating power.
Why CITs Are the Natural Entry Point for Private Markets
The SEC has 15% soft cap on illiquid investments in mutual funds. CITs face no equivalent limit, making them the more practical wrapper for private market exposure.
How CITs Invest in Private Markets
- Semiliquid funds: CITs invest directly in semiliquid funds that offer access to private markets.
- Direct private placements: CITs can invest directly in private equity, private credit, and real assets unconstrained by the rules that limit mutual funds.
Target-Date Assets in CITs Overtook Mutual Funds in 2024
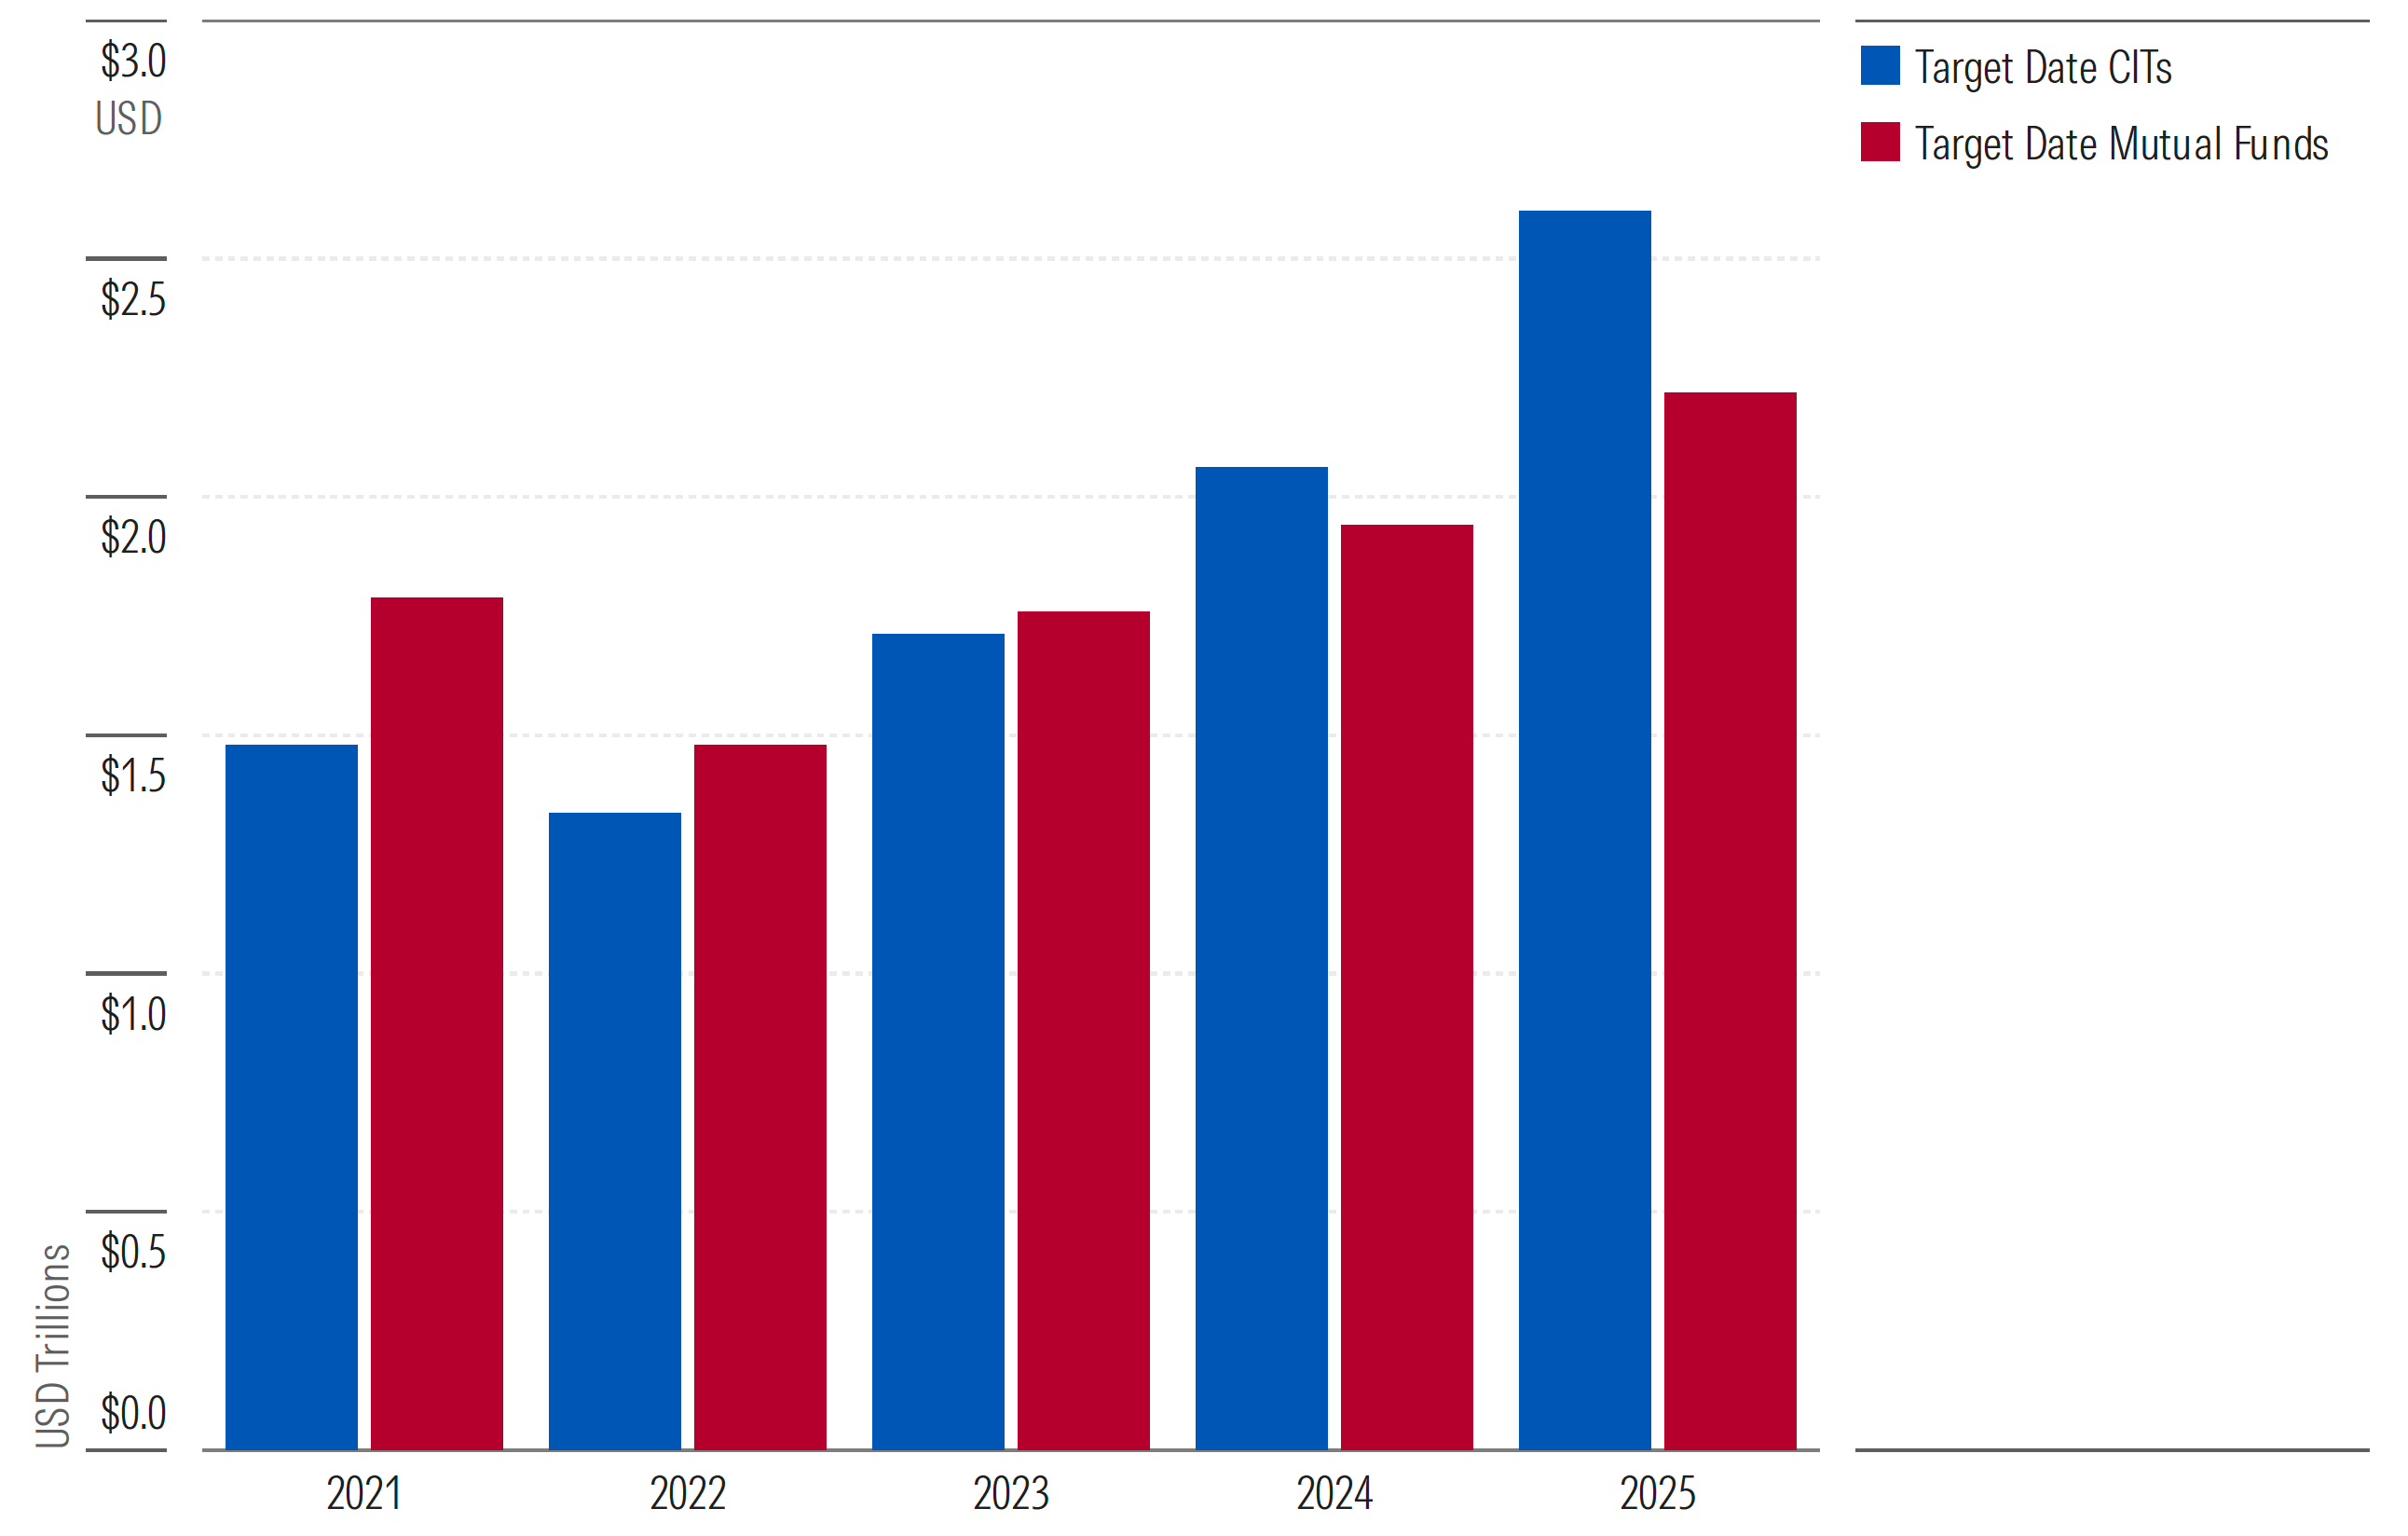
Source: Morningstar Direct, asset manager survey.
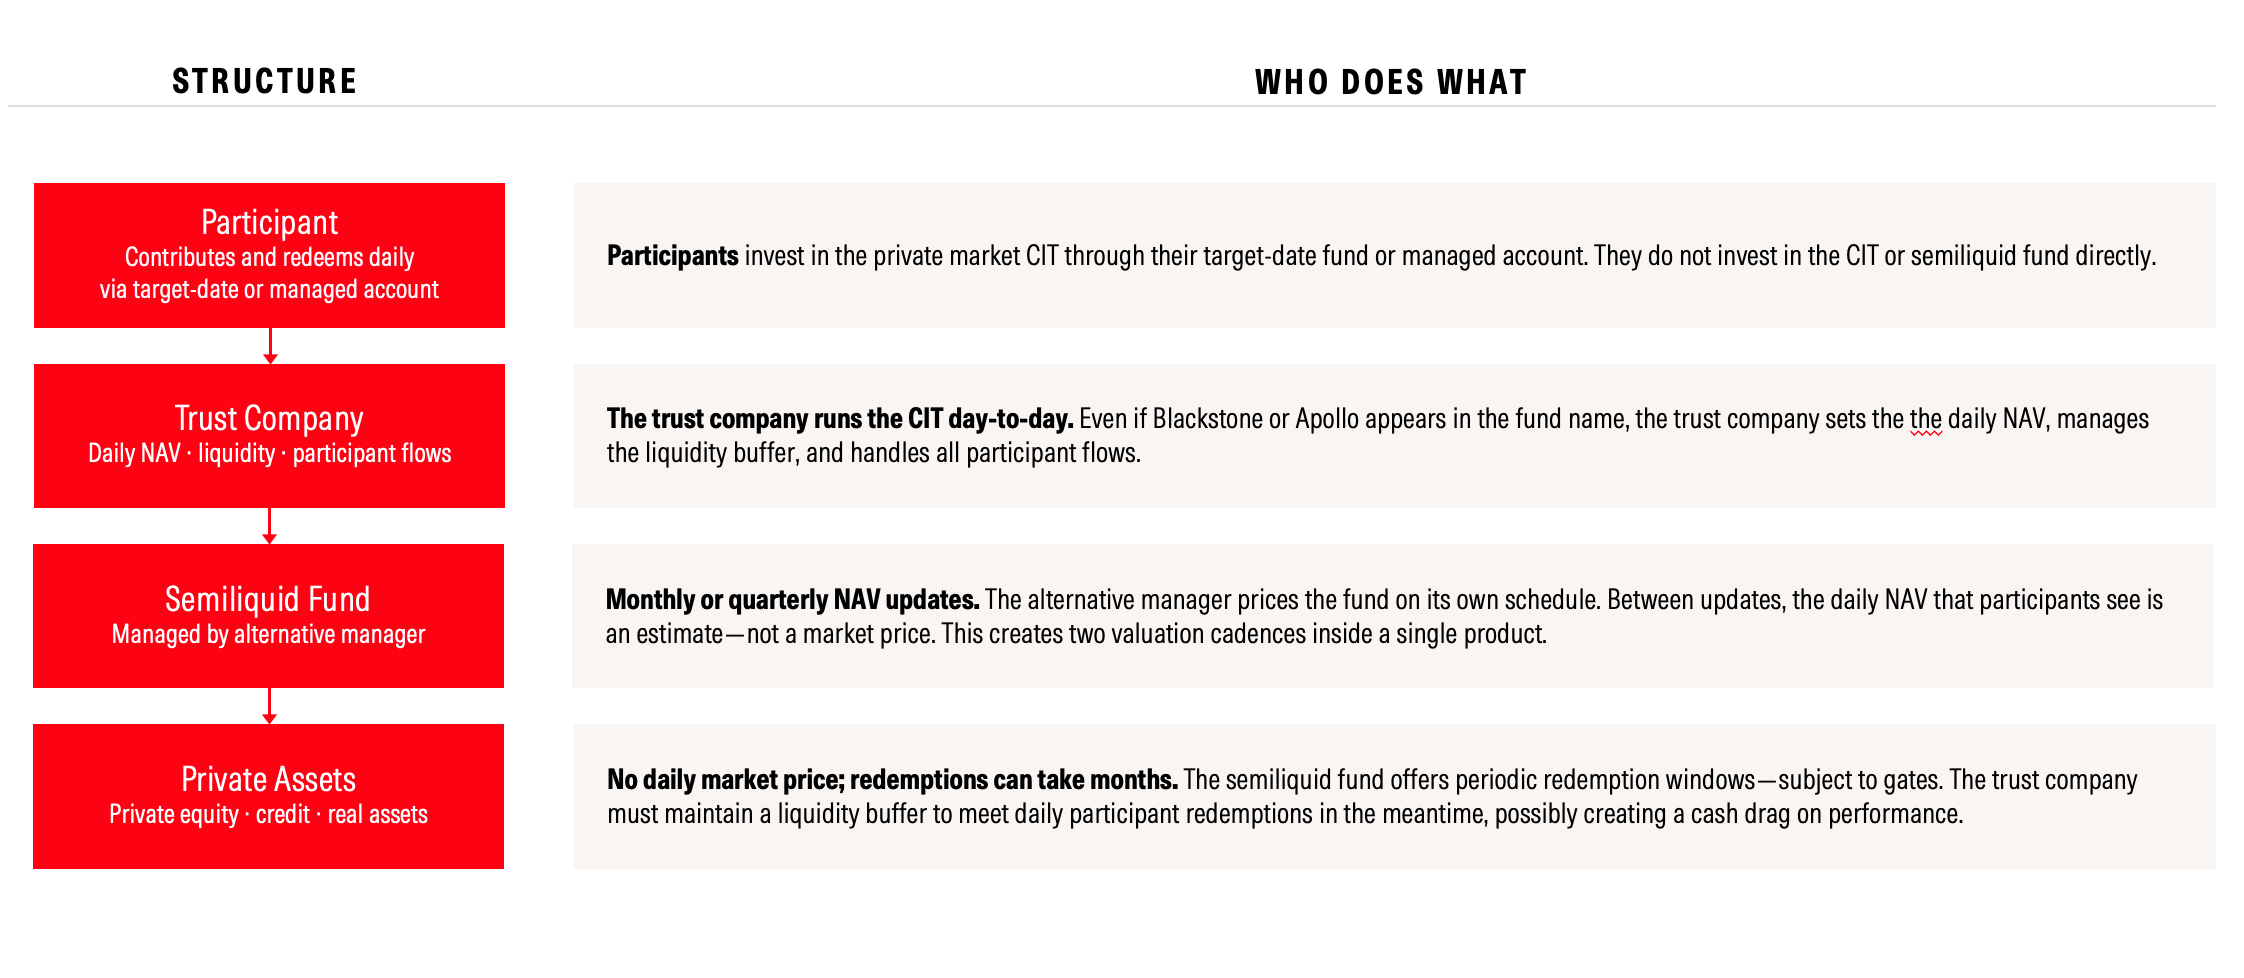
How a CIT Holds Private Markets: Structure and Responsibilities
Fee Considerations for CITs That Invest in Private Markets
Open Questions: Fee Transparency
CITs must include all direct and indirect fees in the total net expense ratio. Private market fee structures make that harder—and fee litigation against 401(k) plans is already rising.
Two unresolved fee disclosure gaps:
1. Incentive FeesIt is unclear whether CITs must include incentive fees such as carried interest in the total net expense ratio. Incentive fees can rival the management fee itself, and without disclosure of hurdle rates and high-water marks, participants lack full visibility into costs.
2. Acquired Fund Fees
How costs flow through as acquired fund fees remains unsettled, making fee comparisons difficult for plan sponsors. CITs investing in fund-of-funds structures may disclose additional fees only in footnotes.
Two Possible Solutions
1. Flat Fee Share Classes
One way around the incentive fee problem is to not charge them. Blackstone offers a CIT via Global Trust Company that invests in Blackstone Private Equity in two share classes:
Incentive fee share class: 1.25% management fee, 12.5% incentive fee
Flat fee share class: 2.10% management fee, 0% incentive fee
The flat fee is cheaper if the CIT returns more than 7% gross of fees. Large 401(k) plans should have pricing power when selecting private market funds.
2. Build CITs that Invest Directly in Private Markets
Building CITs that invest directly in private markets takes more time but gives managers more control over fee structure. We expect this approach to gain traction as the market matures.
Private Market CITs Add Additional Liquidity to Meet Daily Redemptions
Managing liquidity is critically important for any private market investment, and CITs face a particular challenge: They must offer daily liquidity to plan participants even when the underlying semiliquid funds redeem only monthly or quarterly. To bridge that gap, CITs are currently holding 5%–20% in cash and/or public market ETFs on top of whatever liquidity management is already embedded within the semiliquid fund itself.
That buffer can take the form of cash alone, or a blend of cash and public market mutual funds or ETFs. But an all-cash buffer introduces its own complication. In a downturn like 2022, when public equities and bonds sold off sharply, cash stays flat while listed assets fall, which means the semiliquid fund's share of the portfolio can quietly balloon as managed account or target-date providers are trying to reduce it back to a strategic target weighting. Private market valuations, which update infrequently, are unlikely to offset this dynamic. The result is that heavy cash buffers can make rebalancing harder, not easier, precisely when market stress makes rebalancing most necessary.
Liquidity considerations don't stop at the participant level. Given monthly or quarterly redemption windows, 401(k) fiduciaries also need to think about how long a full exit would take if the plan decided to remove the semiliquid fund from its lineup entirely. Under normal conditions, sponsors should budget at least a year to unwind the position. If the fund is oversubscribed and processing partial redemptions only, the timeline could stretch considerably longer.
Here Come the Target-Date Funds With Private Markets
Nearly $2 out of every $3 of 401(k) contributions go to target-date strategies, so it's obvious why asset managers intent on selling private assets to retail investors in US retirement plans want to get their offerings in the vehicles.
Target-date assets are largely dominated by low-cost investment options with more than 50% of assets in share classes that cost 0.08% or less. As the door opens for target dates to start to include private markets, many asset managers see it as an option to differentiate from the low-cost competition.
Many public market asset managers have teamed with alternative asset managers to launch the target-date funds:
- State Street/Apollo
- T. Rowe Price/Goldman
- Capital Group/KKR
- Voya/Blue Owl
BlackRock, which acquired private credit manager HPS and direct infrastructure manager GIP, will be using its in-house private market teams.
Most series have yet to be publicly launched, but we expect the total fees for target-date funds with private markets to come in around 0.40%, based on our conversations with asset managers. That would put these series costs in line with target-date funds that use all actively managed funds.
Appendix
Semiliquid Versus Evergreen—Is There a Difference?
- Morningstar uses "semiliquid" to describe interval funds, tender-offer funds, unlisted BDCs, unlisted REITs, and similar European products. Other industry participants use "evergreen" to describe these same investment vehicles.
- Semiliquid describes the investor liquidity experience, while evergreen describes product structure. Evergreen implies the combination of two product features: continuously offered and perpetual life.
- Continuously offered means investors can add new money on an ongoing basis: intraday for ETFs, daily for mutual funds and interval funds, monthly for unlisted BDCs, and so on. Perpetual life means the fund exists in perpetuity unless or until its assets fall to zero or the manager chooses to wind it down.
- There are clear differences between an evergreen fund and a drawdown fund, which accepts only a previously committed amount of capital and has a defined life. The use of "evergreen" is common among institutional investors who typically invest in drawdown funds
- But "evergreen" doesn't work for investors coming from mutual funds and ETFs, which are all evergreen. For those investors, liquidity is what separates interval funds from mutual funds—that's why we call them semiliquid.
Morningstar Medalist Ratings for Semiliquid Funds
Source: Morningstar Direct. Data as of May 30, 2026. The Medalist Rating is for each fund’s cheapest share class.
Not All Semiliquid Funds Are Created Equal
Defining Investor Eligibility
General Disclosure
Unless otherwise provided in a separate agreement, recipients accessing this report may only use it in the country in which the Morningstar distributor is based. Unless stated otherwise, the original distributor of the report is Morningstar Research Services LLC, a U.S.A. domiciled financial institution.
This report is for informational purposes only and has no regard to the specific investment objectives, financial situation, or particular needs of any specific recipient. This publication is intended to provide information to assist investors in making their own investment decisions, not to provide investment advice to any specific investor. Therefore, investments discussed and recommendations made herein may not be suitable for all investors; recipients must exercise their own independent judgment as to the suitability of such investments and recommendations in the light of their own investment objectives, experience, taxation status, and financial position.
The information, data, analyses, and opinions presented herein are not warranted to be accurate, correct, complete, or timely. Unless otherwise provided in a separate agreement, neither Morningstar, Inc. nor the Manager Research Group represents that the report contents meet all of the presentation and/or disclosure standards applicable in the jurisdiction the recipient is located.
Except as otherwise required by law or provided for in a separate agreement, the analyst, Morningstar, Inc. and the Manager Research Group and their officers, directors and employees shall not be responsible or liable for any trading decisions, damages or other losses resulting from, or related to, the information, data, analyses or opinions within the report. The Manager Research Group encourages recipients of this report to read all relevant issue documents for example, prospectus) pertaining to the security concerned, including without limitation, information relevant to its investment objectives, risks, and costs before making an investment decision and when deemed necessary, to seek the advice of a legal, tax, and/or accounting professional.
The Report and its contents are not directed to, or intended for distribution to or use by, any person or entity who is a citizen or resident of or located in any locality, state, country, or other jurisdiction where such distribution, publication, availability or use would be contrary to law or regulation or which would subject Morningstar, Inc. or its affiliates to any registration or licensing requirements in such jurisdiction.
Where this report is made available in a language other than English and in the case of inconsistencies between the English and translated versions of the report, the English version will control and supersede any ambiguities associated with any part or section of a report that has been issued in a foreign language. Neither the analyst, Morningstar, Inc. nor the Equity Research Group guarantees the accuracy of the translations.
This report may be distributed in certain localities, countries and/or jurisdictions (“Territories”) by independent third parties or independent intermediaries and/or distributors (“Distributors”). Such Distributors are not acting as agents or representatives of the analyst, Morningstar, Inc. or the Manager Research Group. In Territories where a Distributor distributes our report, the Distributor is solely responsible for complying with all applicable regulations, laws, rules, circulars, codes, and guidelines established by local and/or regional regulatory bodies, including laws in connection with the distribution of third-party research reports.
Risk Warning
Please note that investments in securities are subject to market and other risks and there is no assurance or guarantee that the intended investment objectives will be achieved. Past performance of a security may or may not be sustained in future and is no indication of future performance. A security investment return and an investor's principal value will fluctuate so that, when redeemed, an investor's shares may be worth more or less than their original cost.
A security's current investment performance may be lower or higher than the investment performance noted within the report. Morningstar's Uncertainty Rating serves as a useful data point with respect to sensitivity analysis of the assumptions used in our determining a fair value price.
Conflicts of Interest
- Analysts may own (actual or beneficial) interests in the managed investments that are the subject of the Report. No material interests are held by the analyst or their immediate family with respect to the security subject of this report.
- In general, Morningstar will not hold a material interest in the security subject of this report. If a material interest is held by Morningstar, or if Morningstar owns a net long or short position in the security that is the subject of this report that exceeds 0.5% of the total issued share capital of the security, it will be disclosed at:
https://www.morningstar.com/company/disclosures/holdings - Morningstar employees' compensation is derived from Morningstar's overall earnings and consists of salary, bonus and in some cases restricted stock.
- Neither Morningstar nor its analysts receive compensation or material benefits from product issuers or third parties in connection with this report.
- Morningstar's overall earnings are generated in part by the activities of the Investment Management and Research groups, and other affiliates, who provide services to product issuers. Morningstar does not receive commissions for providing research and does not charge issuers to be rated.
- Morningstar employees may not pursue business and employment opportunities outside Morningstar within the investment industry (including but not limited to, working as a financial planner, an investment advisor or investment professional representative, a broker-dealer or broker-dealer agent, a financial writer, reporter, or analyst) without the approval of Morningstar's Legal and if applicable, Compliance teams. Morningstar may provide the investment product issuer or its related entities with services or products for a fee and on an arm’s length basis including software products and licenses, research and consulting services, data services, licenses to republish our ratings and research in their promotional material, event sponsorship and website advertising.
- Certain managed investments use an index created by and licensed from Morningstar, Inc. as their tracking index. We mitigate any actual or potential conflicts of interest resulting from that by not producing qualitative analysis on any such managed investment as well as imposing information barriers (both technology and non-technology) where appropriate and monitoring by the compliance department.
- Morningstar's Investment Management group has arrangements with financial institutions to provide portfolio management/investment advice, some of which an analyst may issue investment research reports on. In addition, the Investment Management group creates and maintains model portfolios whose underlying holdings can include financial products, including securities that may be the subject of this report. However, analysts do not have authority over Morningstar's Investment Management group's business arrangements nor allow employees from the Investment Management group to participate or influence the analysis or opinion prepared by them.
- Morningstar, Inc. is a publicly traded company (Ticker Symbol: MORN) and thus a security which is the subject of this report may own more than 5% of Morningstar, Inc.'s total outstanding shares. Please access Morningstar, Inc.'s most recent Proxy Statement and refer to the section titled "Security Ownership of Certain Beneficial Owners and Management" at: https://shareholders.morningstar.com/investorrelations/financial/sec-filings/default.aspx. A security's holding of Morningstar stock has no bearing on and is not a requirement for which securities Morningstar determines to cover.
Morningstar, Inc. may provide the product issuer or its related entities with services or products for a fee and on an arm's length basis including software products and licenses, research and consulting services, data services, licenses to republish our ratings and research in their promotional material, event sponsorship and website advertising.
Further information on Morningstar, Inc.'s conflict of interest policies is available from:
https://shareholders.morningstar.com/investor-relations/governance/Compliance-Disclosure/default.aspx
Also, please note analysts are subject to the CFA Institute's Code of Ethics and Standards of Professional Conduct.
For a list of securities which the Manager Research Group currently covers and provides written analysis on please contact your local Morningstar office. In addition, for historical analysis of securities covered, including their fair value estimate, please contact your local office.
For Recipients in Australia
This Report has been issued and distributed in Australia by Morningstar Australasia Pty Ltd. (ABN: 95 006 654 445; AFSL: 240892). Morningstar Australasia Pty Ltd. is the provider of the general advice ("the Service") and takes responsibility for the production of this report. The Service is provided through the research of investment products. To the extent this Report contains general advice it has been prepared without reference to an investor's objectives, financial situation or needs. Investors should consider the advice in light of these matters and, if applicable, the relevant Product Disclosure Statement before making any decision to invest. Refer to our Financial Services Guide, or FSG, for more information at http://www.morningstar.com.au/fsg.pdf.
For Recipients in New Zealand
This report has been issued and distributed by Morningstar Australasia Pty Ltd and/or Morningstar Research Ltd (together "Morningstar"). This report has been prepared and is intended for distribution in New Zealand to wholesale clients only and has not been prepared for use by New Zealand retail clients (as those terms are defined in the Financial Markets Conduct Act 2013).
The information, views and any recommendations in this material are provided for general information purposes only, and solely relate to the companies and investment opportunities specified within. Our reports do not take into account any particular investor's financial situation, objectives or appetite for risk, meaning no representation may be implied as to the suitability of any financial product mentioned for any particular investor. We recommend seeking financial advice before making any investment decision.
For Recipients in Hong Kong
The Report is distributed by Morningstar Investment Management Asia Limited, which is regulated by the Hong Kong Securities and Futures Commission to provide investment research and investment advisory services to professional investors only. Neither Morningstar Investment Management Asia Limited, nor its representatives, are acting or will be deemed to be acting as an investment advisor to any recipients of this information unless expressly agreed to by Morningstar Investment Management Asia Limited.
For Recipients in Japan
The Report is distributed by Ibbotson Associates Japan, Inc., which is regulated by Financial Services Agency, for informational purposes only. Neither Ibbotson Associates Japan, Inc. nor its representatives, are acting or will be deemed to be acting as an investment advisor to any recipients of this information.
For Recipients in Korea
The Report is distributed by Morningstar Korea Limited, which is regulated by Financial Supervisory Service, for informational purposes only. Neither Morningstar Korea Limited, nor its representatives, are acting or will be deemed to be acting as an investment advisor to any recipients of this information.
For recipients in Singapore:
The Report is intended for Institutional Investor audiences and is distributed by Morningstar Investment Adviser Singapore Pte. Limited, which is licensed by the Monetary Authority of Singapore to provide financial advisory services in Singapore. Morningstar Investment Adviser Singapore Pte. Limited is the entity responsible for the creation and distribution of the research services described in this Report. This content is provided for informational purposes only and may be shared or redistributed by Institutional Investors to their clients or other permitted persons, subject to obtaining the appropriate licence from Morningstar. Redistribution of this content is subject to any applicable conditions or limitations, including those agreed commercially or contractually with Morningstar. The person who shares or redistributes this content shall be solely responsible for compliance with all relevant legal and regulatory obligations in the jurisdictions in which the material is made available. Investors should consult a financial adviser regarding the suitability of any investment product, taking into account their specific investment objectives, financial situation or particular needs, before making any investment decision. Morningstar, Inc., and its affiliates rely on certain exemptions (Financial Advisers Regulations, Section 27(1)(e), Section 32B and 32C) to provide its investment research to recipients in Singapore.
For Recipients in India:
This Investment Research is issued by Morningstar Investment Research India Private Limited (formerly known as Morningstar Investment Adviser India Private Limited). Morningstar Investment Research India Private Limited is registered with SEBI as an Investment Adviser (Registration number INA000001357), as a Portfolio Manager (Registration number INP000006156) and as a Research Entity (Registration Number INH000008686). Morningstar Investment Research India Private Limited has not been the subject of any disciplinary action by SEBI or any other legal/regulatory body. Morningstar Investment Research India Private Limited is a wholly owned subsidiary of Morningstar Investment Management LLC. In India, Morningstar Investment Research India Private Limited has one associate, Morningstar India Private Limited, which provides data related services, financial data analysis and software development. The Research Analyst has not served as an officer, director or employee of the fund company within the last 12 months, nor has it or its associates engaged in market making activity for the fund company.
*The Conflicts of Interest disclosure above also applies to relatives and associates of Manager Research Analysts in India. The Conflicts of Interest disclosure above also applies to associates of Manager Research Analysts in India. The terms and conditions on which Morningstar Investment Adviser India Private Limited offers Investment Research to clients, varies from client to client, and are detailed in the respective client agreement.
About Morningstar Manager Research
About Morningstar Manager Research
Morningstar’s global manager research team conducts objective, qualitative analysis of managed investment strategies such as mutual funds and exchange-traded funds. Manager research analysts express their views through the Morningstar Medalist Rating, which takes the form of Gold, Silver, Bronze, Neutral, or Negative. The analysts arrive at a strategy’s Medalist Rating by assessing key areas including its management team and supporting resources (People Pillar), its investment approach and rationale (Process Pillar), and the investment organization backing the strategy concerned (Parent Pillar). The analysts juxtapose those assessments with the strategy’s cost in arriving at a final Analyst Rating, which expresses their conviction in the strategy’s ability to outperform a relevant benchmark index or category peers over a market cycle, adjusted for risk. The Morningstar Medalist Rating methodology is forward-looking in nature and applied consistently across geographies and markets. (The Medalist Rating is an opinion, not a statement of fact, and is not intended to be nor is a guarantee of future performance.)
About Morningstar Manager Research Services
Morningstar Manager Research Services combines the firm's fund research reports, ratings, software, tools, and proprietary data with access to Morningstar's manager research analysts. It complements internal due-diligence functions for institutions such as banks, wealth managers, insurers, sovereign wealth funds, pensions, endowments, and foundations. Morningstar’s manager research analysts are employed by various wholly owned subsidiaries of Morningstar, Inc. including but not limited to Morningstar Research Services LLC (USA), Morningstar UK Ltd, and Morningstar Australasia Pty Ltd.
©2025 Morningstar. All Rights Reserved. Unless otherwise provided in a separate agreement, you may use this report only in the country in which its original distributor is based. The information, data, analyses, and opinions presented herein do not constitute investment advice; are provided solely for informational purposes and therefore are not an offer to buy or sell a security; and are not warranted to be correct, complete, or accurate. The opinions expressed are as of the date written and are subject to change without notice. Except as otherwise required by law, Morningstar shall not be responsible for any trading decisions, damages, or other losses resulting from, or related to, the information, data, analyses, or opinions or their use. The information contained herein is the proprietary property of Morningstar and may not be reproduced, in whole or in part, or used in any manner, without the prior written consent of Morningstar. To order reprints, call +1 312-696-6100. To license the research, call +1 312 696-6869.