
35 min read
Moats and Monetization in AI: Our View on How Frontier AI Labs Are Building Economic Moats
Executive Summary
In the almost four years since the launch of ChatGPT, the question that our technology equity research team hears the most is alarmingly simple: If every large language model can write the same email, summarize the same earnings, and generate a coherent block of code, why should firms building these LLMs earn outsize economic profits?
We began hearing this question in 2024 and 2025 as a way to assess whether public cloud vendors could earn reasonable returns on their large capital expenditures. In 2026, with investors eyeing potential IPOs in the artificial intelligence lab space, the question is more squarely aimed at labs such as Anthropic and OpenAI, as investors try to figure out whether these labs are on a fast track to commodification or building durable businesses.
We come out on the more bullish side, as we think leading AI labs are building economic moats. While we do not view these moats as fully formed yet, early usage data, product development, and partnerships indicate that leading AI labs will be able to extract economic returns from developing and running LLMs, staving off threats of commodification. The structure of this report is straightforward: It first presents the market's concerns, then highlights our position and where we could be wrong.
The Market's Worry
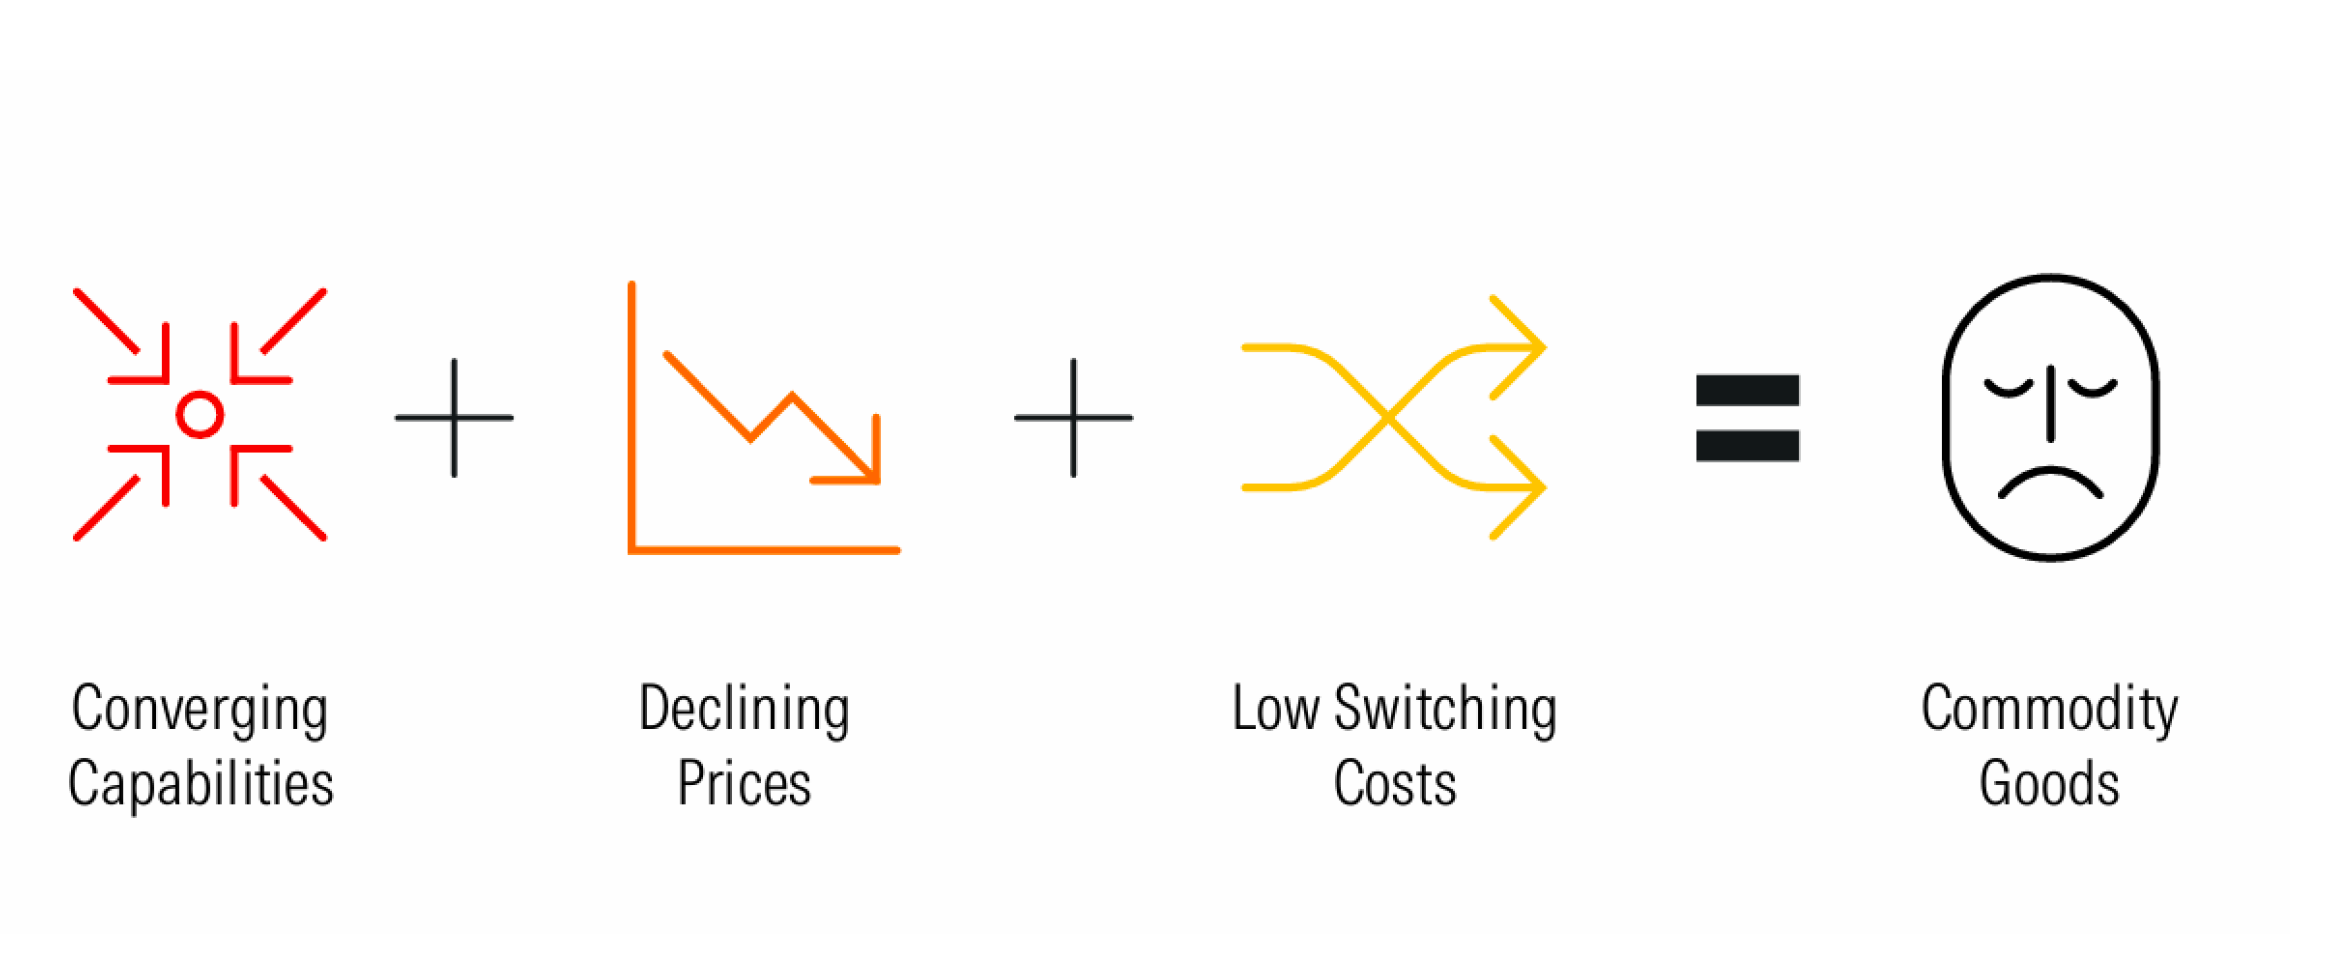
Investors see the three classic markers of a commodity market forming at the model layer: First, raw capabilities are converging, with Chinese open-weight models closing the gap. Second, the price of a fixed level of intelligence has collapsed since 2023. Third, switching models on third-party platforms is nearly frictionless.
Why the Market's Concerns Are Valid
If the labs cannot earn economic profits, the concern spreads well beyond Anthropic and OpenAI. The spending commitments rippling across chips, power, and data centers rest on the assumption that intelligence can be monetized at attractive returns, making the question of commodification, in effect, a question about the durability of the entire AI trade.
Our View
We think the leading AI labs are in the process of building economic moats and will stave off commodification. In our view, the bears are missing three things. First, model unit economics are inflecting as inference demand scales faster than training and research costs; Anthropic reached operating profitability in the first two quarters of 2026, well ahead of bearish expectations. Second, the labs are building data-and-product flywheels, an early form of network effects, in which usage improves models and tools, and better models and tools drive more usage. Third, the labs are building structural cost advantages through compounding training know-how, compute-scale discounts, concentrated research talent, and custom silicon.
Alternative Outcomes Are Possible
Widely adopted open models at or near the frontier (the most advanced AI systems), a migration of inference toward free small models on edge devices, and public-opinion-driven constraints on data center construction are the developments we watch as potential thesis breakers.
Key Takeaways
- We believe leading AI labs are in the process of building economic moats that will enable them to stave off the commodification threat.
- The question of commodification has implications beyond Anthropic and OpenAI. Spending commitments by these two vendors are spread across chips, data centers, and power.
- The bear case, or the case for commodification of LLMs, is based on three core theses: convergence of model capabilities, per-token price compression, and the lack of switching costs between models on third-party platforms. (A “token” is a basic building block of data that AI models use to read, process, and generate text.)
- On convergence, we believe the impressive performance of Chinese open-weight models rests on algorithmic efficiencies and at-scale distillation of US frontier models, a dependency that will let the open-model ecosystem track the frontier, not exceed it.
We doubt that US enterprises and government agencies will route scaled-up, production workloads to Chinese models because of national security risks.
- On unit economics, we believe investors mentally combine training and inference into one bucket. We advise against doing so. Training is lumpy and front-loaded, while inference is smooth and usage-linked.
- Inference gross margins on frontier models run in the 80% range, which means that as more compute (the total processing power and hardware resources needed to train and run AI models) is dedicated toward inference, model margins should inflect upward. We are seeing this happening in real time, with Anthropic posting two consecutive profitable quarters.
- Falling token prices inspire rapid token consumption. While the price of a fixed level of intelligence has fallen by more than 90% in under two years, token volumes have risen by a much larger multiple.
- Even as token prices fall, according to our estimates, the cost of serving tokens has been falling as well, which ensures that frontier lab margins remain healthy, even as token prices come down.
- Incremental intelligence, that is, being at the leading edge, continues to command a premium price. We don't see this dynamic changing anytime soon.
- Scaling on compute rather than headcount, as was the software model in years past, delivers far more operating leverage. Anthropic's revenue per employee has risen from roughly Salesforce's level in 2023 to north of $10 million per employee in 2026.
- We see two moat sources forming: a network effect driven by data and product improvements, and a structural cost advantage built on growing training costs and gigawatt-scale compute discounts.
- We see three key risks that could invalidate our thesis: open-weight models gaining wide adoption in the US enterprise; inference migrating to free, small models that operate on edge devices; and public opinion-driven constraints on data center construction leading to revenue growth hiccups.
GenAI 101: Setting the Stage
Before diving deeper into the specific dynamics that give us confidence that AI labs can build durable business models, it is worth providing a general overview of how LLMs work, especially the delineation between training and inference, and a brief overview of the two main pure-play AI labs, Anthropic and OpenAI.
Building LLMs
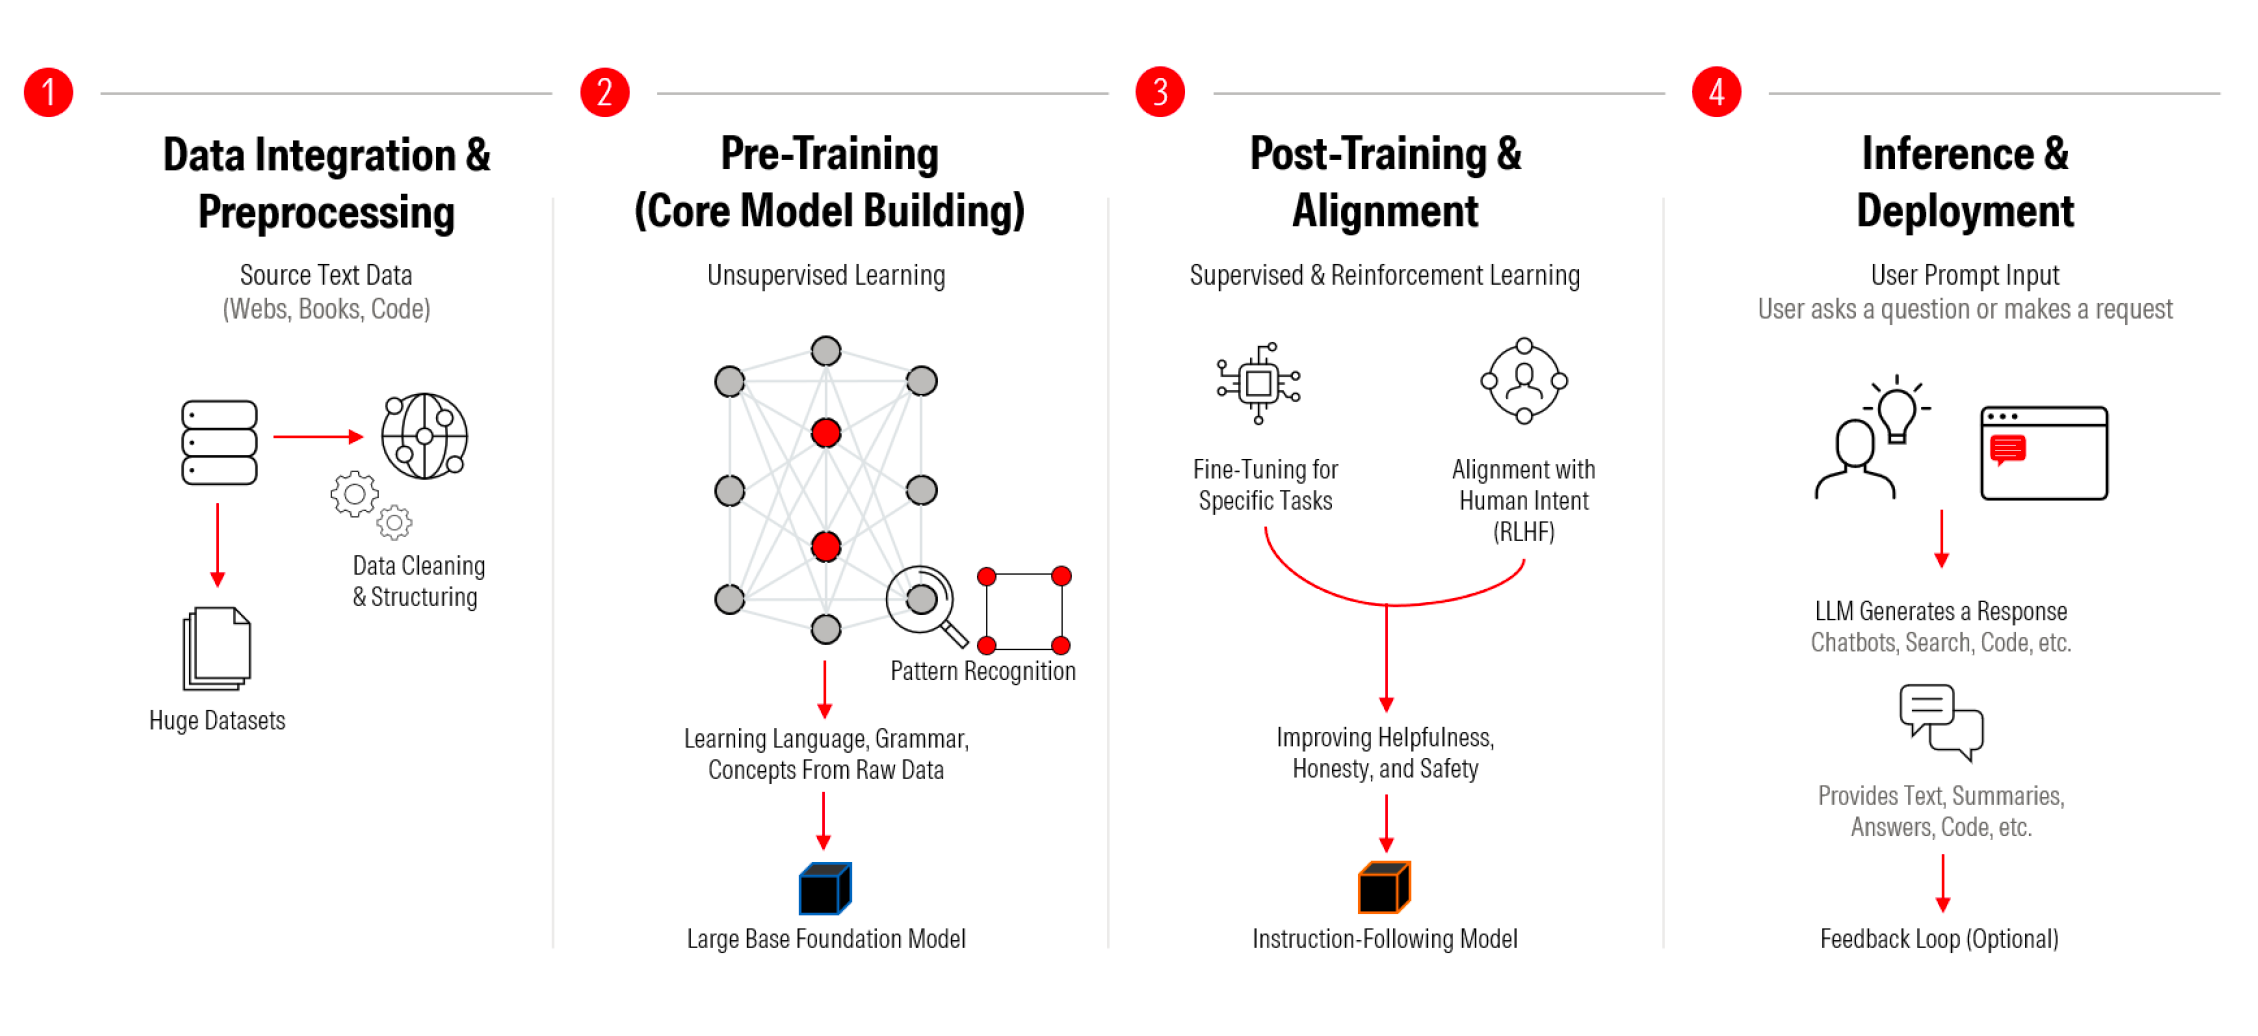
A large language model is the output of a four-stage process: data ingestion and processing, pretraining, post-training, and inference.
How Large Language Models Are Set Up
Source: Morningstar.
During the first stage, data ingestion and preprocessing, AI labs source enormous volumes of text from a variety of sources, including the open web, books, code repositories, and synthetic data from prior large language models. The labs then clean the data and structure it into training-ready datasets.
The second stage, pretraining, is the core model-building step, in which unsupervised learning runs across massive AI-accelerator clusters teach the model the language, grammar, and conceptual relationships from the data that it has access to. These training runs can take months at a time, with outputs only known after they’re complete. This time-delay dynamic is a contributing factor to why having the best talent matters for AI labs. Small tweaks in the training run can lead to materially different model quality outcomes, with improvements only visible after a compute-expensive training run is already complete.
The third stage, post-training, is typically when AI labs teach raw LLMs to be helpful, honest, safe, and to follow instructions. Post-training is also the stage where reinforcement learning with human feedback plays a major role in helping models develop skills such as drafting documents or building models. This stage is also when AI labs set parameters for models to ensure they refrain from performing certain tasks, such as helping create biochemical weapons or infiltrating codebases.
The fourth stage is inference and deployment, in which end users can submit prompts and the model generates outputs based on its pre- and post-training learning.
The important thing to keep in mind for investors is that the first three stages are fixed costs incurred before the model generates any revenue, and the remaining costs are reserved solely for the inference stage. The cost structure in the inference stage, however, is variable and scales alongside usage.
Training and Inference
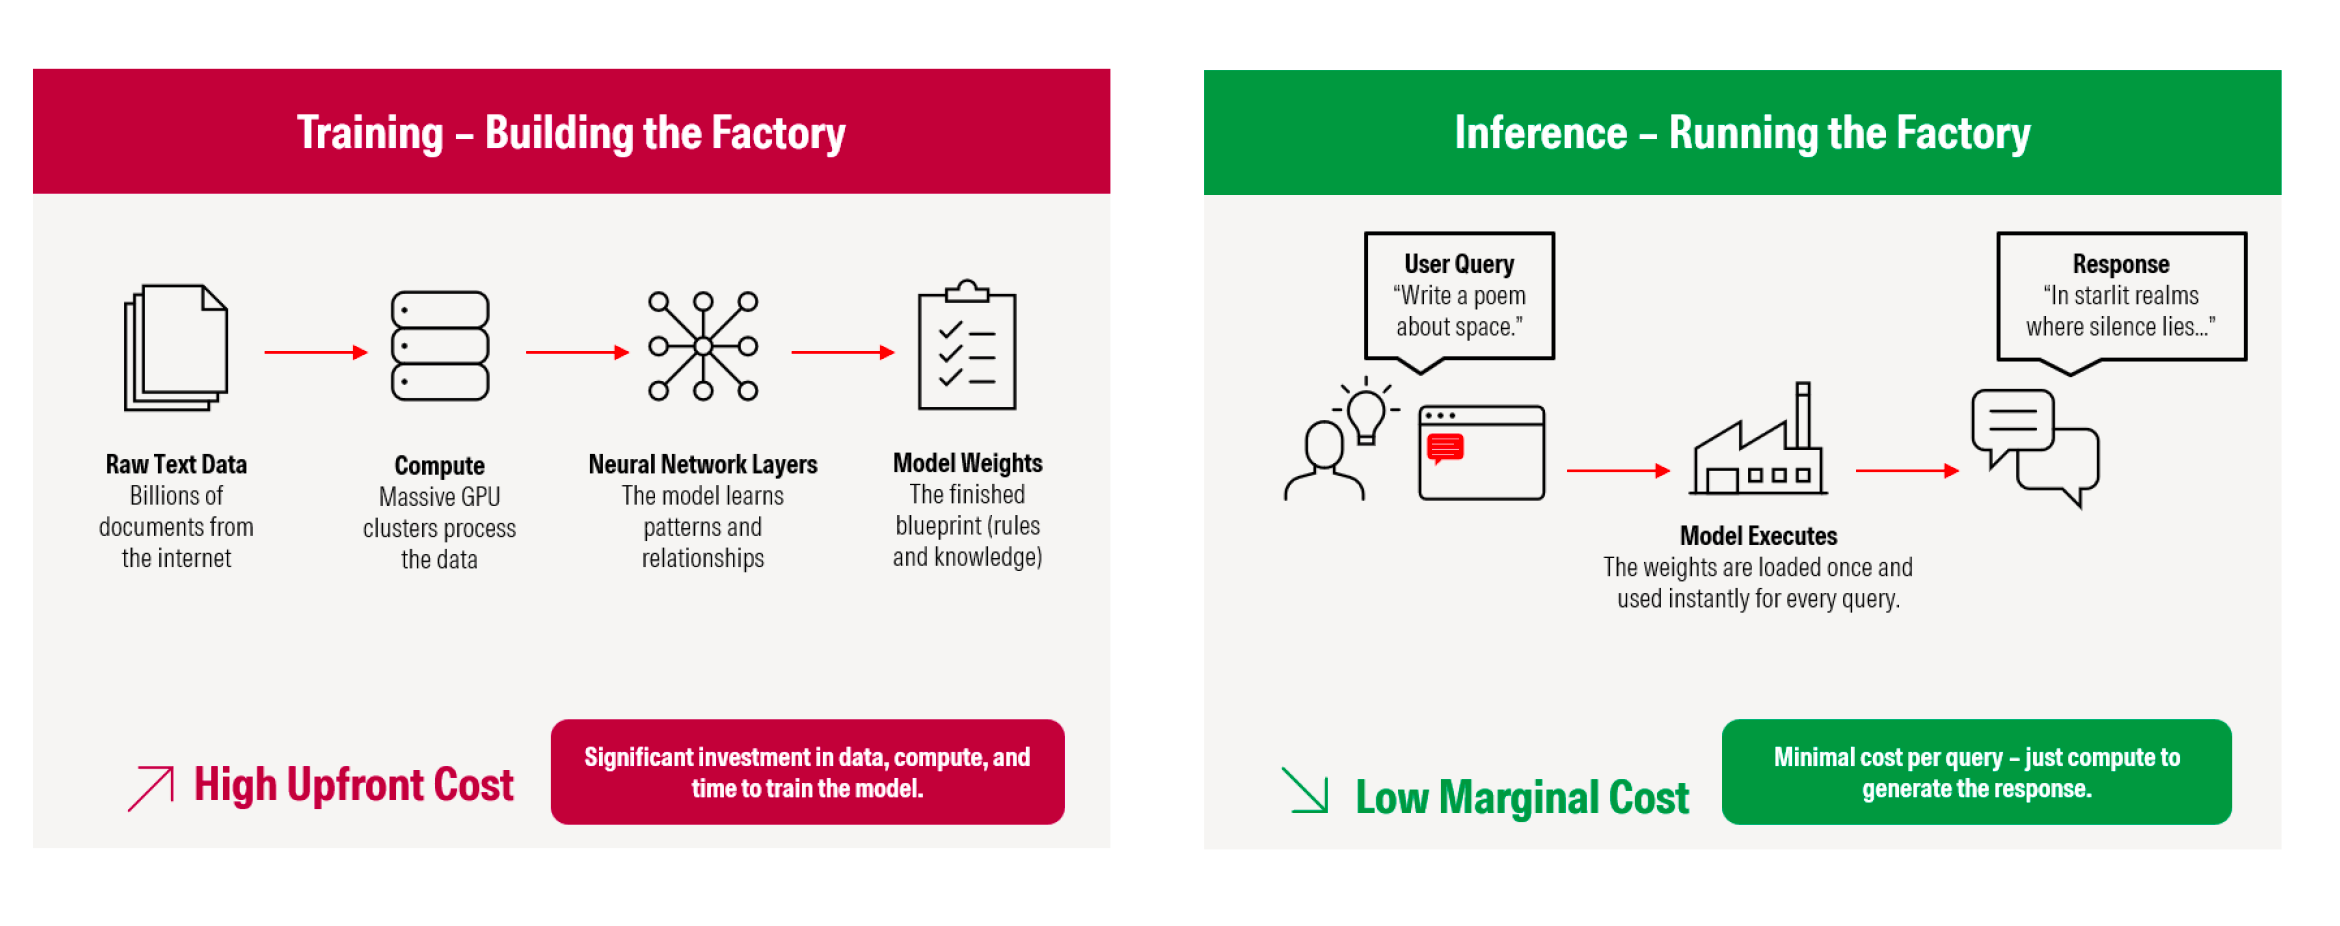
If we had to distill the development of LLMs even further, we’d think that investors can break it into two stages: training (stages one to three above) and inference (stage four).
Training Versus Inference
Source: Morningstar.
We reiterate this point because investors often lump model development costs into one bucket and try to calculate AI labs’ economics as if training and inference costs were conceptually the same, which they are not.
We see training as analogous to building a factory. Developing a frontier model requires substantial capital expenditures to access cloud infrastructure and AI accelerators capable of supporting massive training and post-training runs. As the labs build each factory or model, they do not collect any revenue, and the economic returns from this factory are wholly linked to the eventual quality of its outputs and customer demand for them.
Another dynamic to highlight here is that AI labs can train a large model and then use it to train downstream models that are cheaper and more efficient.
Inference, on the other hand, is akin to running the factory. While you need cloud infrastructure and AI accelerators to run each model, the costs are a fraction of the costs of training runs. Also, for leading AI labs, most of their inference volume is directly monetizable through subscriptions, direct billing, or advertising.
To get a clearer picture of the durability of AI labs’ business models, we must treat training and inference separately, as we do in other businesses, where we have different economic conceptualizations of fixed and variable costs.
Leading Labs: A Brief Overview of Anthropic and OpenAI
While we could provide detailed backstories for many AI labs, we believe there are currently two true pure-play frontier AI labs: Anthropic and OpenAI. While other labs, including Google, Meta, and SpaceX, have models either right at the frontier or in the vicinity, we believe the question of moats and monetization in LLMs is particularly prescient for Anthropic and OpenAI.
Who's Who in LLM Land: We See Two Key Leaders
Source: Morningstar, company documents, news reports. Data as of Sept. 18, 2026.
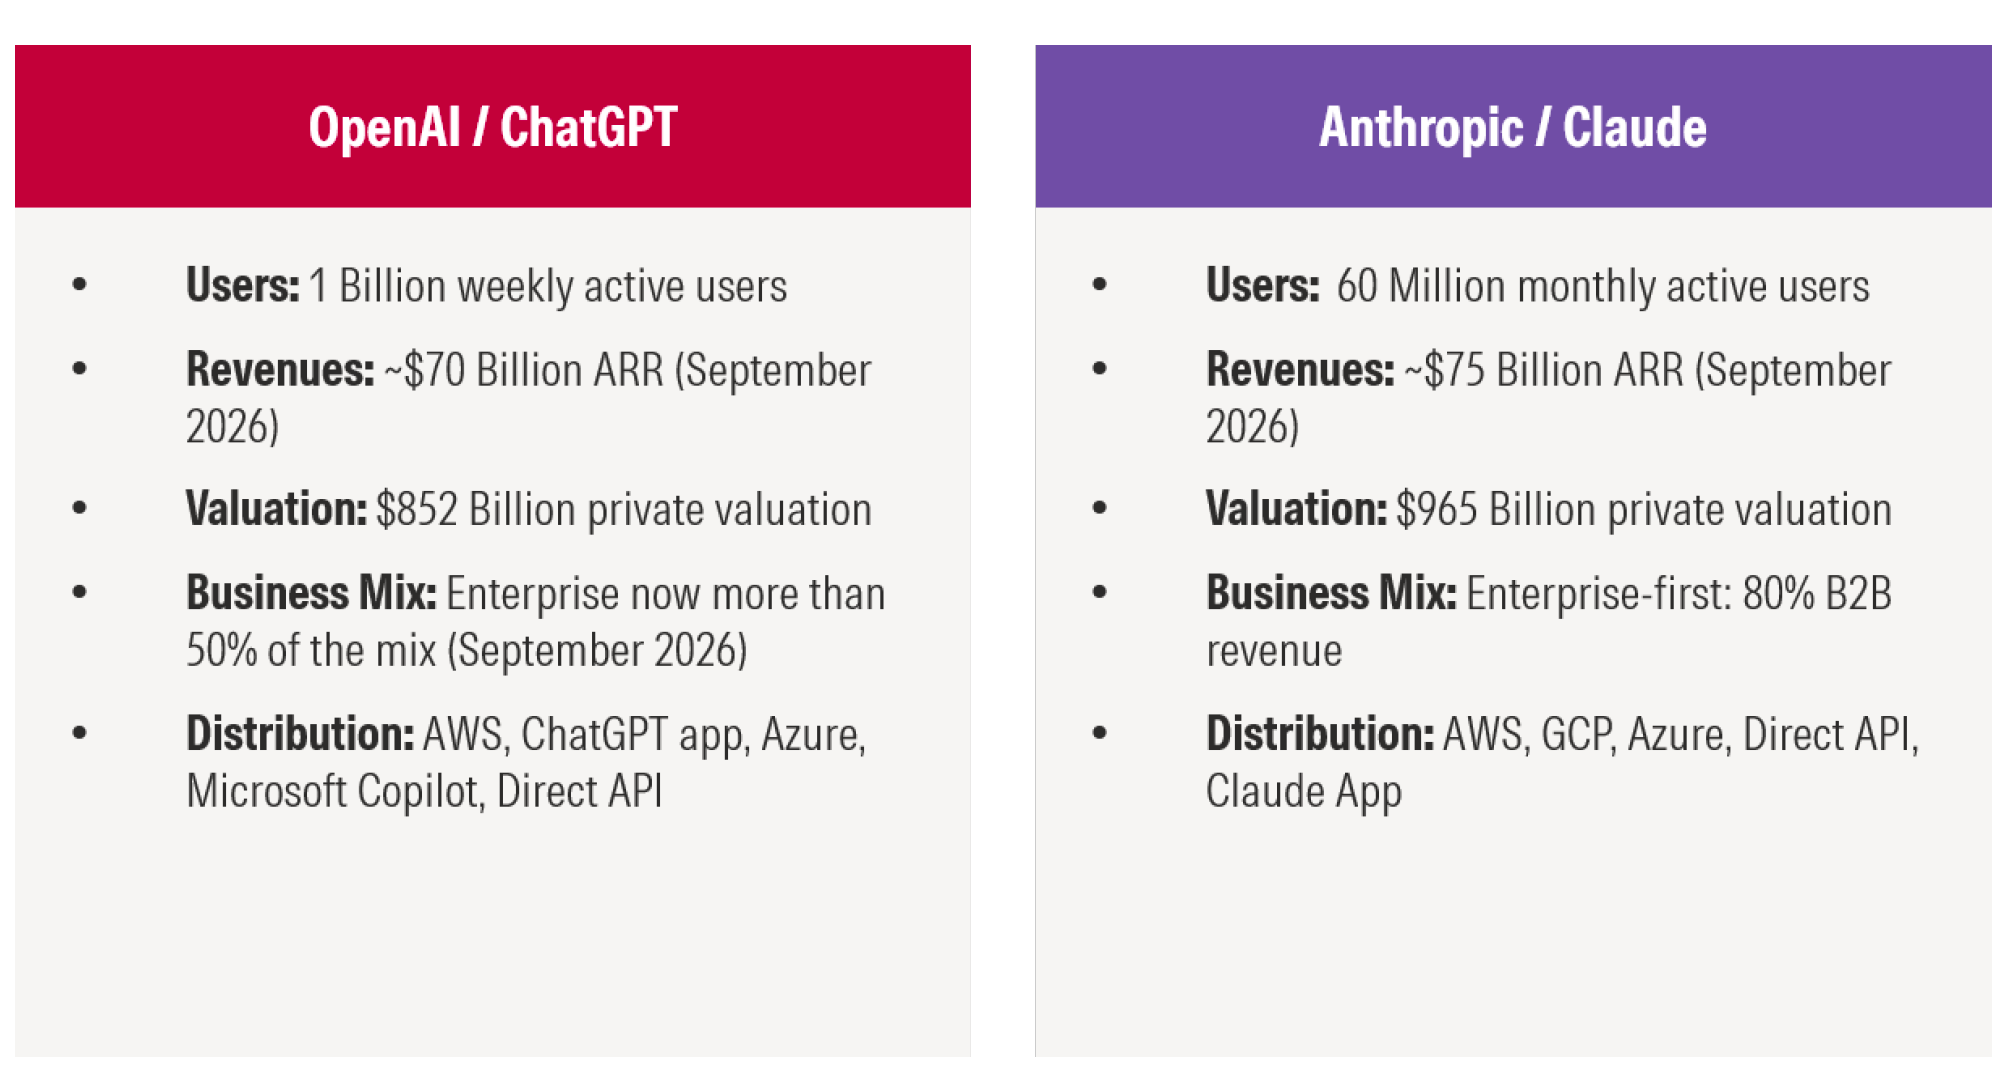
The clearest differentiator between OpenAI and Anthropic has been their respective go-to-market strategies. While OpenAI has maintained a hybrid strategy, targeting both consumers and enterprises, Anthropic has squarely focused on the latter.
OpenAI has more than 1 billion monthly active users, monetizing them through a mix of advertising and subscriptions. On the enterprise side, the firm has seen strong adoption of Codex, its AI coding tool, leading to a material shift in its revenue mix, with nearly all incremental growth in 2026 driven by enterprises. In its most recent funding round, OpenAI raised at an $852 billion valuation, up from $500 billion a year ago.
Anthropic’s top line is almost entirely driven by businesses. The firm’s coding tool, Claude Code, has become an industry standard, and the firm continues to build products focused on knowledge work and software development use cases. The firm’s revenue growth in 2026 has been staggering, with its annual recurring revenue growing from $9 billion at the end of 2025 to $75 billion at the end of September 2026. In its most recent funding round, Anthropic raised at a $965 billion valuation, slightly higher than OpenAI's.
On a go-forward basis, we expect the firms to continue to compete extensively in the enterprise segment, with OpenAI increasingly turning its scarce compute resources toward enterprise use cases.
If investors can take one message away from Exhibit 4, it is that the frontier is crowded at the top, with leadership rotating each release cycle. Also, the gap between the two frontier labs, as well as other labs, including Google and Meta, has compressed meaningfully, which could imply a convergence in capabilities.
This convergence of capabilities is a key part of the bear thesis against AI labs; we present it in the following section.
Bears Say: Won’t LLMs Just Become Commodities?
The core bear case against leading AI labs can be boiled down to three main arguments. One, we are seeing a convergence in capabilities. Two, we are seeing a decline in token prices. Three, model companies do not have high switching costs, making it easy to switch between models. These are admittedly the three indicators you would want to see to identify a typical commodity-like market.
The Bear Thesis: LLMs Exhibit Properties of Commodity-Like Goods
Source: Morningstar.
Each leg of this three-legged bear stool is supported by observable data. Bears argue that if all three legs hold, then models become interchangeable inputs, with pricing power transferring away from model builders to firms that control scarce complements (chips, power, cloud infrastructure, distribution).
We find this to be a coherent bear case, as it does not seek to dismiss AI as a “fad” or merely a theme that investors are excited about, much as they were excited about NFTs and cryptocurrencies back in 2020-21.
So, let’s take the three legs in turn.
Bear Leg One: Converging Capabilities and the Chinese Open-Model Risk
The capability, or raw intelligence, as measured by industry researchers, data is clear: when we chart the difference between frontier models’ scores (first place minus second place, and second place minus third place), the trend is one of clear compression. Gaps that once spanned double-digit index points have narrowed to the low single digits, with the order of who has the best model also regularly shuffling (as seen at the end of the last section). Barring some AI lab unlocking recursive learning, which enables its models to self-improve rapidly, we expect this compression dynamic to remain intact.
Adding further complexity to the convergence of capabilities is the rapid rise of Chinese open-weight models, which have shown clear progress relative to US models over the past year. The fact that open-source, cheaper versions of frontier models can appear months after seemingly every new frontier model launch supports the claim that capability differentiation is truly difficult to protect.
Our Take
We understand that investors remain focused on whether the proliferation of Chinese open-weight models commoditizes the model layer. Our view is that Chinese models will continue to lag US frontier models because of structural reasons, listed below. Further, we believe that the rise of open models capable of taking over low-value tasks will, in turn, create greater demand for orchestrators and frontier models to efficiently manage these utility-tier models. Finally, we think it is highly unlikely that US enterprises/government agencies will standardize their workflows on Chinese open models for a variety of reasons, including national security and cost-related factors that we discuss below.
The Chinese open-model bear case is certainly top of investors’ minds, as we saw in investor worries about the prospects of frontier model companies following the release of DeepSeek’s R1 model in January 2025 and Moonshot’s Kimi K3 model in July 2026.
While we don’t want to dismiss the impressive technical improvements the Chinese labs have made over the past couple of years, we’d like to remind investors that their progress comes down to two key factors.
First, as Chinese labs develop models in a hardware-constrained ecosystem (because they don’t have access to the latest AI chips), the only way to remain competitive is to optimize their software and algorithms to train and run models efficiently on older hardware. As we saw in the US model launched following DeepSeek’s R1 launch, US companies can quickly see the algorithmic advancements made by their Chinese counterparts and incorporate them into their own training apparatus, achieving even better model outcomes because they have access to better hardware than Chinese labs. This dynamic means that as long as Chinese models remain open-weight and release technical papers detailing their algorithmic advancements, US labs can incorporate these methods into their models to accelerate their progress.
Second, Chinese labs have been using outputs from Claude models, as well as the thinking traces that Claude provides, to further refine and improve their own models in a process known as distillation. If Chinese model roadmaps rely, at least in part, on leveraging frontier US models for improvement, then Chinese models, by definition, cannot surpass US labs in a meaningful way.
We would concede that neither dynamic, on its own, is an argument against convergence. In our view, what these dynamics establish is a ceiling rather than a differentiator: a distillation-dependent ecosystem can track the frontier, but it cannot durably lead it.
From a value-creation versus value-capture perspective, we think that the proliferation of Chinese open models may spur greater demand for intelligent orchestrator models to manage them. The analogy to keep in mind for investors is that of a competent manager, whose value increases when they have competent employees to whom they can delegate tasks. If an orchestrator model can manage a host of agents, keep them on task, and deliver real business value, we believe a disproportionate amount of value would accrue to this orchestrator agent. The natural rebuttal is that orchestrators should converge just as base models have. We would note, however, that orchestration quality is less a function of raw weights and more a function of post-training investment, tool use, context handling, and reliability across long task chains, which have so far proved to be the layers hardest to replicate through distillation.
Beyond the value-capture opportunity for frontier models, we do not believe that US enterprises, government agencies, or companies working with the US government will adopt Chinese open models to save on inference costs. The policy, security, and strategic realities are such that the US cannot afford to cede its intelligence layer to companies that operate out of an adversarial nation-state. While bears would love to show us OpenRouter usage data indicating adoption of Chinese open-weight models, we do not find that data representative of actual enterprise workloads, as it heavily skews toward hobbyists and individual developers.
We would take the adoption argument further. First, we believe US procurement rules and sector regulations are likely to formally restrict the use of Chinese models in enterprise and government settings, and such rules can be written strictly enough to close the obvious backdoor of downloading open weights and running them on-premises without technically routing through a Chinese company. Second, even without strict rules, we doubt most enterprises want to stand up on-premises weights and build the surrounding serving, security, and evaluation infrastructure themselves. The revealed preference of enterprise IT is to pay a third party for a turnkey, supported package.
It is also worth asking why the Chinese open-weight ecosystem exists in the form it does. In our view, the answer is partly legal: Chinese labs operate in a jurisdiction that does not meaningfully enforce intellectual property claims around model outputs, allowing them to distill from US frontier models in ways US companies could not replicate without inviting litigation. This asymmetry lowers Chinese research and development costs, but it also creates a dependency that US labs can attack. If frontier labs restrict their most capable models to private, enterprise-only channels, withhold reasoning traces, and deploy distillation-detection techniques, the pipeline feeding the Chinese open-model ecosystem narrows considerably. Should distillation become materially harder, the competitive set at the frontier effectively collapses to the two or three US labs, and convergence becomes a much smaller concern for the economics of the model layer.
Beyond the national security argument, prior comparisons show that Chinese open models are not as cheap as sticker-price comparisons suggest. To put it in concrete terms, Kimi K3's API pricing is a blended rate of $5.40 per million tokens, which is roughly half of Opus 4.8 ($9) and GPT 5.5 ($10). While this may appear to be a big discount, we've seen prior Chinese open-source models be much more token-intensive and require many more steps to complete tasks, reducing the price advantage and, in some cases, even reversing it.
Data from industry researchers supports this view, with cost-to-run comparisons showing that models with lower sticker prices often cost as much as, or more than, models with higher sticker prices to run real workloads once token intensity is accounted for. The broader point, in our view, is that the fundamental cost input at the model layer is compute and the efficiency with which it is used. If the US frontier labs have better hardware and use it more efficiently, through caching, batching, and serving optimizations that come with scale as well as proprietary algorithmic work, these inference efficiencies can more than offset the research and development cost advantage that distillation hands the Chinese open-model ecosystem.
Bear Leg Two: Price Compression
The pricing data, if anything, is even more dramatic. When models are grouped into intelligence cohorts, and price per intelligence cohort is tracked over time, we see material price compression. Intelligence that commanded $17 per million tokens in late 2024 can be purchased for $0.50 per million tokens in 2026, a 97% price decline in less than two years.
Even in the frontier models, we have seen a similar downward trend in the months following their release. Models scoring above 40 on the Intelligence Index have seen prices compress from roughly $5 toward $0.25 per million tokens within a handful of quarters of release.
Our Take
While it can be easy to look at these price charts and jump on the side of commodification, we’d urge readers to reserve judgment. Falling unit prices, when paired with exploding volumes, can lead to high sales growth (we did mention Anthropic’s meteoric sales growth, right?). For example, even if the price per token falls by 90%, if token usage increases by more than 10 times (as it has), the total amount spent on tokens still goes up. Another point worth noting is that the AI labs' ability to efficiently serve models has also increased dramatically over the past few years. As a result, these labs can effectively maintain margins while the price per token declines for certain models within their model families.
While we concede the point of price compression to the bears, we’d argue that the volume response to falling prices and the model companies’ ability to serve models more efficiently matter more, as we will lay out in our unit economics section, which is just around the corner.
Bear Leg Three: Low Switching Costs
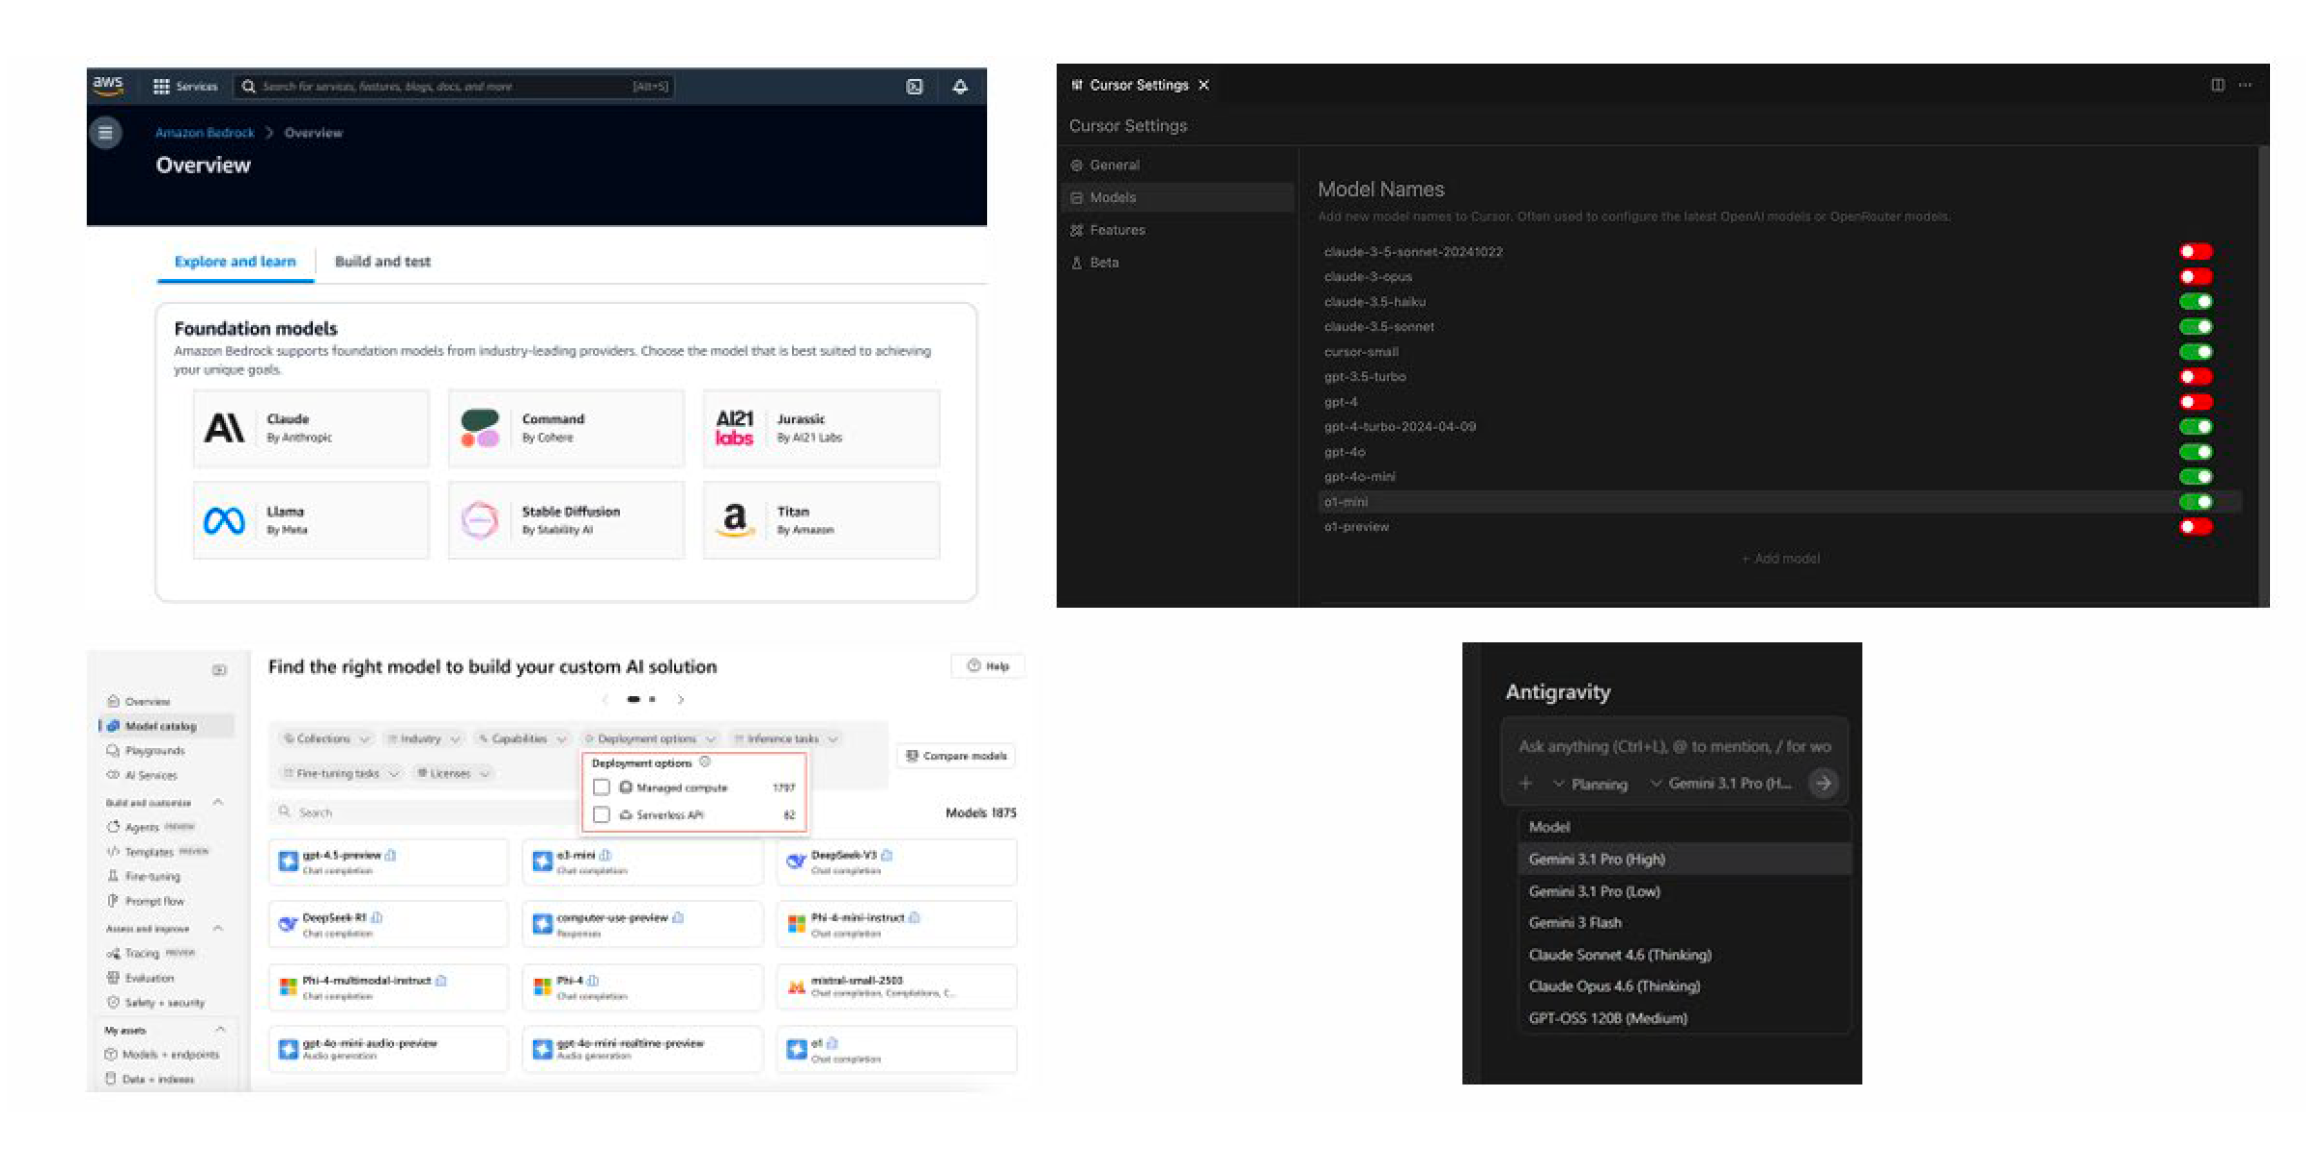
The final leg of the three-leg bear argument for commodification, low switching costs, is also largely correct at the infrastructure layer. When using cloud platforms such as Microsoft Azure or AWS Bedrock, or coding tools such as Antigravity or Cursor, users can simply pick a different model from a drop-down menu, as shown in Exhibit 9.
Switching Between Models Is As Easy as One-Two-Three
Source: AWS Bedrock Console, Cursor Model Settings, Azure AI Foundry Model Catalog, Google Antigravity.
This dynamic, especially when it comes to the hyperscalers, makes sense as these firms benefit from a competitive and interchangeable model layer.
Our Take
Our pushback on this bear case is more nuanced. While we agree that the cost of switching a model endpoint, such as a model on Cursor, is near zero, the cost of switching an enterprise AI deployment is not. Enterprises investing in areas such as prompt engineering, evaluation harnesses, fine-tuning models, and building agentic scaffolding are doing so by modeling these tasks after a specific model or model provider. If they were to switch models on the fly across their entire organization, they’d run into a ton of quality-control issues, as many of the processes that they’d developed won’t simply port over to the new model.
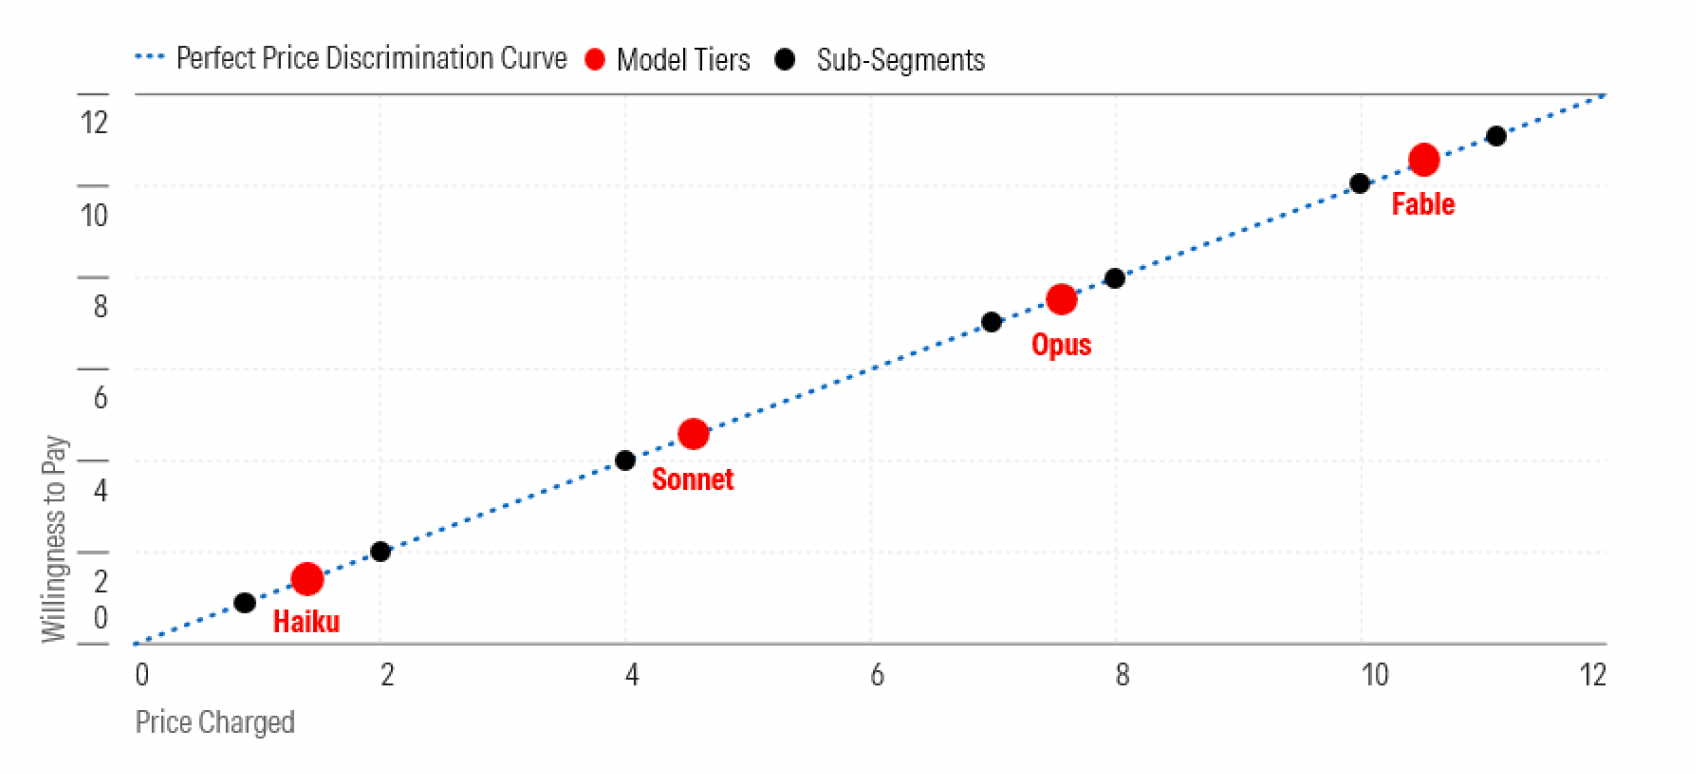
While we see the argument for more competition on the model layer as companies rationalize their AI spending, we believe model providers’ price segmentation strategies will largely accommodate this rationalization while keeping enterprises within their larger ecosystems, which include apps, harnesses, artifacts, and so forth. In other words, the model companies will offer different models with varying levels of intelligence and speed at different price points. If you want the cheapest model for a simple, repetitive task, that will be an option, and vice versa, all offered as a complete menu within each model company.
Anthropic's Price Discrimination Strategy
Source: Morningstar. Note: Data is illustrative.
This ecosystem point also previews what we view as a structural conflict between the model companies and the software industry. The value that sits outside the model weights, including harnesses, company context, workflows, and integrations, is precisely the layer software firms have historically been built to capture. We see two plausible equilibria: either software firms become the distribution and final integration layer for the model companies, with the model acting as a tolled input, or the model companies vertically integrate and effectively become software firms themselves. The same tension runs through the labs’ relationships with public cloud providers, as hyperscalers benefit from an interchangeable model layer while model companies work to deepen lock-in around their own ecosystems.
Our Take on the Broader Bear Thesis
We believe that AI lab bears make a valid point. We accept that raw model capabilities are converging, with Chinese open models being a clear competitive threat. We also accept that per-token prices are structurally deflationary, and that switching models on third-party platforms is basically frictionless.
That said, as we laid out above, all three legs of the bear case deserve more attention. We also believe that by centering the argument around convergence, price, and switching costs, investors can lose sight of the two factors that matter far more.
First, the unit economics of the model business are inflecting in a manner not typical of commodity businesses, with clear operating leverage emerging despite their nascent stage. Second, the sources of durable advantage in the model business are not going to be benchmark scores and raw intelligence. The true sources of competitive advantage and differentiation in the model layer, in our opinion, lie in the data flywheels (network effects) and the structural cost advantages these firms are building. These two factors constitute the remainder of our report. AI bulls, please enjoy the fun part.
Counting the Nickels and Dimes: Our View on Model Layer Unit Economics
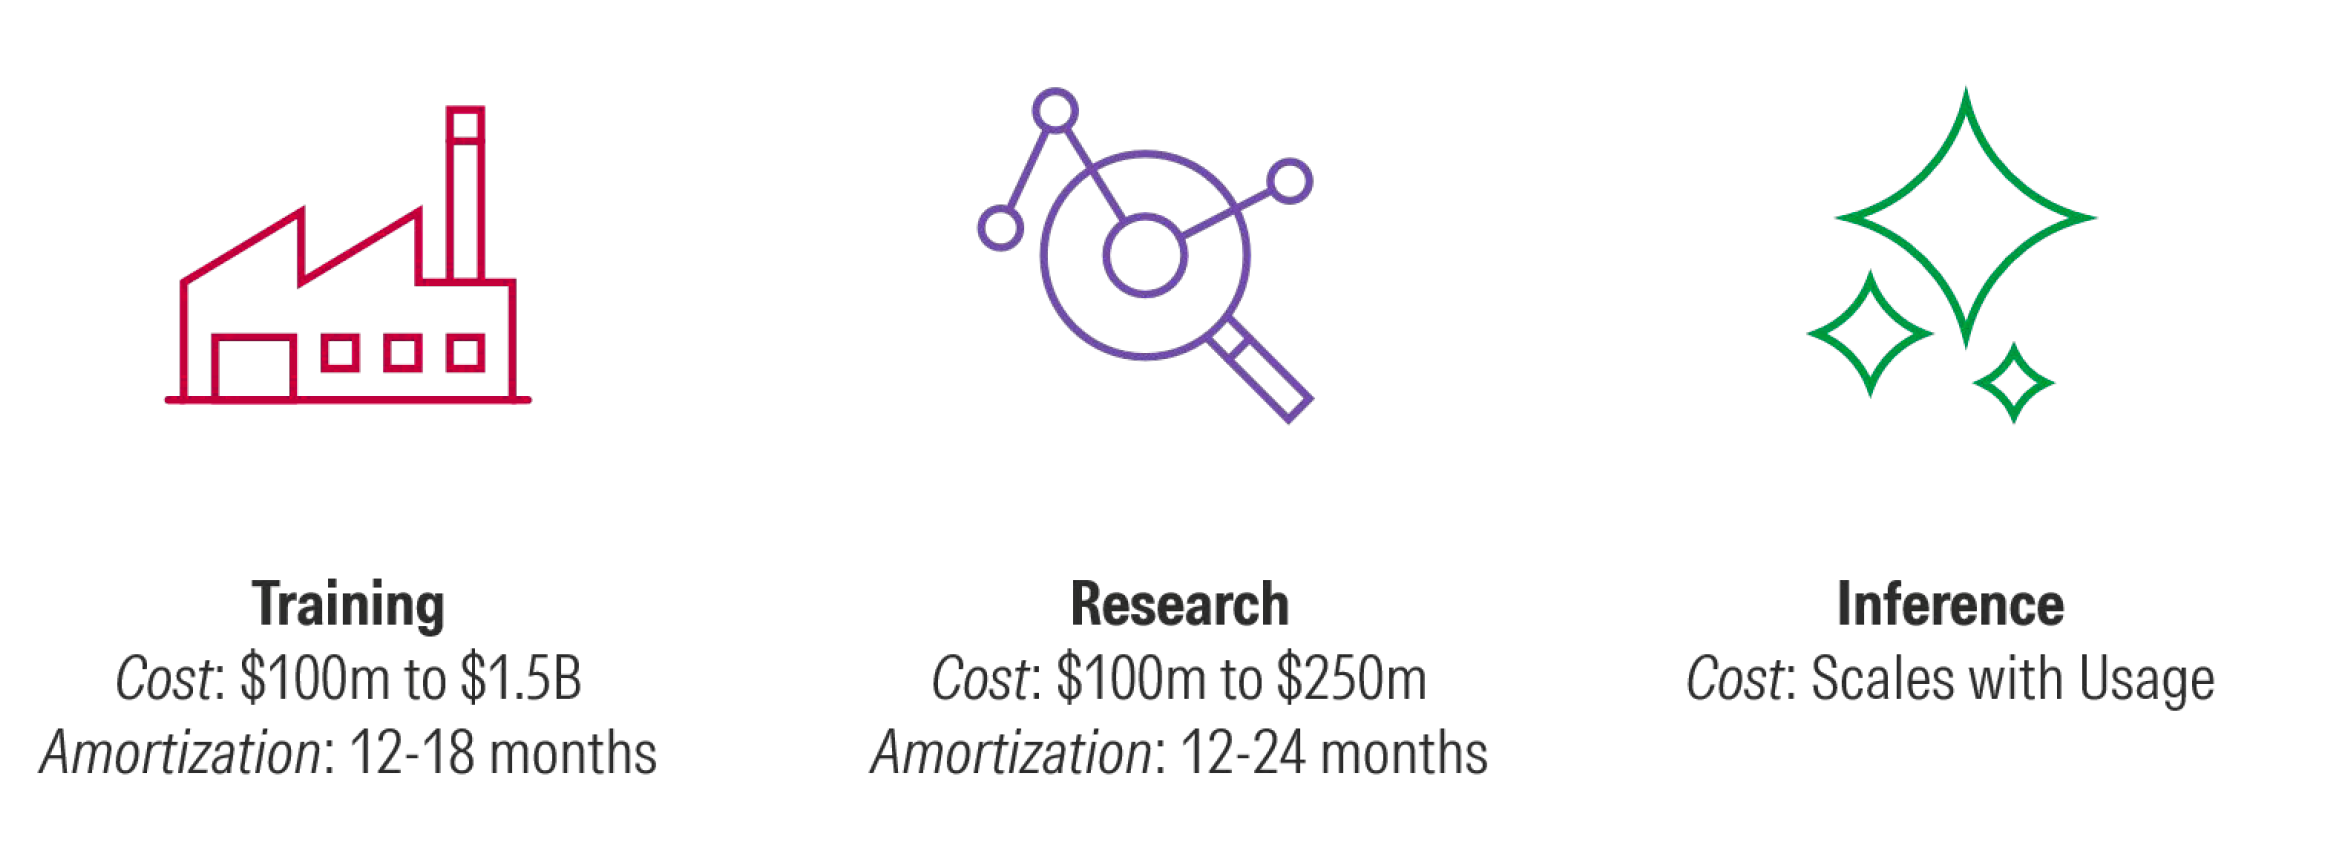
To support our view that unit economics are much better than investors think, we first separate an AI lab’s cost base into three primary centers. The scalability and amortization of these costs are key to understanding these firms’ longer-term margin trajectories.
The Three Primary Cost Centers for AI Labs
Source: Morningstar estimates. Data as of Sept. 18, 2026.
As a model company decides to divvy up its compute, it can choose among three buckets.
Bucket one is training. This cost, as we discussed in the foundation section, is mostly fixed and is amortized over the trained model’s useful life, which is around a year. Investors may be surprised to see such a long useful life, considering model launches and improvements are far more frequent. To this point, we’d note that pretraining costs are mostly tied to training a new generation of models (an example would be a jump from Claude 3 to Claude 4). So, once you complete a successful pretraining run, you can leverage it to launch multiple models that build on the same initial run (for example, Opus 4.6, Opus 4.7, and Opus 4.8 are all based on the same pretraining run). This teacher-student framework is why training costs are amortized over a longer period than investors may be thinking.
Bucket two is research. This bucket consists of costs associated with building the infrastructure around models. We noted some kinds of infrastructure in the prior section (harnesses, scaffolding, applications, and so on). This bucket also holds the costs when a model company specifically targets clear verticals (such as Anthropic’s Claude Design or OpenAI’s Codex). The costs in this bucket are not only lower than training costs, but they’re also amortized over a longer period. A good example of this timeline could be the cost of developing and maintaining Claude Code or OpenAI’s Codex; both tools clearly have useful lives longer than a year. Given the multitude of experiments in this bucket, we believe a reasonable amortization period for research costs is likely between one and two years.
Bucket three is inference. This bucket holds the cost of serving the trained models and tools in production and scales with usage. It is also worth reiterating that inference is the only bucket with any associated revenue. When looking at gross margins on inference, we estimate they’re roughly 80% for leading AI labs in the US. Premium models, such as Fable 5 or GPT 5.6, carry higher margins than lower-tier models, as the difference in the cost to serve premium Versus cheaper models is less than the difference in the end-user pricing.
The structure and time scale of these three cost centers point to the central asymmetry of the model business. Training and research are lumpy, front-loaded, and generation-bound, while inference is smooth and usage-linked.
Over the past few years, we have seen AI labs focus the vast majority of their resources on training and research as they’ve been building core models and the ecosystem to leverage them from scratch. Inference scaling, on the other hand, only kicked off in earnest in 2025-26. This inference scaling relied on investments in training and research that made the models and relevant tools useful enough for companies and users to deploy.
So, as investors, the real question about AI lab economics is not whether a lab loses or makes money during training and research (hint: they lose money), but rather what the company’s economics look like as inference becomes a larger part of the overall compute pie, and how much can inference scale relative to training.
As Inference Scales: Revenue and Margins Will Inflect Upward
Our core thesis on AI lab unit economics can be put in one sentence: inference demand is scaling exponentially, with a significantly steeper curve than training and research costs. As both inference and training and research costs continue to scale, the gap between the two curves widens, and that is where this industry's profits will be found.
A corollary to the above assertion, which we think is not properly understood or appreciated by investors, is that longer-term margins in the model business are driven by inference rather than training. Investors who are overindexed on high training budgets will continue to miss the fundamental strength of these businesses. As more compute comes online, a disproportionate share will be earmarked for inference, further skewing these businesses' margin profiles upward. Stated differently, while the initial margins are negative (dominated by training), the incremental margins are closer to 80% (the margin profile of pure inference), and as these companies mature and inference becomes a larger proportion of the overall compute budget, we will shift closer and closer to that 80% mark.
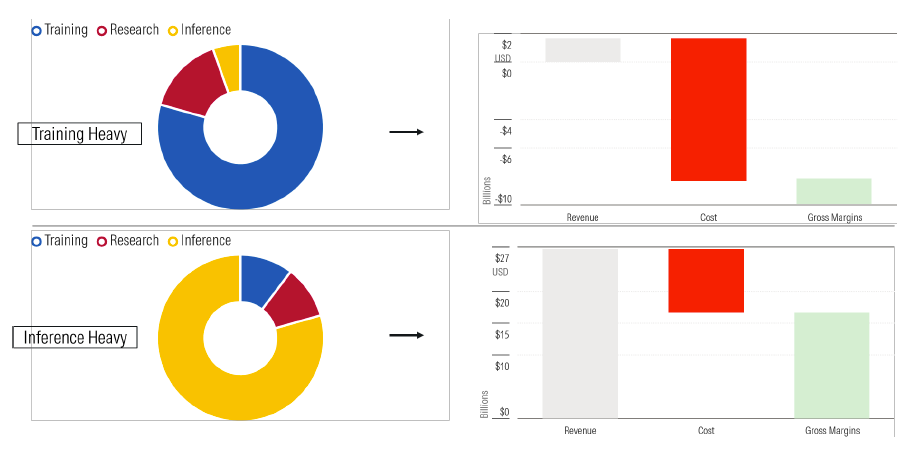
To make this mix-shift argument more concrete, we ask the reader to consider two stylized income statements in Exhibit 13, representing two labs, both with a $10 billion compute budget, that must allocate their budgets across the three buckets discussed above.
Source: Morningstar estimates. Data as of Sept. 18, 2026.
The training-heavy lab devotes the bulk of its compute to training and research, with inference only getting a sliver of total compute. The inference compute, with its 80% margin, contributes $2 billion in revenue, which pales in comparison to the overall compute bill of $10 billion. As a result, the lab runs gross losses of $8 billion. This scenario, while hypothetical, is a reasonable sketch of every frontier lab in 2023 and 2024. Since investors began thinking about these businesses around that time, we believe the mental model of a training-heavy lab has been etched into many investors' minds, an etching we are prompting them to revisit and rethink.
The inference-heavy lab inverts the pie. Inference dominates the compute mix, with training and research condemned to a lower share of the same $10 billion compute bill. In an inference-heavy scenario, the same business generates $27 billion in revenue, yielding positive gross margins, with gross margins approaching the inference threshold as inference’s share of compute continues to grow.
This transition is happening right now, and we have data to back up this assertion. Anthropic reached operating profitability (not gross profitability, mind you) in the first quarter of 2026, posting 5% operating margins on $11 billion in quarterly sales. The firm achieved this milestone as its compute mix shift skewed more toward inference. We’d also note that the firm's path to operating profitability in the first quarter of 2026 was much faster than the bears' model—which assumed these labs would remain unprofitable indefinitely.
The Marginal Returns to Intelligence Are Positive and Steep
We discussed the bear thesis on capability convergence earlier. An implied conclusion of convergence is also that incremental intelligence has diminishing commercial value; that is, once a model is good enough for certain tasks, better models cannot generate additional value to justify the large training and research expenditures.
The revealed-preference data argues otherwise, with returns on both training and research expenditures showing strength.
On the training side, we’d like to use the example of Gemini, Alphabet’s LLM, with Alphabet providing quarterly updates on token consumption. We believe this trend holds true across AI labs, with each successive model generation not only meeting more demand (volume of tokens) but also doing so without cratering the price charged at the frontier (price per frontier token).
Within Alphabet’s Gemini franchise, each successive model generation, from Gemini 2.5 through 3.0 and 3.1, has processed progressively higher volumes of tokens per minute, rising from around 7 billion to
10 billion to 16 billion. Further, the growing token volumes have been paired with a step up in prices, which further shows that there is pricing power for leading models when they first come out.
At first glance, rising launch prices at the frontier may appear to contradict the price compression we charted earlier, so the two exhibits are worth reconciling directly. Each new model generation launches at a higher intelligence level and a higher price point than its predecessor, and then rides its own declining price curve as it ages and is undercut by newer, more-efficient models. This dynamic was shown in the intelligence-cohort chart in Exhibit 8. The core idea that investors should keep in mind is that when a new frontier model launches at a higher price, usage migrates toward it in short order rather than pooling in the cheaper prior generation, which is what one would expect if incremental intelligence carried real commercial value.
On the research side, we see a similar trend. Products that have emerged from the research bucket, such as OpenAI’s Codex and Claude Code, are clearly driving strong customer demand, turbocharging monetization for the underlying models by making more of their capabilities accessible to everyday users.
Scaling on Compute, Not Labor, Provides Much More Leverage
Before turning our attention to economic moats, we leave the reader with one more piece of unit economics analysis. A business whose principal cost center is people scales revenue mostly by hiring. While revenue per employee tends to improve with scale, the gains are often marginal rather than transformational.
On the other hand, a business whose principal cost center is compute scales revenue by bringing more hardware online, unbound by headcount considerations. Again, this is a simplification, as the business would need people who are master operators and manipulators of that hardware, but the larger point still holds.
As evidence of this dynamic, take a look at the chart below comparing Salesforce’s revenue per employee with Anthropic’s. Anthropic's revenue per employee has gone practically vertical, rising from figures comparable to Salesforce's as recently as 2023 to $3.9 million in 2025 and approximately $9 million in 2026.
Now, we would obviously note that compute-based scaling replaces labor intensity with compute intensity (depreciation versus salaries) and does not remove intensity altogether. We’d further note that the capital required to fund this compute is enormous, as seen in the skyrocketing capital expenditure bills across hyperscalers.
But from a margin-structure standpoint, the implication still holds. Once the fixed cost of model generation is amortized, incremental inference revenue arrives with very little operating expense attached, and high contribution margins on incremental inference sales lift the model company's margins materially over time.
There is a second, underappreciated layer to compute-based scaling: the labs are scaling on the compute itself. Each hardware generation lowers the cost of producing a token, and algorithmic serving improvements compound on top of that, which is why we believe cost per token at the leading labs has been falling roughly as fast as the prices they charge. We would also apply the same scale logic here as we do for public cloud vendors: once a fleet is large enough, its owner can batch, cache, and route workloads more efficiently than a smaller operator ever could, which is precisely why demand aggregates at a few mega-scale providers. To that end, we view fleet scale itself as a mechanism through which the largest model companies lock in cost advantages as they grow.
Next is how we think they’re building the apparatus to defend these margins and earn excess returns on their invested capital.
Moats Matter, and We Think AI Labs Are Building Them
While we don’t ascribe economic moats to privately held companies, we believe that these firms’ upcoming IPOs will squarely put the question of whether they have durable competitive advantages at the forefront for every public-equity investor.
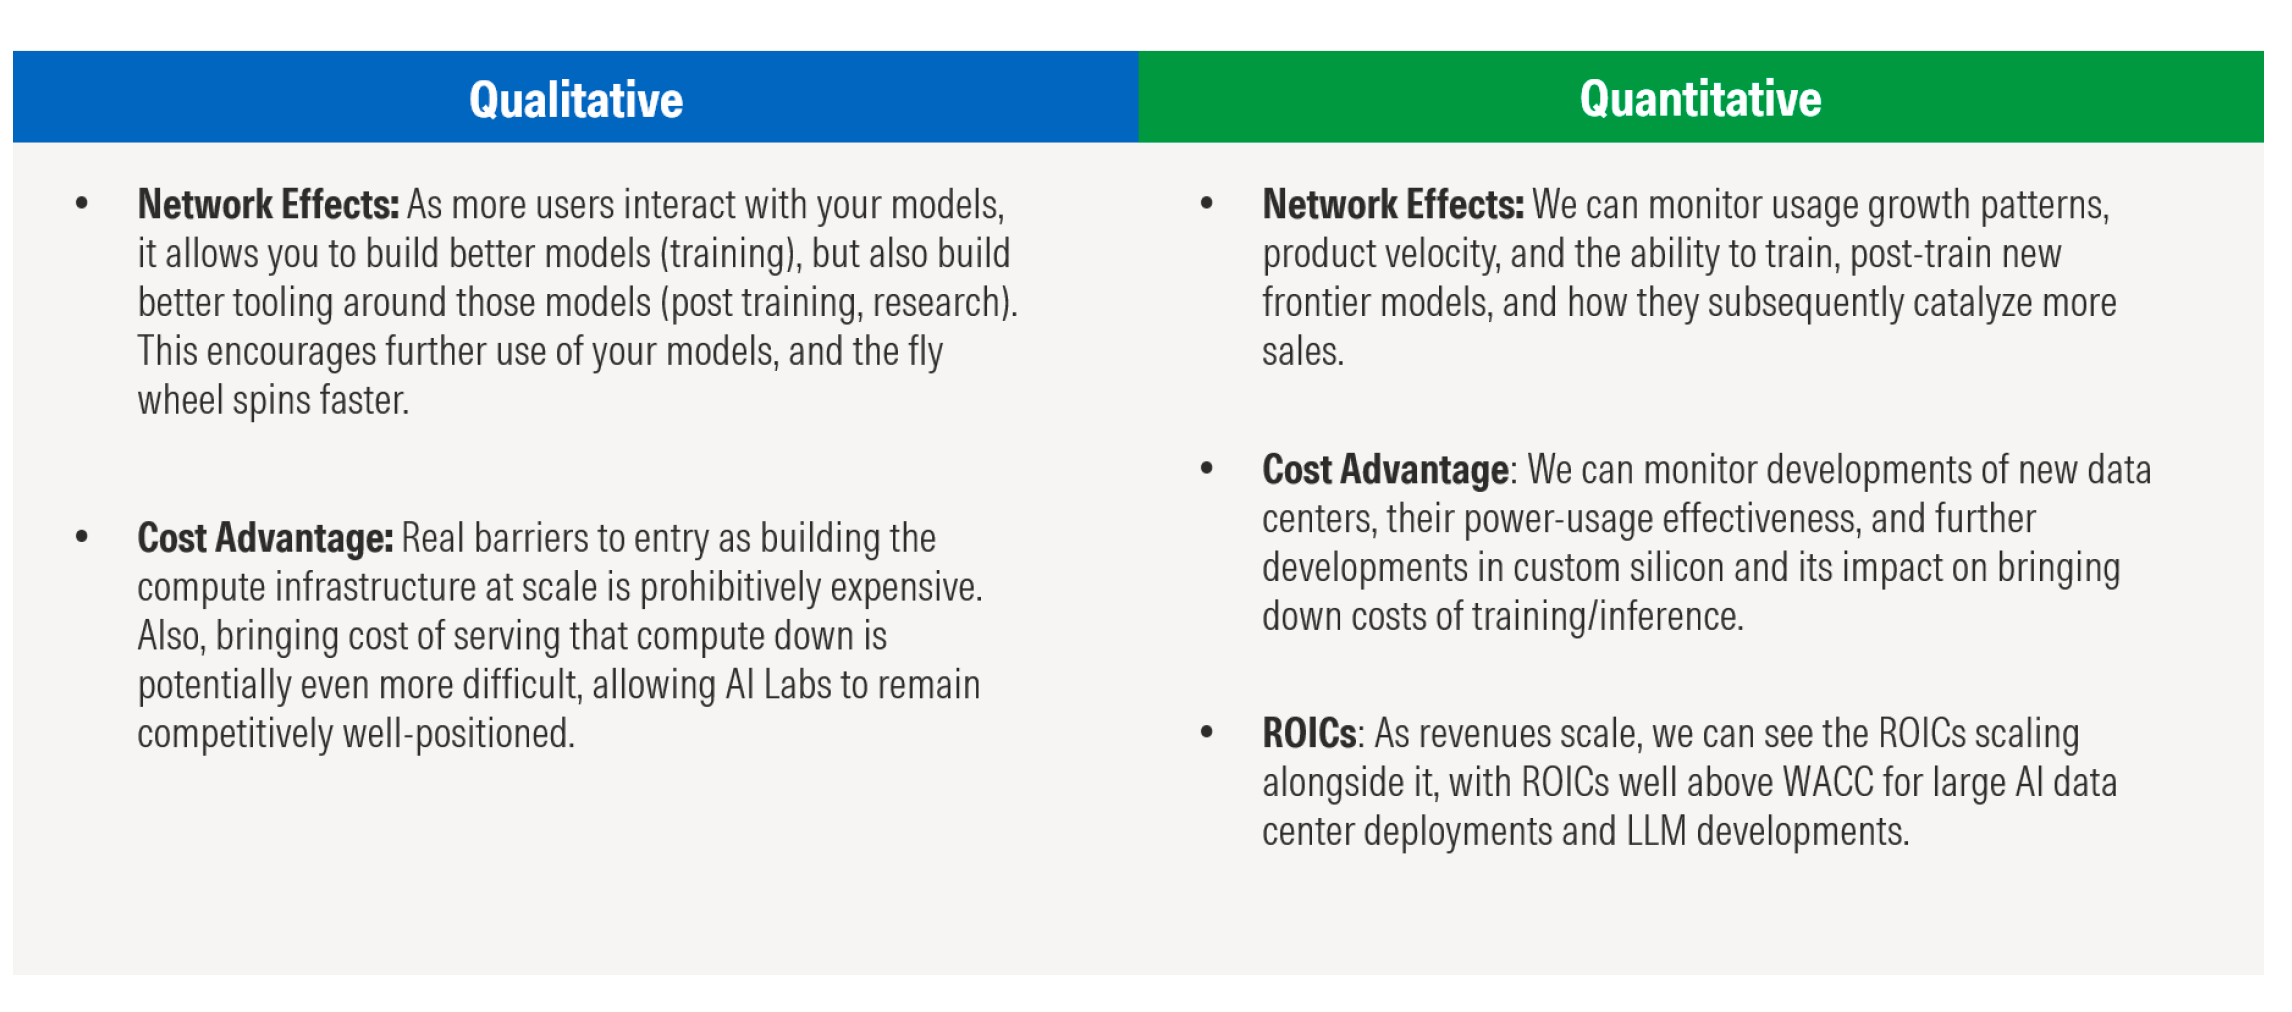
When considering the moat question for these firms, we divide our analysis into two tracks: qualitative and quantitative. We begin by asking whether these businesses, qualitatively, lend themselves to any potential moat sources. Subsequently, we examine these qualitative moat sources using quantitative evidence to support or refute them.
Using this qualitative lens, we see that model firms benefit from two potential sources of moat. First, these businesses naturally lend themselves to network effects. As more users interact with a company’s models, the company can leverage this usage to improve its models over time. For users without enterprise agreements that prohibit these labs from training on their interactions, every interaction feeds into the development of next-generation models. As models improve, we see a clear pattern of increased usage, which in turn generates more data.
Second, while financial disclosures are still limited, we know that building large language models is expensive, and keeping your costs down while building and providing these models at scale is a tough nut to crack. This dynamic opens up the possibility that these firms possess cost advantages over smaller peers and potential new entrants.
While we see inklings of switching costs and intangible assets, we don’t see them as central to our qualitative view of moats within the model space. As we discussed earlier, switching models can often be easy, even if switching AI deployments is not. Further, while we could ascribe intangible assets as a potential moat source for these model businesses, we remain unsure about the durability of “brand” in a developing space, and we are similarly unsure about the durability of intellectual property and internal know-how, as the current pattern in this industry is that most advancements are copied fairly quickly.
Switching to a quantitative lens, we can see evidence of both network effects and cost advantages beginning to emerge at the model layer.
We are seeing usage growth patterns driven by improved product velocity, which is driven by increased usage—a good early indicator that these firms are building a network effect around their businesses.
Similarly, we are seeing these firms use algorithmic advancements, custom silicon, and multiyear compute deals to quantitatively reduce their cost to serve these LLMs, putting them at a clear cost advantage over other firms.
Two Ways To Investigate Moats: Qualitative and Quantitative
Source: Morningstar.
Network Effects: We See the Flywheel Beginning to Spin
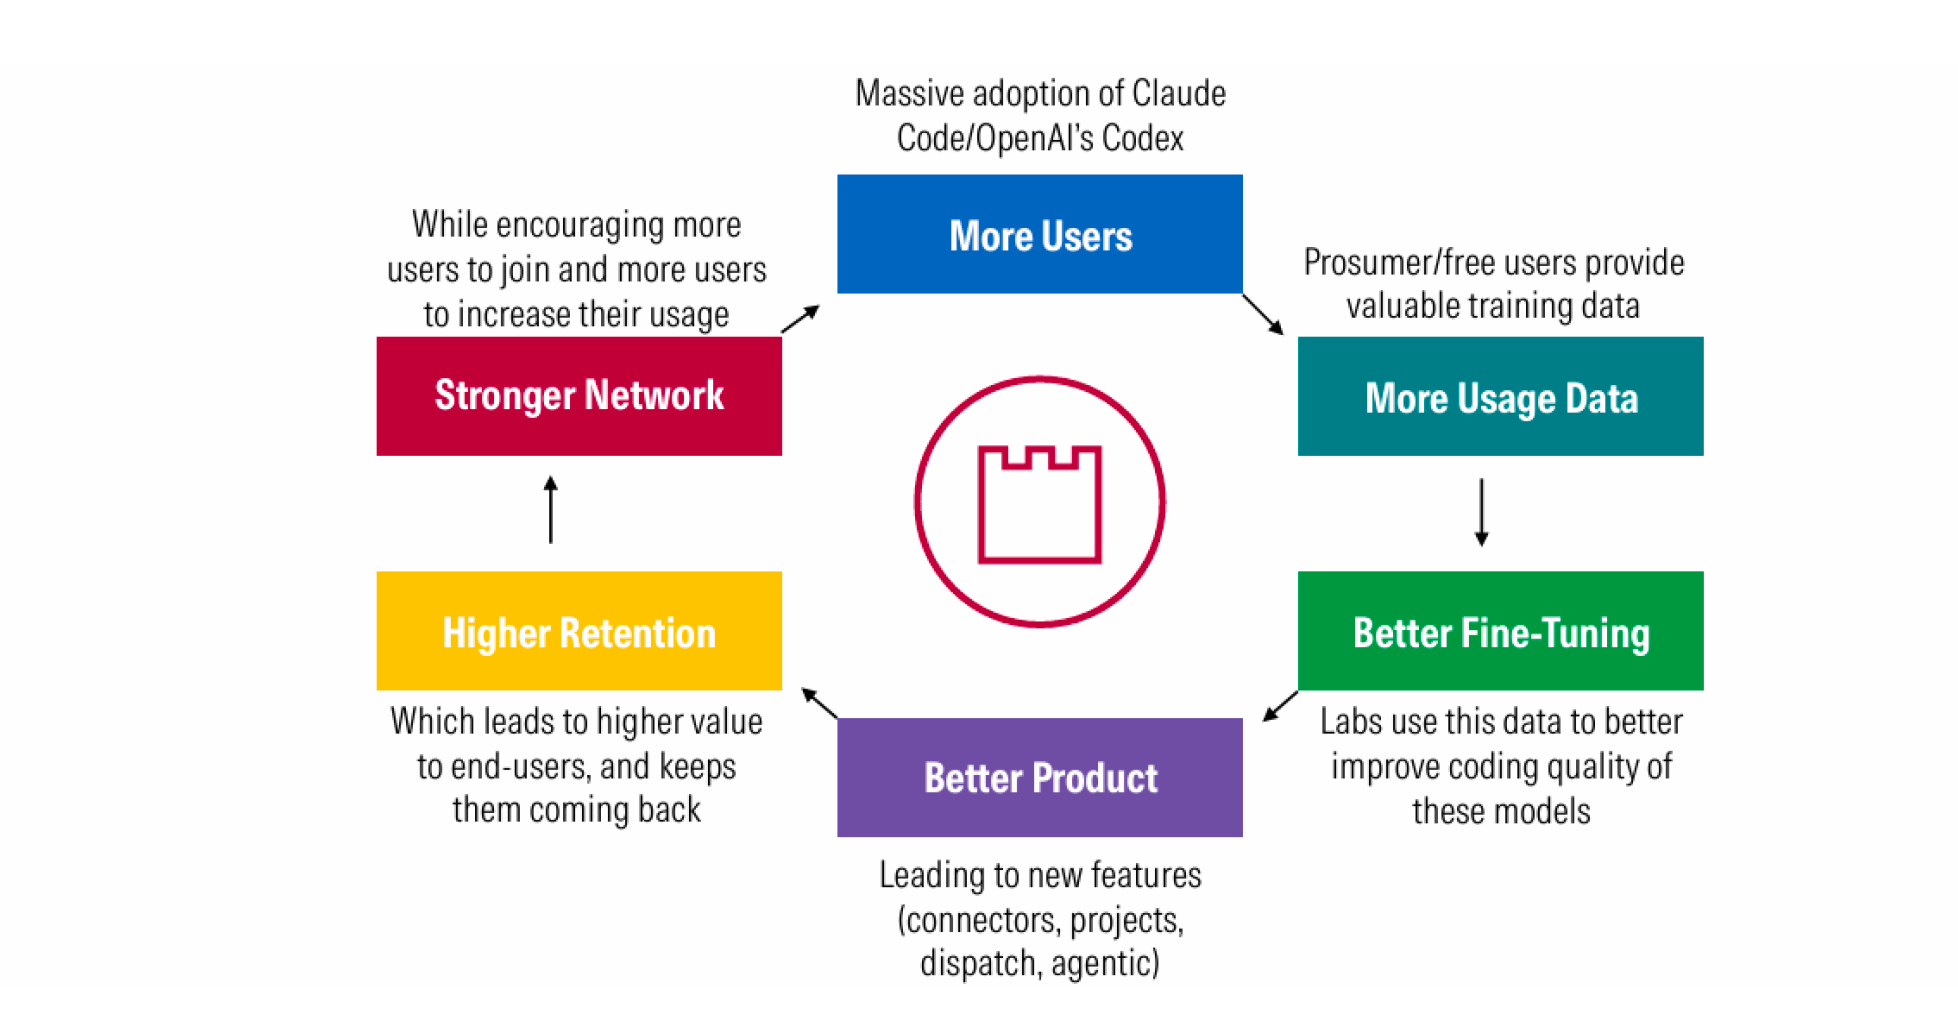
The network effect we observe at the leading labs runs through a six-station flywheel, with early adoption of coding products a clear demonstration of this dynamic. We expect this dynamic to ripple across other model use cases and personas as adoption of this technology broadens beyond the initial software development use case.
Network Effects
Source: Morningstar.
In the coding context, we have seen that improved models lead to greater use of coding tools such as Codex and Claude Code. This increased usage has allowed both Anthropic and OpenAI to collect more data and leverage it to improve their models for those specific use cases. Alongside that, these firms have also leveraged usage data to create new tools and products (Claude Design, financial services and legal research plug-ins, Microsoft Office add-ons). These improvements, both in the model layer and in the tooling around it, keep users on the platform and attract new users.
One dependency we are watching within this flywheel is the growing role of third-party reinforcement-learning environment providers, sometimes described as AI gyms. The major labs appear to rely heavily on these vendors to source task data and evaluation environments, suggesting they do not hold all relevant enterprise-grade training data internally, partly because enterprise agreements restrict training on customer interactions. If the highest-value post-training data ends up owned by third parties selling to every lab, the proprietary-data leg of the flywheel would be weaker than it appears, and we would revisit our network-effect argument accordingly.
We’d remind investors that the flywheel is not a classic direct network effect (such as one that is exhibited by Facebook or Instagram), where each user makes the product mechanically more valuable to other users. Rather, we see the network effect forming around the model businesses as a data-and-product flywheel, which serves as a feedback loop that these model firms can use to iterate faster on both their model and tool development.
We are seeing clear adoption of these tools, and the results are also quantitatively present. For example, Anthropic’s net retention rate, which is a measure of how much extra existing clients are spending on your platform, is north of 500%, well above the gold standard in software, which is around 120%-140%. Also, we see a clear link between the acceleration in Anthropic’s product velocity in recent months and its usage, with both better products and more usage feeding off each other. Part of this acceleration, in our view, reflects the labs increasingly using their own models to write code and run research, an early shade of self-improvement that compounds in favor of whichever lab holds the best models at any given time.
Cost Advantages: We See Four Barriers to Entry
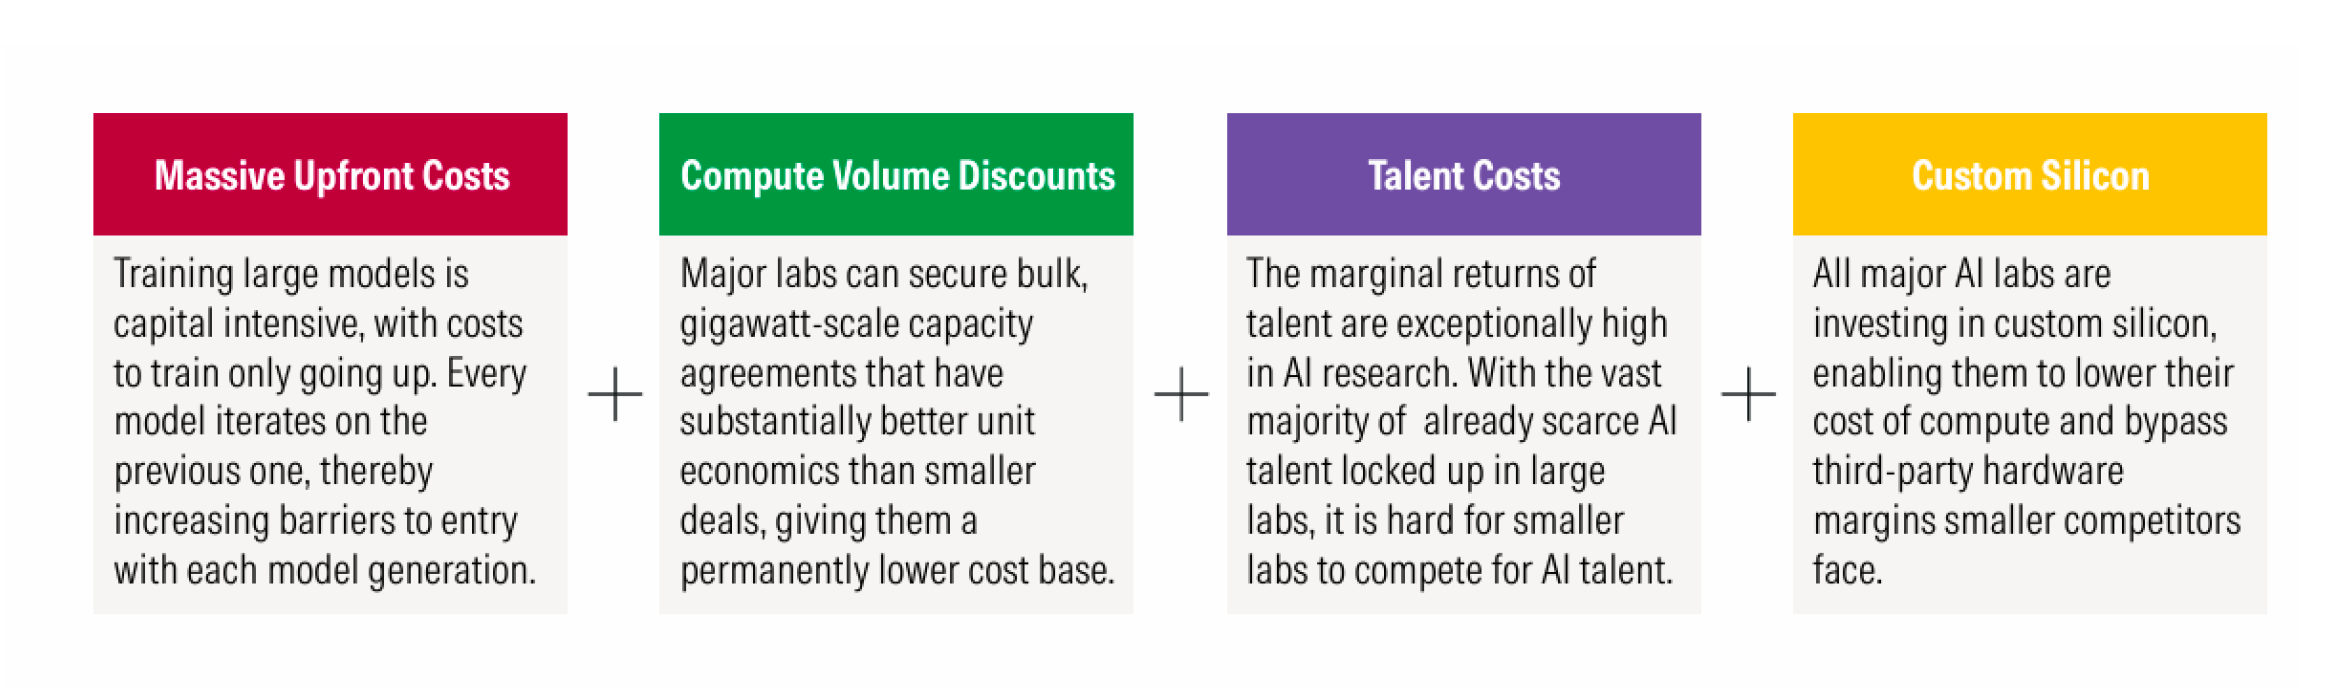
As mentioned above, we believe that the second moat source these model companies are busy constructing is a durable cost advantage. We see this advantage as being built using four reinforcing channels.
Cost Advantages
Source: Morningstar.
First, as we briefly touched on earlier in this piece, training costs for models increase materially with each generation. As a result, a challenger entering today must not merely match the leaders’ current spending, but also have a novel method to “catch up” on the accumulated learning these model companies have gained by iterating through various model architectures and methodologies. We attribute this dynamic to the whittling of the model field from many dozens of model companies claiming to be at the leading edge back in 2023 to just a handful at the frontier in 2026.
Second, leading model companies secure better compute pricing than their smaller peers. The leverage is both volume and commitment term: capacity bought on multiyear reserved terms is priced at roughly $2.25 per B200 GPU hour, compared with $16.11, the list price at the hyperscalers, and the labs are the only buyers able to commit at that duration and scale.
Applied to a gigawatt of capacity, or loosely 465,000 Blackwell-class GPUs, that gap is the difference between a $9 billion and a $66 billion annual compute bill. It is also worth noting that the $9 billion figure sits close to the $10 billion compute budget we used in our stylized income statements earlier, which is to say the labs now operate at gigawatt scale and buy on terms no subscale entrant can access.
Third, AI, unlike much of software development, lends itself well to the “Superstar Effect.” The underlying reason is that much of AI progress and development, as we discussed above, depends on the development of effective training and post-training processes. To do so, however, you need outstanding researchers who demonstrate exceptionally high marginal returns to talent. A good example of this is the hiring spree Meta undertook to build its research team, with some researchers being offered tens of millions of dollars to join Meta. These top researchers are locked up in a handful of labs, leaving smaller labs increasingly unable to attract them. In fact, much of the movement we have seen in talent has been talent moving between large AI labs, not exiting this small group altogether.
Fourth, all major labs are investing in custom AI accelerators. These AI accelerators, as we have seen with Amazon.com’s Trainium and Google’s TPUs, can be much more efficient for training and running inference on AI models, providing AI labs with a permanently lower cost of goods sold than labs or companies building or running models on off-the-shelf GPUs. Beyond cheaper compute on an absolute basis, we believe the leading labs also extract more from each unit of compute they own, with utilization, batching, and goodput optimizations further lowering cost per token. Several of these optimizations scale directly with the absolute size of a lab’s fleet, deepening the advantage as these businesses grow.
Where We Could Be Wrong
If we had a time-travel machine and went five years into the future and found a world in which models were a commodity, we believe the risks highlighted in this section would be major contributors to that future.
Open Models Surprise to the Upside
Our current view is that open models, both Chinese and Western, remain behind the frontier, enabling frontier-model companies to build durable businesses and monetize at significantly higher rates than their open-model counterparts. If, due to a technological breakthrough in either the training or post-training paradigms, research labs releasing open models were able to take the lead on the model layer, it would have a serious impact on our pricing and growth assumptions that underpin the frontier lab's unit economics.
We would frame this risk as having two variants, and the second does not require open models to lead. The first variant is the one described above, in which open models outright surpass the frontier. The second is that open models simply remain close enough to the frontier that the leading labs cannot maintain any durable edge, a dynamic not far from what we observe today. Critically, either variant only challenges our views meaningfully if these advanced open models, which are likely to be Chinese given the intellectual property constraints on Western open efforts, are also widely deployed in the West. Preventing that outcome requires some combination of government action restricting their use and distillation-prevention measures that choke the pipeline feeding the open ecosystem. It also requires scaling laws to keep delivering frontier improvement from here.
Small Language Models on the Edge
Throughout this piece, we have focused on large language models. From a technical perspective, you can take an LLM and distill it down to create small language models, or SLMs. Good examples include quantized versions of models from Google, Qwen, and other labs. The clear gap between the two is that SLMs tend to be significantly less performant than LLMs, primarily due to their smaller size and number of parameters. A long-term risk for LLMs is that research labs could meaningfully reduce them while retaining their intelligence, to the point where these SLMs could run efficiently and effectively on edge devices such as mobile phones, tablets, and computers.
If this were to happen, a growing share of inference would migrate onto local devices. We do not, however, view the migration itself as the core monetization threat. Our view is that if users are still running a distilled version of Claude on their phones, Anthropic can simply change what it charges for, pricing its intellectual property through licensing rather than metered compute. The true risk is that free, open small models prove just as good as the distilled frontier offerings, leaving nothing to charge for, an outcome that effectively folds this risk into the open-model risk above.
Public Opinion
AI has a serious public problem. To understand the extent of this problem, consider the fact that surveys rank AI’s popularity among the general population below that of Congress, a truly remarkable feat. The reason the court of public opinion matters in AI is that local governments and councils have considerable power and influence over data center construction. If, due to public backlash, US data center construction slows down meaningfully, we view the damage as accruing to growth rather than to unit economics. The incremental gross margin earned on inference should hold regardless of how much capacity is added in a given year. A lab with demand to grow severalfold that can build only a fraction of that capacity simply grows more slowly. If anything, constrained supply relative to demand that continues to outstrip it could firm prices and improve unit economics for a time, even as it hamstrings the growth trajectory on which these firms’ valuations depend.
Download Report as a PDF
Research Methodology for Valuing Companies
Overview
At the heart of our valuation system is a detailed projection of a company’s future cash flows, resulting from our analysts’ research. Analysts create custom industry and company assumptions to feed income statement, balance sheet, and capital investment assumptions into our globally standardized, proprietary discounted cash flow, or DCF, modeling templates. We use scenario analysis, in-depth competitive advantage analysis, and a variety of other analytical tools to augment this process. We think analyzing valuation through discounted cash flows presents a better lens for viewing cyclical companies, high-growth firms, businesses with finite lives (mines, for example), or companies expected to generate negative earnings over the next few years. That said, we don’t dismiss multiples altogether but rather use them as supporting cross-checks for our DCF-based fair value estimates. We also acknowledge that DCF models offer their own challenges (including a potential proliferation of estimated inputs and the possibility that the method may miss short-term market-price movements), but we believe these negatives are mitigated by deep analysis and our long-term approach.
Morningstar’s Equity Research Group (“we,” “our”) believes that a company’s intrinsic worth results from the future cash flows it can generate. The Morningstar Rating for stocks identifies stocks trading at a discount or premium to their intrinsic worth—or fair value estimate in Morningstar terminology. Five-star stocks sell for the biggest risk-adjusted discount to their fair values, whereas 1-star stocks trade at premiums to their intrinsic worth.
Four key components drive the Morningstar rating:
- our assessment of the firm’s economic moat.
- our estimate of the stock’s fair value.
- our uncertainty around that fair value estimate.
- the current market price.
This process ultimately culminates in our single-point star rating.
Economic Moat
The Morningstar Economic Moat Rating is a structural feature that Morningstar believes positions a firm to earn durable excess profits over a long period of time, with excess profits defined as returns on invested capital above our estimate of a firm’s cost of capital. The economic moat rating is not an indicator of the investment performance of the investment highlighted in this report. Narrow-moat companies are those that Morningstar believes are more likely than not to achieve normalized excess returns for at least the next 10 years. Wide-moat companies are those that Morningstar believes will earn excess returns for 10 years, with excess returns more likely than not to remain for at least 20 years. Firms without a moat, including those that have a substantial threat of value destruction-related risks related to environmental, social, and governance; industry disruption; financial health; or other idiosyncratic issues, are more susceptible to competition. Morningstar has identified five sources of economic moats: intangible assets, switching costs, network effect, cost advantage, and efficient scale.
Fair Value Estimate
Each stock’s fair value is estimated by using a proprietary discounted cash flow model, which assumes that the stock’s value is equal to the total of the free cash flows of the company is expected to generate in the future, discounted back to the present at the rate commensurate with the riskiness of the cash flows. As with any DCF model, the ending value is highly sensitive to Morningstar’s projections of future growth.
Fair Value Uncertainty
The Morningstar Uncertainty Rating represents the analysts’ ability to bound the estimated value of the shares in a company around the fair value estimate, based on the characteristics of the business underlying the stock, including operating and financial leverage, sales sensitivity to the overall economy, product concentration, pricing power, exposure to material ESG risks, and other company-specific factors. Based on these factors, analysts classify the stock into one of several uncertainty levels: Low, Medium, High, Very High, or Extreme. Our recommended margin of safety—the discount to fair value demanded before we’d recommend buying or selling the stock—widens as our uncertainty of the estimated value of the equity increases.
Market Price
The market prices used in this analysis and noted in the report come from exchanges on which the stock is listed, which we believe is a reliable source.
Morningstar Rating for Stocks
The Morningstar Rating for Stocks is a forward-looking, analyst-driven measure of a stock’s current price relative to the analyst’s estimate of what the shares are worth. Stock star ratings indicate whether a stock, in the equity analyst’s educated opinion, is cheap, expensive, or fairly priced. To rate a stock, analysts estimate what they think it is worth (its “fair value”), using a detailed, long-term cash flow forecast for the company. A stock’s star rating depends on whether its current market price is above or below the fair value estimate. Those stocks trading at large discounts to their fair values receive the highest ratings (4 or 5 stars). Stocks trading at large premiums to their fair values receive lower ratings (1 or 2 stars). A 3-star rating means the current stock price is close to the analyst’s fair value estimate.
Risk Warning
Please note that investments in securities are subject to market and other risks, and there is no assurance or guarantee that the intended investment objectives will be achieved. Past performance of a security may or may not continue in the future and is no indication of future performance. A security investment’s return and an investor’s principal value will fluctuate so that, when redeemed, an investor’s shares may be worth more or less than their original cost.
A security’s current investment performance may be lower or higher than the investment performance noted within the report. Morningstar’s Uncertainty Rating is a useful data point with respect to sensitivity analysis of the assumptions used in our determining a fair value price.
General Disclosure
“Morningstar” is used throughout this section to refer to Morningstar, Inc., and/or its affiliates, as applicable. Unless otherwise provided in a separate agreement, recipients of this report may only use it in the country in which the Morningstar distributor is based. Unless stated otherwise, the original distributor of the report is Morningstar Research Services LLC, a USA-domiciled financial institution.
This report is for informational purposes only, should not be the sole piece of information used in making an investment decision, and has no regard to the specific investment objectives, financial situation, or particular needs of any specific recipient. This publication is intended to provide information to assist investors in making their own investment decisions, not to provide investment advice to any specific investor. Therefore, investments discussed and recommendations made herein may not be suitable for all investors; recipients must exercise their own independent judgment as to the suitability of such investments and recommendations in the light of their own investment objectives, experience, taxation status, and financial position.
The information, data, analyses, and opinions presented herein are not warranted to be accurate, correct, complete, or timely. Unless otherwise provided in a separate agreement, neither Morningstar, Inc., nor the Research Group represents that the report contents meet all of the presentation and/or disclosure standards applicable in the jurisdiction the recipient is located.
Except as otherwise required by law or provided for in a separate agreement, the analyst, Morningstar, Inc., and the Research Group and their officers, directors, and employees shall not be responsible or liable for any trading decisions, damages, or other losses resulting from, or related to, the information, data, analyses, or opinions within the report. The Research Group encourages recipients of this report to read all relevant issue documents—a prospectus, for example—pertaining to the security concerned, including without limitation, information relevant to its investment objectives, risks, and costs before making an investment decision and, when deemed necessary, to seek the advice of a legal, tax, and/or accounting professional.
The report and its contents are not directed to, or intended for distribution to or use by, any person or entity who is a citizen or resident of or located in any locality, state, country, or other jurisdiction where such distribution, publication, availability, or use would be contrary to law or regulation or that would subject Morningstar, Inc., or its affiliates to any registration or licensing requirements in such jurisdiction.
Where this report is made available in a language other than English and in the case of inconsistencies between the English and translated versions of the report, the English version will control and supersede any ambiguities associated with any part or section of a report that has been issued in a foreign language. Neither the analyst, Morningstar, Inc., nor the Research Group guarantees the accuracy of the translations.
This report may be distributed in certain localities, countries, and/or jurisdictions (“territories”) by independent third parties or independent intermediaries and/or distributors (“distributors”). Such distributors are not acting as agents or representatives of the analyst, Morningstar, Inc., or the Research Group. In territories where a distributor distributes our report, the distributor is solely responsible for complying with all applicable regulations, laws, rules, circulars, codes, and guidelines established by local and/or regional regulatory bodies, including laws in connection with the distribution of third-party research reports.
Risk Warning
Please note that investments in securities are subject to market and other risks and there is no assurance or guarantee that the intended investment objectives will be achieved. Past performance of a security may or may not be sustained in future and is no indication of future performance. A security investment return and an investor's principal value will fluctuate so that, when redeemed, an investor's shares may be worth more or less than their original cost.
A security's current investment performance may be lower or higher than the investment performance noted within the report. Morningstar's Uncertainty Rating serves as a useful data point with respect to sensitivity analysis of the assumptions used in our determining a fair value price.
Conflicts of Interest
-
No material interests are held by the analyst or their immediate family with respect to the securities subject of this investment research report.
-
In general, Morningstar will not hold a material interest in the security subject of this report. If a material interest is held by Morningstar, or if Morningstar owns a net long or short position in the security that is the subject of this report that exceeds 0.5% of the total issued share capital of the security, it will be disclosed at https://www.morningstar.com/company/disclosures/holdings.
-
Morningstar employees’ compensation is derived from Morningstar, Inc.’s overall earnings and consists of salary, bonus, and in some cases, restricted stock. Morningstar’s overall earnings are generated in part by the activities of the Investment Management and Research groups, and other affiliates, that provide services to product issuers.
-
Neither Morningstar, Inc., nor its analysts receive commissions, compensation, or other material benefits from product issuers or third parties in connection with this report.
-
Morningstar's overall earnings are generated in part by the activities of the Investment Management and Research groups, and other affiliates, who provide services to product issuers. Morningstar does not receive commissions for providing research and does not charge issuers to be rated.
-
Morningstar employees may not pursue business or employment opportunities outside Morningstar within the investment industry (including, but not limited to, working as a financial planner, an investment professional or investment professional representative, a broker/dealer or broker/dealer agent, a financial writer, reporter, or analyst) without the approval of Morningstar’s Legal and, if applicable, Compliance teams.
-
Certain managed investments use an index created by and licensed from Morningstar, Inc. as their tracking index. We mitigate any actual or potential conflicts of interest resulting from that by not producing qualitative analysis on any such managed investment as well as imposing information barriers (both technology and no-technology) where appropriate and monitoring by the compliance department.
-
Neither Morningstar, Inc., nor the Research Group is a market maker or a liquidity provider of the securities noted within this report.
-
Neither Morningstar, Inc., nor the Research Group has been a lead manager or co-lead manager over the previous 12 months of any publicly disclosed offer of financial instruments of the issuer.
-
Morningstar, Inc.’s Investment Management group has arrangements with financial institutions to provide portfolio management/investment advice, some of which an analyst may issue investment research reports on. In addition, the Investment Management group creates and maintains model portfolios whose underlying holdings can include financial products, including securities that may be the subject of this report. However, analysts do not have authority over Morningstar’s Investment Management group’s business arrangements or allow employees from the Investment Management group to participate or influence the analysis or opinion prepared by them.
-
Morningstar, Inc., is a publicly traded company (ticker: MORN) and thus a financial institution the security of which is the subject of this report may own more than 5% of Morningstar, Inc.’s total outstanding shares. Please access Morningstar, Inc.’s proxy statement, section “Security Ownership of Certain Beneficial Owners and Management,” at https://shareholders.morningstar.com/investor-relations/financials/sec-filings/default.aspx. A security's holding of Morningstar stock has no bearing on and is not a requirement for which securities Morningstar determines to cover.
Morningstar, Inc. may provide the product issuer or its related entities with services or products for a fee and on an arm’s-length basis, including software products and licenses, research and consulting services, data services, licenses to republish our ratings and research in their promotional material, event sponsorship, and website advertising.
Further information on Morningstar’s conflict-of-interest policies is available at http://global.morningstar.com/equitydisclosures. Please note that analysts are subject to the CFA Institute’s Code of Ethics and Standards of Professional Conduct.
For a list of securities the Research Group currently covers and provides written analysis on, or for historical analysis of covered securities, including fair value estimates, please contact your local Morningstar office. Morningstar Research methodologies can be found at Investor Relations | Morningstar, Inc.
For current Morningstar clients, please reach out to your respective Client Success Manager for more information on how you can best leverage this research within your firm. For all others, please reach out to our business development team at dtainsidesales@morningstar.com to learn more about Morningstar’s various offerings and more details about how you can leverage this research.
For recipients in Australia: This report has been issued and distributed in Australia by Morningstar Australasia Pty. Ltd. (ABN: 95 090 665 544; AFSL: 240892). Morningstar Australasia Pty. Ltd. is the provider of the general advice (“the service”) and takes responsibility for the production of this report. The service is provided through the research of investment products. To the extent the report contains general advice, it has been prepared without reference to an investor’s objectives, financial situation, or needs. Investors should consider the advice in light of these matters and, if applicable, the relevant Product Disclosure Statement before making any decision to invest. Refer to our Financial Services Guide for more information at http://www.morningstar.com.au/s/fsg.pdf.
For recipients in New Zealand: This report has been issued and distributed by Morningstar Australasia Pty Ltd and/or Morningstar Research Ltd (together “Morningstar”). This report has been prepared and is intended for distribution in New Zealand to wholesale clients only and has not been prepared for use by New Zealand retail clients (as those terms are defined in the Financial Markets Conduct Act 2013).
The information, views, and any recommendations in this material are provided for general information purposes only, and solely relate to the companies and investment opportunities specified within. Our reports do not take into account any particular investor’s financial situation, objectives, or appetite for risk, meaning no representation may be implied as to the suitability of any financial product mentioned for any particular investor. We recommend seeking financial advice before making any investment decision.
For recipients in Canada: This research is not prepared subject to Canadian disclosure requirements.
For recipients in Europe: This report is distributed by Morningstar Holland B.V., a wholly owned subsidiary of Morningstar, Inc. Morningstar Holland B.V. is not required to be regulated by the European Securities and Markets Authority for the provision of investment research data. The analyst/s involved in the creation of the report do not take into account any particular investor’s financial situation, objectives, or appetite for risk, meaning no representation may be implied as to the suitability of any financial product mentioned for any particular investor. Registered address: Haaksbergweg 58, 9th Floor, 1101 BZ Amsterdam, North Holland, Netherlands.
For recipients in India: This report is issued by Morningstar Investment Research India Private Limited (formerly known as Morningstar Investment Adviser India Private Limited). Morningstar Investment Research India Private Limited is registered with SEBI as an Investment Adviser (Registration number INA000001357), as a Portfolio Manager (Registration number INP000006156) and as a Research Entity (Registration Number INH000008686). Morningstar Investment Research India Private Limited has not been the subject of any disciplinary action by SEBI or any other legal/regulatory body. Morningstar Investment Research India Private Limited is a wholly owned subsidiary of Morningstar Investment Management LLC. In India, Morningstar Investment Research India Private Limited has one associate, Morningstar India Private Limited, which provides data-related services, financial data analysis, and software development. The Research Analyst has not served as an officer, director, or employee of the fund company within the last 12 months, nor has it or its associates engaged in market-making activity for the fund company.
For recipients in Hong Kong: The report is distributed by Morningstar Investment Management Asia Limited, which is regulated by the Hong Kong Securities and Futures Commission to provide investment research and investment advisory services to professional investors only. Neither Morningstar Investment Management Asia Limited nor its representatives are acting or will be deemed to be acting as an investment advisor to any recipients of this information unless expressly agreed to by Morningstar Investment Management Asia Limited.
For recipients in Japan: This report is distributed by Morningstar Japan, Inc. for informational purposes only. Neither Morningstar Japan, Inc. nor its representatives are acting or will be deemed to be acting as an investment advisor to any recipients of this information.
For recipients in Korea: The report is distributed by Morningstar Korea Ltd., which has filed with the Financial Supervisory Service, for informational purposes only. Neither Morningstar Korea Ltd. nor its representatives are acting or will be deemed to be acting as an investment advisor to any recipients of this information.
For recipients in Singapore: This report is distributed by Morningstar Investment Adviser Singapore Pte Limited, which is licensed and regulated by the Monetary Authority of Singapore to provide financial advisory services in Singapore. Recipients of this report should contact their financial advisor in Singapore in relation to this report. Morningstar, Inc., and its affiliates rely on certain exemptions (Financial Advisers Regulations, Section 27(1)(e), Section 32, Band 32C) to provide its investment research to recipients in Singapore.
For recipients in the United Kingdom: This report is distributed by Morningstar UK Ltd, a wholly owned subsidiary of Morningstar, Inc. Morningstar UK Ltd. is not required to be registered nor authorized by the Financial Conduct Authority for the distribution of investment research data. The analyst/s involved in the creation of the report do not take into account any particular investor’s financial situation, objectives, or appetite for risk, meaning no representation may be implied as to the suitability of any financial product mentioned for any particular investor. There are information barriers in place between Morningstar UK Ltd and Morningstar regulated entities based in the UK. Registered address: 1 Oliver’s Yard, 55-71 City Road, London EC1Y 1HQ.
About Morningstar Equity Research
Morningstar Equity Research provides independent, fundamental equity research differentiated by a consistent focus on durable competitive advantages, or economic moats.
For More Information
+1 312 696-6000
equitysupport@morningstar.com
©2026 Morningstar. All Rights Reserved. Unless otherwise provided in a separate agreement, you may use this report only in the country in which its original distributor is based. The information, data, analyses, and opinions presented herein do not constitute investment advice; are provided solely for informational purposes and therefore are not an offer to buy or sell a security; and are not warranted to be correct, complete, or accurate. The opinions expressed are as of the date written and are subject to change without notice. Except as otherwise required by law, Morningstar shall not be responsible for any trading decisions, damages, or other losses resulting from, or related to, the information, data, analyses, or opinions or their use. Investment research is produced and issued by subsidiaries of Morningstar, Inc. The information contained herein is the proprietary property of Morningstar and may not be reproduced, in whole or in part, or used in any manner, without the prior written consent of Morningstar. To license the research, call +1 312 696-6000.